


(i) To propose regression equations based on anthropometric measures to estimate fat mass (FM) using dual energy X-ray absorptiometry (DXA) as reference method, and (ii) to establish population reference standards for equation-derived FM.
Material and methodsA cross-sectional study on 6713 university students (3354 males and 3359 females) from Chile aged 17.0 to 27.0 years. Anthropometric measures (weight, height, waist circumference) were taken in all participants. Whole body DXA was performed in 683 subjects. A total of 478 subjects were selected to develop regression equations, and 205 for their cross-validation. Data from 6030 participants were used to develop reference standards for FM. Equations were generated using stepwise multiple regression analysis. Percentiles were developed using the LMS method.
ResultsEquations for men were: (i) FM=−35,997.486+232.285*Weight+432.216*CC (R2=0.73, SEE=4.1); (ii) FM=−37,671.303+309.539*Weight+66,028.109*ICE (R2=0.76, SEE=3.8), while equations for women were: (iii)FM=−13,216.917+461,302*Weight+91.898*CC (R2=0.70, SEE=4.6), and (iv) FM=−14,144.220+464.061*Weight+16,189.297*ICE (R2=0.70, SEE=4.6). Percentiles proposed included p10, p50, p85, and p95.
ConclusionThe developed equations provide valid and accurate estimation of FM in both sexes. The values obtained using the equations may be analyzed from percentiles that allow for categorizing body fat levels by age and sex.
a) Proponer ecuaciones basadas en índices antropométricos para estimar la masa grasa (MG) utilizando como método de referencia la absorciometría de rayos X de doble energía (DXA), y b) establecer normas de referencia para valorar la MG estimada.
Material y métodosEstudio transversal en 6.713 jóvenes universitarios (3.354 hombres y 3.359 mujeres) de Chile con un rango de edad comprendido entre los 17,0 y los 27,0 años. Se obtuvieron medidas antropométricas (peso, talla y perímetro cintura) en todos los participantes. Se realizó una DXA en 683 participantes. Un total de 478 sujetos fueron seleccionados para desarrollar ecuaciones de regresión y 205 para su validación cruzada. Los percentiles se desarrollaron con los datos de 6.030 participantes. Para generar las ecuaciones se utilizó el análisis de regresión múltiple por pasos. Para desarrollar los percentiles se utilizó el método LMS.
ResultadosLas ecuaciones para hombre fueron: 1) MG=−35.997,486+232,285*Peso+432,216*CC (R2=0,73, EEE=4,1); 2) MG=−37.671,303+309,539*Peso+66.028,109*ICE (R2=0,76, EEE=3.8), y para mujeres fueron: 3) MG=−13.216,917+461,302*Peso+91,898*CC (R2=0,70, EEE=4,6), y 4) MG=−14.144,220+464,061*Peso+16.189,297*ICE (R2=0,70, EEE=4,6). Los percentiles propuestos son: p10, p50, p85 y p95.
ConclusiónLas ecuaciones desarrolladas proporcionan predicciones válidas y exactas para estimar la MG de jóvenes universitarios de ambos sexos. Los valores obtenidos mediante la aplicación de estas ecuaciones pueden ser analizados a partir de percentiles que permiten categorizar los niveles de adiposidad corporal por rango de edad y sexo.
There is growing interest in establishing methods for categorizing fat mass (FM) and its variations,1,2 since the generally used excess body fat markers are subject to limitations.3
Adipose tissue has a complex regulatory function and exerts multiple effects upon lean mass.2 Excess FM is associated with an increased risk of cardiovascular diseases, type 2 diabetes, arterial hypertension and other disorders.4 In addition, reduced muscle mass has been related to fractures in children, adolescents and adults.5,6
Chile is the Latin American country with the highest overweight and obese rates in the general population.7,8 Moreover, studies have described changes in the distribution of FM and in certain cardiovascular risk factors in recent years among young populations.9,10 For example, Cossio-Bolaños et al.10 reported a significant increase in waist circumference, with no variations in the body mass index (BMI), for all BMI ranges in Chilean university students during the period 2007–2014.
Recently, the CDC-201211 has proposed a number of anthropometric indicators for evaluating adiposity, including the BMI, skin folds and waist circumference, for all stages of life. These international references make it possible to compare and monitor health throughout the world, but may be subject to limitations, since there are important genotypic, phenotypic and sociocultural differences between regions and countries.
Many governments and United Nations agencies rely on international references for measuring population wellbeing, defining health-related policies, planning interventions, and monitoring their efficacy.12 However, the development of equations to estimate FM in university students based on anthropometric variables and indicators could be useful as a complement to other adiposity indices and/or for monitoring changes in body composition after a given intervention. Furthermore, they would allow for the definition of regional reference standards according to age and gender.
The present study was carried out with the following objectives: (a) to propose regression equations for estimating FM and analyze their cross-validity, using dual-energy X-ray absorptiometry (DXA) as the reference method; and (b) to establish reference standards for assessing FM from regression equations based on anthropometric variables and indicators.
MethodsStudy design, sample and participantsA cross-sectional study was made of 6713 students (3354 males and 3359 females) from three universities (private, semi-private and public, respectively) in the region of Maule, Chile. The age range was 17.0–27.0years. The capital of the region is Talca, located 270km south of the capital, Santiago de Chile. The economy of the region is based on agriculture and cattle raising, as well as wine production.
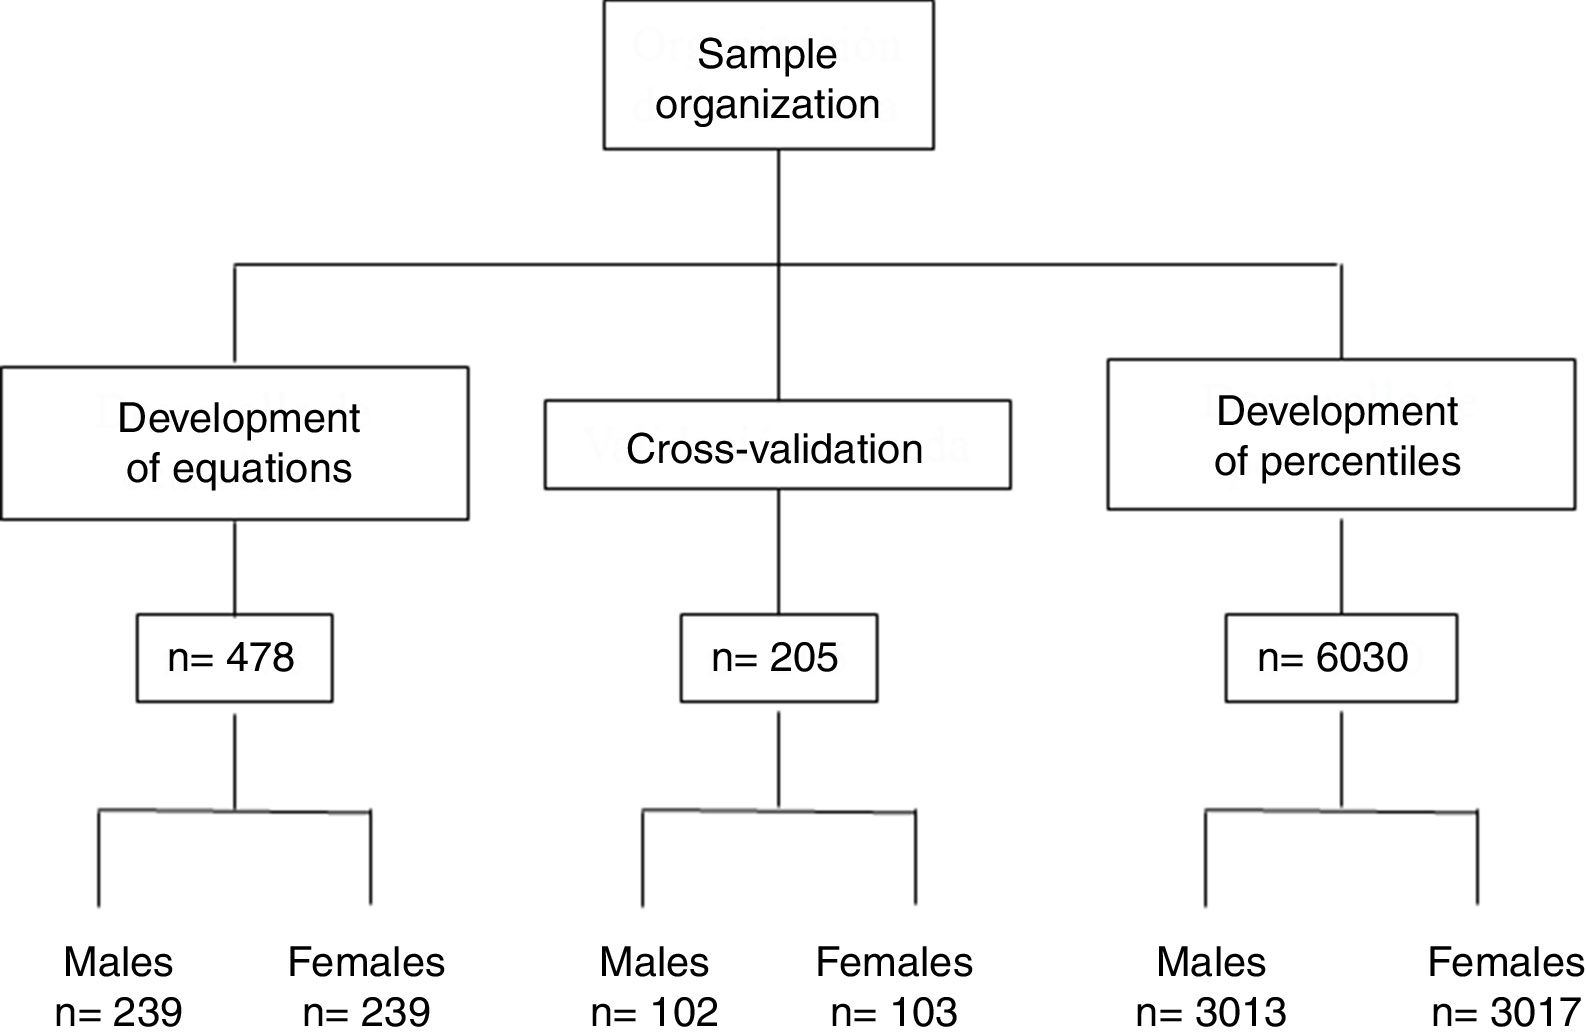
Of the 6713 participants, 683 were evaluated by whole body DXA (10.2% of the global study sample); 478 of these subjects were then selected for the development of regression equations and 205 for cross-validation. The data of the remaining 6030 participants were used for the development of the percentiles. Fig. 1 shows the distribution and organization of the study sample.

All students of ages above and under the established range were excluded, as were those who did not give their informed consent, those failing to report on the day of the evaluation, and those who smoked at least once a week (smoking is associated with increased central obesity and is a morbidity-mortality predictor). The study was approved by the Ethics Committee of the Universidad Autónoma de Chile (Chile), and all participants were duly informed before the DXA and anthropometric evaluations.
ProceduresData such as age, gender, study institution and smoking habits were compiled from a personal file. The anthropometric evaluations and DXA scans were made in an closed laboratory (20–24°C) belonging to the Universidad Autónoma de Chile (Talca, Chile). The evaluations were made between January and June 2015. Timing was established according to student availability and lecture hours (from 8:00a.m. to 1:00p.m. and from 2:00p.m. to 6:00p.m., Monday to Saturday).
Body weight (in kg) was recorded using an electronic scale (Tanita, United Kingdom) from 0 to 150kg and with a precision of 100g. Height was measured with a portable stadiometer (Seca Gmbh & Co. KG, Hamburgo, Germany) with a precision of 0.1mm, based on the Frankfurt plane. Waist circumference (in cm) was measured at the midpoint between the lower ribs and the upper part of the iliac crest, using a Seca metal metric tape calibrated in millimeters and with a precision of 0.1cm. The evaluations were made by 6 technicians trained in anthropometric measurements. The procedure was based on the standardized protocol of Ross and Marfell-Jones.13 The BMI and waist-height ratio (WHR) were calculated.
Whole body (except the head) DXA exploration was made. The whole body scan was obtained with a Lunar Prodigy system (General Electric, Fairfield, CT, USA). The FM values for both genders were calculated. The evaluations were made by two experienced technicians. Exploration was carried out with the subject in dorsal decubitus, with the arms and legs extended and in pronation. The ankles were fixed with Velcro tape to ensure standard positioning. A total of 68 students (34 males and 34 females) were scanned in duplicate in order to confirm the reliability of the measurements. The technical error of measurement (TEM) showed values of under 2.5%.
Statistical analysisThe statistical calculations were made using MS Excel spreadsheets and the SPSS version 16.0 statistical package. The normal distribution of variables was confirmed using the Kolmogorov–Smirnov test. Descriptive statistics were calculated, with the arithmetic mean, standard deviation and range. The Student t-test for paired samples was used to explore differences between the equations group and the cross-validation group, while the Student t-test for independent samples was used to contrast gender differences. The Pearson correlation coefficient was used to confirm the associations between variables. Stepwise multiple regression analysis was subsequently performed to identify the best combination of FM predictive variables. The equations were analyzed based on R2 and the standard error of the estimate, and multi-colinearity was assessed by means of the variance inflation factor (VIF). Bland–Altman plots14 were used in two scenarios: to confirm concordance between the reference values (DXA) and the developed equations, and to confirm concordance between the reference values (DXA) and the cross-validation group. Cross-validation was made based on the suggestions of Sun et al.,15 using 10% of the scanned study sample.
In order to plot the percentile curves, we first calculated FM in 6030 subjects using the four proposed equations. The curves were then plotted adjusted for FM according to age range and gender, based on the LMS method. The LMS Chart Maker version 2.3 package was used.16 The final percentile curves were adjusted to create three specific curves according to age: L (lambda; asymmetry), M (mu; median) and S (sigma; coefficient of variation). Percentiles p5, p10, p50, p85 and p95 were calculated. The significance level used was 0.05.
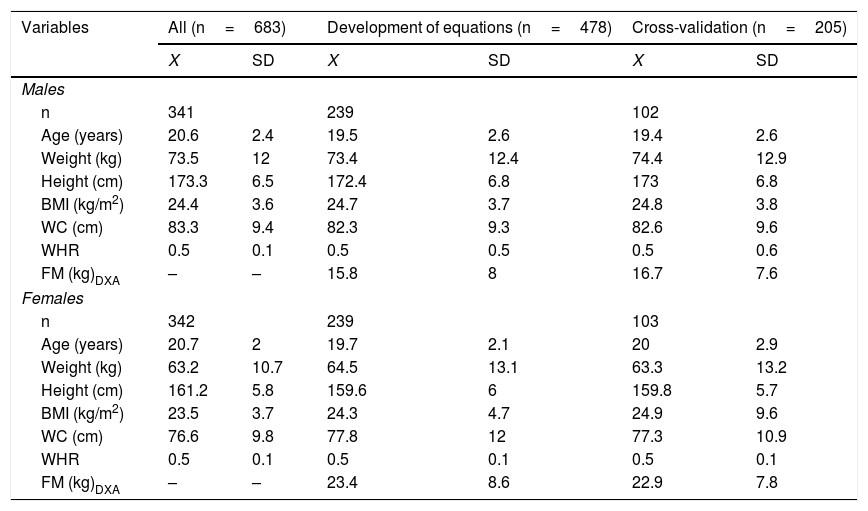
ResultsThe variables characterizing the sample used to develop the equations and perform the cross-validation are reported in Table 1. There were no significant differences between the two groups in terms of any of the anthropometric variables or body adiposity indicators (p>0.05).
Anthropometric characteristics and body adiposity indicators used to develop and validate equations for estimating fat mass (FM).
| Variables | All (n=683) | Development of equations (n=478) | Cross-validation (n=205) | |||
|---|---|---|---|---|---|---|
| X | SD | X | SD | X | SD | |
| Males | ||||||
| n | 341 | 239 | 102 | |||
| Age (years) | 20.6 | 2.4 | 19.5 | 2.6 | 19.4 | 2.6 |
| Weight (kg) | 73.5 | 12 | 73.4 | 12.4 | 74.4 | 12.9 |
| Height (cm) | 173.3 | 6.5 | 172.4 | 6.8 | 173 | 6.8 |
| BMI (kg/m2) | 24.4 | 3.6 | 24.7 | 3.7 | 24.8 | 3.8 |
| WC (cm) | 83.3 | 9.4 | 82.3 | 9.3 | 82.6 | 9.6 |
| WHR | 0.5 | 0.1 | 0.5 | 0.5 | 0.5 | 0.6 |
| FM (kg)DXA | – | – | 15.8 | 8 | 16.7 | 7.6 |
| Females | ||||||
| n | 342 | 239 | 103 | |||
| Age (years) | 20.7 | 2 | 19.7 | 2.1 | 20 | 2.9 |
| Weight (kg) | 63.2 | 10.7 | 64.5 | 13.1 | 63.3 | 13.2 |
| Height (cm) | 161.2 | 5.8 | 159.6 | 6 | 159.8 | 5.7 |
| BMI (kg/m2) | 23.5 | 3.7 | 24.3 | 4.7 | 24.9 | 9.6 |
| WC (cm) | 76.6 | 9.8 | 77.8 | 12 | 77.3 | 10.9 |
| WHR | 0.5 | 0.1 | 0.5 | 0.1 | 0.5 | 0.1 |
| FM (kg)DXA | – | – | 23.4 | 8.6 | 22.9 | 7.8 |
WC: waist circumference; WHR: waist-height ratio; BMI: body mass index.
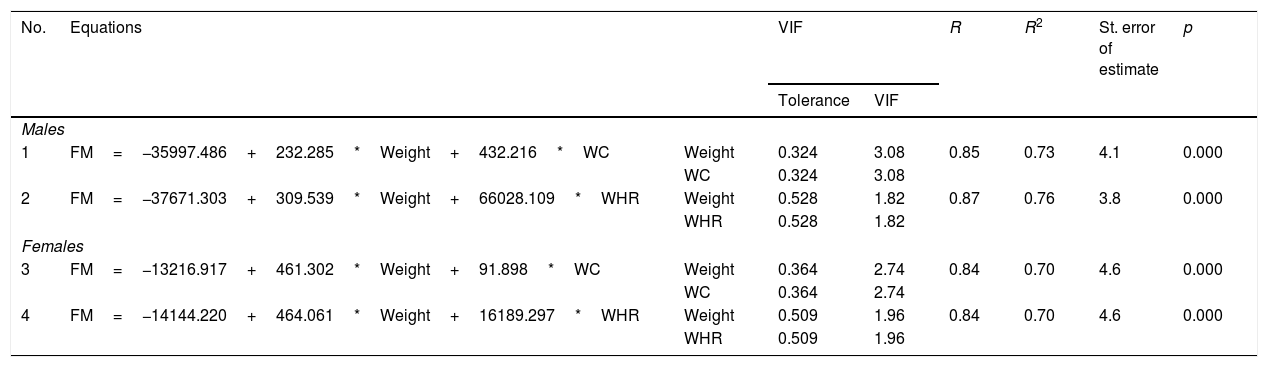
The regression equations proposed for estimating FM are shown in Table 2. The four equations exhibited an explanatory capacity of between 70% and 76%, a standard error of the estimate of 3.8–4.6%, and a VIF of under 3.08 in all cases. The four equations proved significant (p<0.001), with greater explanatory capacity in males than in females (3–6%).
Regression equations developed for estimating fat mass in university students.
| No. | Equations | VIF | R | R2 | St. error of estimate | p | ||
|---|---|---|---|---|---|---|---|---|
| Tolerance | VIF | |||||||
| Males | ||||||||
| 1 | FM=−35997.486+232.285*Weight+432.216*WC | Weight | 0.324 | 3.08 | 0.85 | 0.73 | 4.1 | 0.000 |
| WC | 0.324 | 3.08 | ||||||
| 2 | FM=−37671.303+309.539*Weight+66028.109*WHR | Weight | 0.528 | 1.82 | 0.87 | 0.76 | 3.8 | 0.000 |
| WHR | 0.528 | 1.82 | ||||||
| Females | ||||||||
| 3 | FM=−13216.917+461.302*Weight+91.898*WC | Weight | 0.364 | 2.74 | 0.84 | 0.70 | 4.6 | 0.000 |
| WC | 0.364 | 2.74 | ||||||
| 4 | FM=−14144.220+464.061*Weight+16189.297*WHR | Weight | 0.509 | 1.96 | 0.84 | 0.70 | 4.6 | 0.000 |
| WHR | 0.509 | 1.96 | ||||||
WC: waist circumference; VIF: variance inflation factor; WHR: waist-height ratio; FM: fat mass.
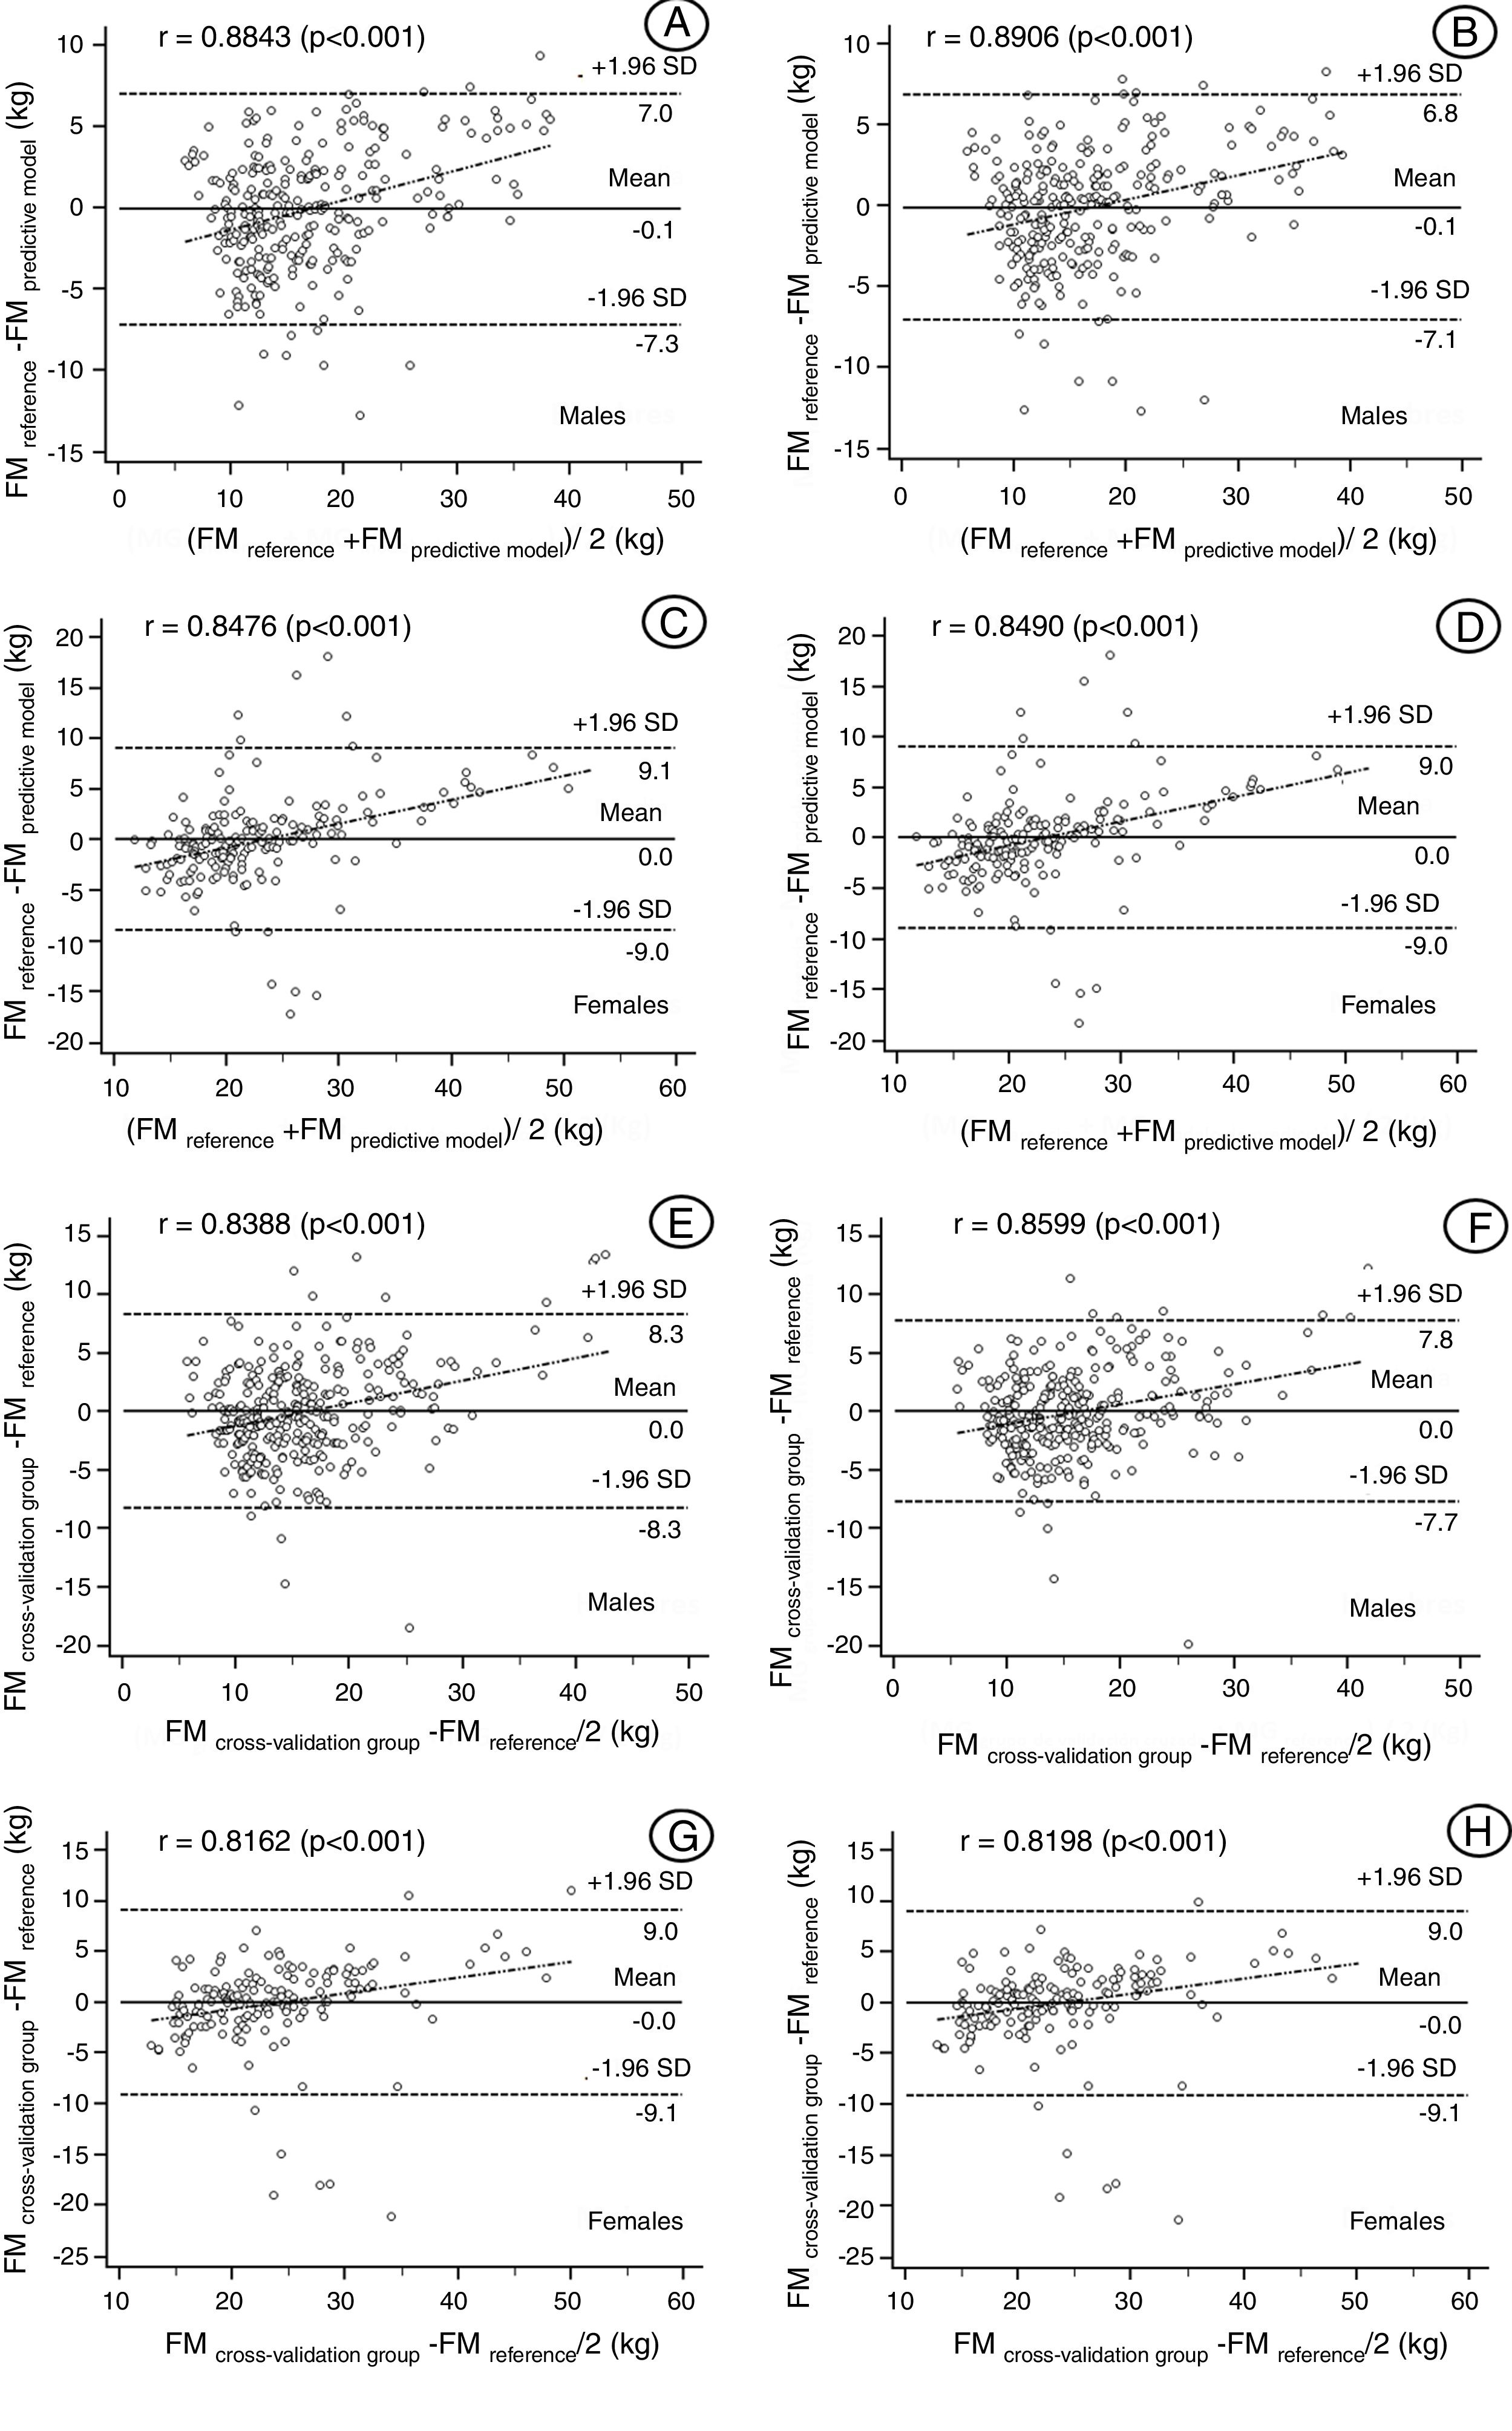
The concordance between the FM values determined by the reference method (DXA) and the values estimated by the regression equations is shown in Fig. 2(A–D). The Bland–Altman plots showed wide limits of agreement with the reference. The values ranged between −7.3 and 9.1kg in males and between −7.1 and 9.0kg in females. The four models developed showed moderate to strong correlations of between 0.84 and 0.99, and all four models proved significant (p<0.001). Fig. 2(E–H) shows the concordance between the reference values (DXA) and the cross-validation group. The values ranged between −8.3 and 9.0kg in males and between −7.7 and 9.0kg in females. These results therefore reflect wide limits of agreement with the reference method (DXA), as well as the correlations for both genders, with values in all four models of between 0.81 and 0.85, respectively.
 and the FM predictive models (A–D) and cross-validation group (E–H). Solid line: difference of means; dashed line: 95% concordance limits.")
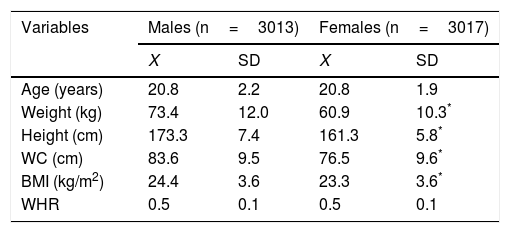
The variables characterizing the sample used to develop the percentiles are shown in Table 3. Males presented greater body weight, height, waist circumference and BMI compared with females (p<0.001). There were no significant gender differences regarding either age or WHR (p>0.05).
Anthropometric characteristics of the sample used for the development of reference standards (n=6.030).
| Variables | Males (n=3013) | Females (n=3017) | ||
|---|---|---|---|---|
| X | SD | X | SD | |
| Age (years) | 20.8 | 2.2 | 20.8 | 1.9 |
| Weight (kg) | 73.4 | 12.0 | 60.9 | 10.3* |
| Height (cm) | 173.3 | 7.4 | 161.3 | 5.8* |
| WC (cm) | 83.6 | 9.5 | 76.5 | 9.6* |
| BMI (kg/m2) | 24.4 | 3.6 | 23.3 | 3.6* |
| WHR | 0.5 | 0.1 | 0.5 | 0.1 |
WC: waist circumference; WHR: waist-height ratio; BMI: body mass index.
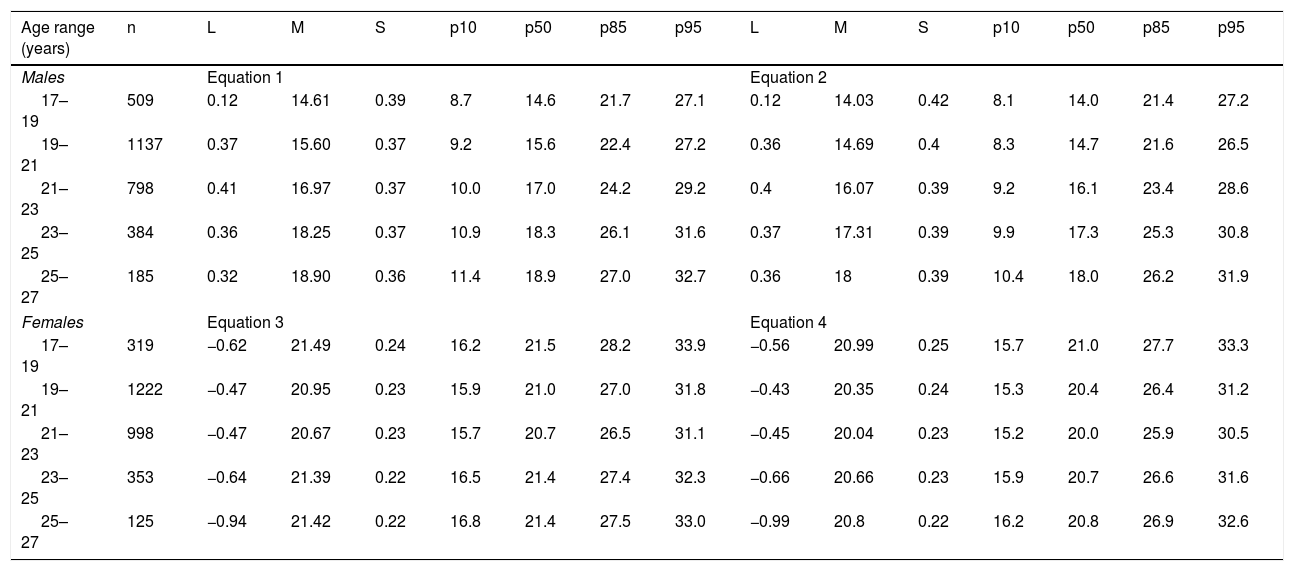
The FM values (in kg) estimated by the regression equations were represented by percentiles based on the LMS method. Table 4 shows the percentile distribution (p10, p50, p85 and p95) according to age range and gender.
Percentile values for assessing fat mass in university students according to age range and gender.
| Age range (years) | n | L | M | S | p10 | p50 | p85 | p95 | L | M | S | p10 | p50 | p85 | p95 |
|---|---|---|---|---|---|---|---|---|---|---|---|---|---|---|---|
| Males | Equation 1 | Equation 2 | |||||||||||||
| 17–19 | 509 | 0.12 | 14.61 | 0.39 | 8.7 | 14.6 | 21.7 | 27.1 | 0.12 | 14.03 | 0.42 | 8.1 | 14.0 | 21.4 | 27.2 |
| 19–21 | 1137 | 0.37 | 15.60 | 0.37 | 9.2 | 15.6 | 22.4 | 27.2 | 0.36 | 14.69 | 0.4 | 8.3 | 14.7 | 21.6 | 26.5 |
| 21–23 | 798 | 0.41 | 16.97 | 0.37 | 10.0 | 17.0 | 24.2 | 29.2 | 0.4 | 16.07 | 0.39 | 9.2 | 16.1 | 23.4 | 28.6 |
| 23–25 | 384 | 0.36 | 18.25 | 0.37 | 10.9 | 18.3 | 26.1 | 31.6 | 0.37 | 17.31 | 0.39 | 9.9 | 17.3 | 25.3 | 30.8 |
| 25–27 | 185 | 0.32 | 18.90 | 0.36 | 11.4 | 18.9 | 27.0 | 32.7 | 0.36 | 18 | 0.39 | 10.4 | 18.0 | 26.2 | 31.9 |
| Females | Equation 3 | Equation 4 | |||||||||||||
| 17–19 | 319 | −0.62 | 21.49 | 0.24 | 16.2 | 21.5 | 28.2 | 33.9 | −0.56 | 20.99 | 0.25 | 15.7 | 21.0 | 27.7 | 33.3 |
| 19–21 | 1222 | −0.47 | 20.95 | 0.23 | 15.9 | 21.0 | 27.0 | 31.8 | −0.43 | 20.35 | 0.24 | 15.3 | 20.4 | 26.4 | 31.2 |
| 21–23 | 998 | −0.47 | 20.67 | 0.23 | 15.7 | 20.7 | 26.5 | 31.1 | −0.45 | 20.04 | 0.23 | 15.2 | 20.0 | 25.9 | 30.5 |
| 23–25 | 353 | −0.64 | 21.39 | 0.22 | 16.5 | 21.4 | 27.4 | 32.3 | −0.66 | 20.66 | 0.23 | 15.9 | 20.7 | 26.6 | 31.6 |
| 25–27 | 125 | −0.94 | 21.42 | 0.22 | 16.8 | 21.4 | 27.5 | 33.0 | −0.99 | 20.8 | 0.22 | 16.2 | 20.8 | 26.9 | 32.6 |
L: Box-Cox coefficient; M: median; S: coefficient of variation.
Given the need to develop new equations for analyzing excess adipose tissue in this population, the first aim of our study was to propose regression equations capable of estimating FM and to analyze their cross-validity. Dual-energy X-ray absorptiometry (DXA) was used as the reference method for this purpose.
The four proposed equations (2 for males and 2 for females) are based on simple anthropometric variables (weight, waist circumference and WHR), and show a high FM explanatory capacity (R2=70–73% in males and 0.70% in females). These variables are routinely included in most health surveys, and are widely employed in daily clinical practice. This reinforces their use in new body adiposity predictive models in university students and in other study samples.
In general, our results are consistent with those of other studies of similar characteristics, though with a different objective and reference method.17–19 The explanatory percentages obtained reflect moderate precision according to the literature.20 Furthermore, the VIF values (3.08 in males and 2.74 in females) are far below those established as limits (<10.0) according to Slinker and Glantz.21
On the other hand, the Bland–Altman plots showed a high level of agreement between the reference values (DXA) and the four developed equations. The 95% confidence limits are narrow and reflect very significant correlations (0.84–0.89), guaranteeing adequate precision on the part of all four equations.
With regard to cross-validation, no significant differences were seen between the validation sample and the sample for the development of the equations. The concordance values reflect a high level of agreement, and the strong correlations observed in the four equations (r=0.81–0.85) guarantee adequate validity levels. Thus, the four equations proposed could be applied to samples with characteristics similar to those of our study series. However, we admit that it might be necessary to use other anthropometric indicators and variables as predictors of FM, with the purpose of increasing the explanatory percentage and the levels of agreement between methods.
These equations may be applicable to young Chilean university students, for as far as we know, no regression equations have been developed to assess FM in individuals between 17–27 years of age in Chile or elsewhere in Latin America. The proposed equations can be used for scientific and academic purposes to establish comparisons with other studies and/or methods developed in different sociocultural contexts. Nevertheless, it must be remembered that comparisons between countries may not be appropriate, due to the different genotypic and phenotypic characteristics involved.22
It should be mentioned that in circumstances where no sophisticated equipment is available for diagnosing FM, it is advisable to make use of simple and widely available techniques, such as anthropometry.23 However, reference values are needed in order to ensure adequate interpretation of the values obtained on applying the equations. A second objective of our study was, therefore, to establish reference standards for assessing FM from the previously validated regression equations. In this regard, we used the LMS method to generate percentiles per age range and gender, based on international references.10,24,25 The reference data generated herein may be useful for diagnosing and classifying young individuals, for example into the following categories: low fat mass (
In general, although there is no perfect tool for estimating percentage fat or FM in epidemiological surveys, waist circumference and WHR have been shown to be useful in evaluating cardiovascular risk in different populations and age groups.28,29 Therefore, the equations and percentiles proposed in our study constitute an alternative for analyzing and monitoring variations in body adiposity at a given time point.
The main strengths of our study are the inclusion of a representative sample and the generation of equations with a strong predictive capacity. This makes it possible to use them in routine situations and in settings characterized by limited resources, where anthropometry is regarded as a priority technique for evaluating body composition and plays an important role in clinical practice and epidemiology.
With regard to the disadvantages of our study, it should be mentioned that the cross-sectional data used were limited to a single measurement. Physical activity and eating habits were not controlled, and the study population consisted of young Chilean university students encompassed within a narrow age range.
ConclusionThe present study has developed valid and precise regression equations for determining FM in young university students based on anthropometric indicators and variables. The values obtained from the equations can be analyzed based on percentiles, thus allowing for the categorization of body adiposity levels according to age range and gender. This study may fill the data gap found in Chile with regard to the assessment of overweight and obesity in university student populations. Nevertheless, further cross-sectional studies, particularly ones with a longitudinal design, are needed to confirm these findings.
Financial supportInternal project No. DIP048-17, Universidad Autónoma de Chile (Chile).
Conflicts of interestThe authors state that they have no conflicts of interest.
Please cite this article as: Gómez Campos R, Pacheco Carrillo J, Almonacid Fierro A, Urra Albornoz C, Cossío-Bolaños M. Validación de ecuaciones y propuesta de valores referenciales para estimar la masa grasa de jóvenes universitarios chilenos. Endocrinol Diabetes Nutr. 2018;65:156–163.
