


Reflex testing of antibodies and viral load in the same sample for diagnosing hepatitis C virus infection speeds up access to treatment. However, how hepatitis C is diagnosed in Spanish hospitals is unknown.
ObjectiveTo describe the available resources and procedures for the diagnosis of hepatitis C virus infection in Spain.
MethodsSurvey sent to public and private Spanish hospitals with teaching accreditation with at least 200 beds.
ResultsOf the 160 hospitals that met the inclusion criteria, 90 centres (response rate 56.3%) completed the survey. Two hospitals (2.2%) have no diagnostic resources, 15 (16.7%) can only test for anti-hepatitis C virus(Ab), 9 (10.0%) for Ab and viral load, 47 (52.2%) for Ab, viral load and genotype, 2 (2.2%) for Ab, viral load and core antigen, and 15 (16.7%) can perform Ab, core antigen, viral load and genotype tests. When an Ab test is positive, 28 (31.1%) hospitals perform reflex testing. When an active infection is diagnosed, some communication strategy is used in 62 (68.9%) hospitals. Approximately 44.2% of the respondents believe that all determinations needed to reach a definitive diagnosis should be done on a single blood sample.
ConclusionAlthough 81% of Spanish hospitals have the resources to perform reflex hepatitis C virus infection testing, it is only done in 31%, and less than a half of respondents believe that the definitive diagnosis should be performed on a single sample.
El diagnóstico de la infección por el virus de la hepatitis C en un solo paso (anticuerpos y carga viral en una misma muestra) disminuiría el tiempo de acceso al tratamiento. Se desconoce el proceso del diagnóstico de la hepatitis C en los hospitales españoles.
ObjetivoDescribir los recursos diagnósticos disponibles y el proceso del diagnóstico de la infección por virus de la hepatitis C en España.
MétodosEncuesta dirigida a hospitales españoles, públicos o privados con acreditación docente, de 200 camas o más.
ResultadosDe los 160 hospitales con criterios de inclusión, respondieron 90 (tasa de respuesta del 56,3%). Dos centros (2,2%) no disponen de ningún recurso diagnóstico, 15 (16,7%) solo pueden realizar determinación de anticuerpos (Ac), 9 (10%) de Ac y carga viral (CV), 47 (52,2%) de Ac, CV y genotipo, 2 (2,2%) de Ac, CV y antígeno core, y 15 (16,7%) de Ac, antígeno core, CV y genotipo. Ante un resultado de Ac positivo, 28 (31,1%) hospitales hacen diagnóstico virológico en la misma muestra. Cuando hay una infección activa, se utiliza alguna estrategia de comunicación en 62 (68,9%) hospitales. El 44,2% de los respondedores cree que las determinaciones para llegar a un diagnóstico definitivo se deben hacer con una muestra única de sangre.
ConclusionesAunque el 81% de los hospitales dispone de medios para realizar el diagnóstico de la infección por virus de la hepatitis C en un solo paso, únicamente lo hace el 31%. Menos de la mitad de los encuestados cree que el diagnóstico definitivo se debe hacer con una única muestra.
Hepatitis C is the most common chronic liver disease. Among people who are infected with the hepatitis C virus (HCV) 55–85% will become chronic, and 15–30% will develop cirrhosis and related complications.1,2 The estimated seroprevalence in the general population in Spain is 1.1%, and the prevalence of viraemia ranges from 0.3% to 0.5%.3,4
Currently, treatment with direct-acting antiviral agents allows most patients to be cured,5–7 so it has been postulated that the disease could be eliminated.8–13 However, for patients to be treated, they first need to be diagnosed. Unfortunately, there are patients who have not been diagnosed, and less than half of those with positive viraemia detected know that they have the disease.3,14 This implies that many patients do not receive treatment or do so with unnecessary delay. Single-visit diagnosis (SVD) involves performing all the necessary tests for a definitive diagnosis of hepatitis C from the same sample.15–17 The SVD strategy followed by effective communication of the results would allow all diagnosed patients to access treatment, and has proven to be cost-effective in routine clinical practice.18,19
As there is no national data for Spain on either the diagnostic resources available or the diagnostic process for hepatitis C, we conducted this study to find out what resources are available for the diagnosis of HCV infection in Spanish hospitals and to determine the extent to which SVD has been implemented and how the results are reported.
MethodsThis was an observational, cross-sectional study, with data obtained through a survey directed at hospitals from the Catálogo Nacional de Hospitales (CNH) [National Catalogue of Hospitals]20 with the following inclusion criteria: (1) general hospital (single-discipline hospitals, i.e. psychiatric, trauma, etc. were excluded); (2) at least 200 beds; and (3) public hospital or, if private, have teaching accreditation.
The person responsible for the diagnosis of hepatitis C in each selected hospital was invited to participate via email. The email explained the project and had the questionnaire attached in Excel format. The questionnaire included the variables of interest: service performing the diagnosis; steps in the diagnosis; process for communicating results; and number of analytical tests annually (15/09/2016–15/09/2017).
In the statistical analysis, the categorical variables are described as a proportion (%). The continuous variables with normal distribution are described with the mean and standard deviation (SD), and those that did not have normal distribution, with the median and interquartile range (IQR). The associations studied were between categorical variables, so we used Pearson's Chi-square test or Fisher's exact test. Hypothesis testing was two-tailed (α=0.05; β=0.2). The statistical analyses were performed with the SPSS statistical package, version 20®.
ResultsParticipating hospitalsThe inclusion criteria were met by 160 hospitals. The survey was carried out from 20 September to 20 October 2017 and 90 hospitals responded (response rate: 56.25%). The list of participating hospitals is shown in (additional material).
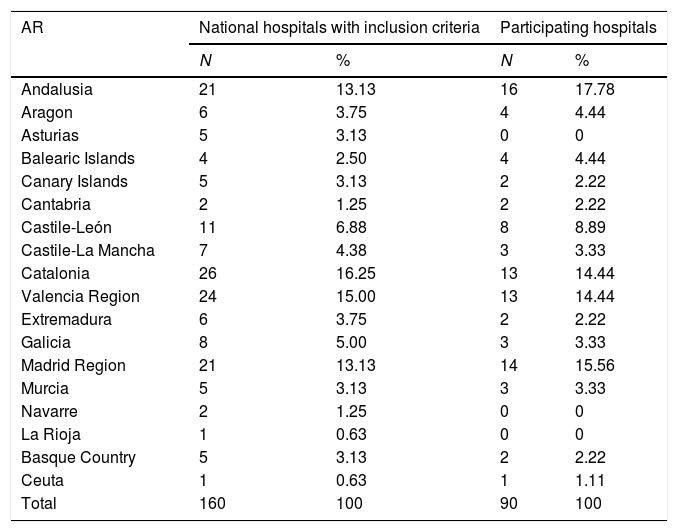
Table 1 shows the distribution of the participating hospitals by autonomous region. No hospitals responded from Albacete, Asturias, Guadalajara, Guipúzcoa, La Rioja, Lleida, Lugo, Navarre, Palencia, Salamanca, Segovia or Teruel.
Hospital distribution by Autonomous Region and number of beds.
| AR | National hospitals with inclusion criteria | Participating hospitals | ||
|---|---|---|---|---|
| N | % | N | % | |
| Andalusia | 21 | 13.13 | 16 | 17.78 |
| Aragon | 6 | 3.75 | 4 | 4.44 |
| Asturias | 5 | 3.13 | 0 | 0 |
| Balearic Islands | 4 | 2.50 | 4 | 4.44 |
| Canary Islands | 5 | 3.13 | 2 | 2.22 |
| Cantabria | 2 | 1.25 | 2 | 2.22 |
| Castile-León | 11 | 6.88 | 8 | 8.89 |
| Castile-La Mancha | 7 | 4.38 | 3 | 3.33 |
| Catalonia | 26 | 16.25 | 13 | 14.44 |
| Valencia Region | 24 | 15.00 | 13 | 14.44 |
| Extremadura | 6 | 3.75 | 2 | 2.22 |
| Galicia | 8 | 5.00 | 3 | 3.33 |
| Madrid Region | 21 | 13.13 | 14 | 15.56 |
| Murcia | 5 | 3.13 | 3 | 3.33 |
| Navarre | 2 | 1.25 | 0 | 0 |
| La Rioja | 1 | 0.63 | 0 | 0 |
| Basque Country | 5 | 3.13 | 2 | 2.22 |
| Ceuta | 1 | 0.63 | 1 | 1.11 |
| Total | 160 | 100 | 90 | 100 |
| Number of beds* | ||||
|---|---|---|---|---|
| 200–499 | 90 | 56.25 | 47 | 52.22 |
| 500–749 | 26 | 16.25 | 16 | 17.78 |
| >749 | 44 | 27.50 | 27 | 30 |
| Total | 160 | 100 | 90 | 100 |
AR: autonomous region; N: number of hospitals.
The median number of beds in the hospitals is 400 (IQR: 283–800); the smallest has 200 beds and the largest 1395. There are no differences between the participating hospitals and the hospitals with inclusion criteria in the distribution according to the number of beds (Table 1). Among the 90 participating hospitals, 86 (95.6%) have full public funding and 85 (94.4%) have medical residency training programmes.
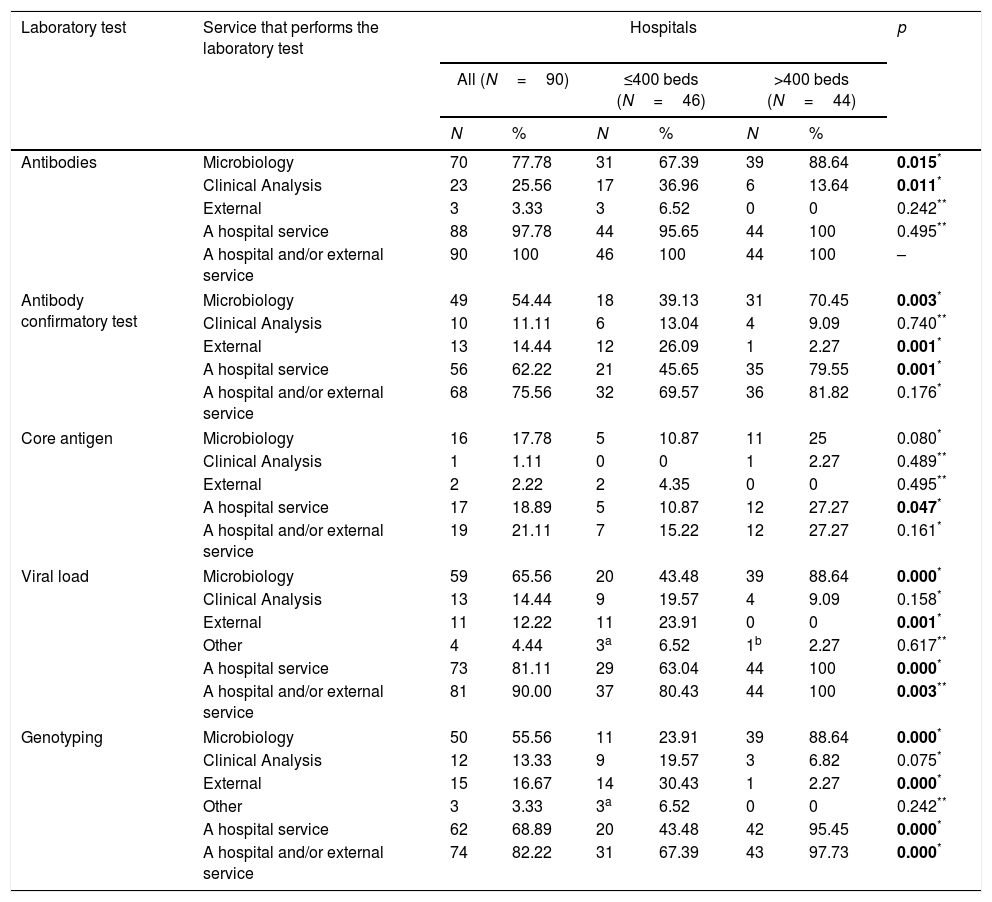
Antibody-detection test for diagnosing hepatitis CAt all 90 hospitals, antibody (Ab)-detection testing for HCV is performed by their own services and/or external services. At 70 (77.8%) hospitals the Microbiology service performs the test, at 23 (25.6%) it is the Clinical Analysis service, and three (3.3%) hospitals use services outside the hospital (Table 2). A comparison of these proportions according to hospital size is shown in Table 2.
Services performing laboratory tests in the diagnosis of HCV according to the size of the hospital (number of beds).
| Laboratory test | Service that performs the laboratory test | Hospitals | p | |||||
|---|---|---|---|---|---|---|---|---|
| All (N=90) | ≤400 beds (N=46) | >400 beds (N=44) | ||||||
| N | % | N | % | N | % | |||
| Antibodies | Microbiology | 70 | 77.78 | 31 | 67.39 | 39 | 88.64 | 0.015* |
| Clinical Analysis | 23 | 25.56 | 17 | 36.96 | 6 | 13.64 | 0.011* | |
| External | 3 | 3.33 | 3 | 6.52 | 0 | 0 | 0.242** | |
| A hospital service | 88 | 97.78 | 44 | 95.65 | 44 | 100 | 0.495** | |
| A hospital and/or external service | 90 | 100 | 46 | 100 | 44 | 100 | – | |
| Antibody confirmatory test | Microbiology | 49 | 54.44 | 18 | 39.13 | 31 | 70.45 | 0.003* |
| Clinical Analysis | 10 | 11.11 | 6 | 13.04 | 4 | 9.09 | 0.740** | |
| External | 13 | 14.44 | 12 | 26.09 | 1 | 2.27 | 0.001* | |
| A hospital service | 56 | 62.22 | 21 | 45.65 | 35 | 79.55 | 0.001* | |
| A hospital and/or external service | 68 | 75.56 | 32 | 69.57 | 36 | 81.82 | 0.176* | |
| Core antigen | Microbiology | 16 | 17.78 | 5 | 10.87 | 11 | 25 | 0.080* |
| Clinical Analysis | 1 | 1.11 | 0 | 0 | 1 | 2.27 | 0.489** | |
| External | 2 | 2.22 | 2 | 4.35 | 0 | 0 | 0.495** | |
| A hospital service | 17 | 18.89 | 5 | 10.87 | 12 | 27.27 | 0.047* | |
| A hospital and/or external service | 19 | 21.11 | 7 | 15.22 | 12 | 27.27 | 0.161* | |
| Viral load | Microbiology | 59 | 65.56 | 20 | 43.48 | 39 | 88.64 | 0.000* |
| Clinical Analysis | 13 | 14.44 | 9 | 19.57 | 4 | 9.09 | 0.158* | |
| External | 11 | 12.22 | 11 | 23.91 | 0 | 0 | 0.001* | |
| Other | 4 | 4.44 | 3a | 6.52 | 1b | 2.27 | 0.617** | |
| A hospital service | 73 | 81.11 | 29 | 63.04 | 44 | 100 | 0.000* | |
| A hospital and/or external service | 81 | 90.00 | 37 | 80.43 | 44 | 100 | 0.003** | |
| Genotyping | Microbiology | 50 | 55.56 | 11 | 23.91 | 39 | 88.64 | 0.000* |
| Clinical Analysis | 12 | 13.33 | 9 | 19.57 | 3 | 6.82 | 0.075* | |
| External | 15 | 16.67 | 14 | 30.43 | 1 | 2.27 | 0.000* | |
| Other | 3 | 3.33 | 3a | 6.52 | 0 | 0 | 0.242** | |
| A hospital service | 62 | 68.89 | 20 | 43.48 | 42 | 95.45 | 0.000* | |
| A hospital and/or external service | 74 | 82.22 | 31 | 67.39 | 43 | 97.73 | 0.000* | |
HCV: hepatitis C virus; N: number of hospitals.
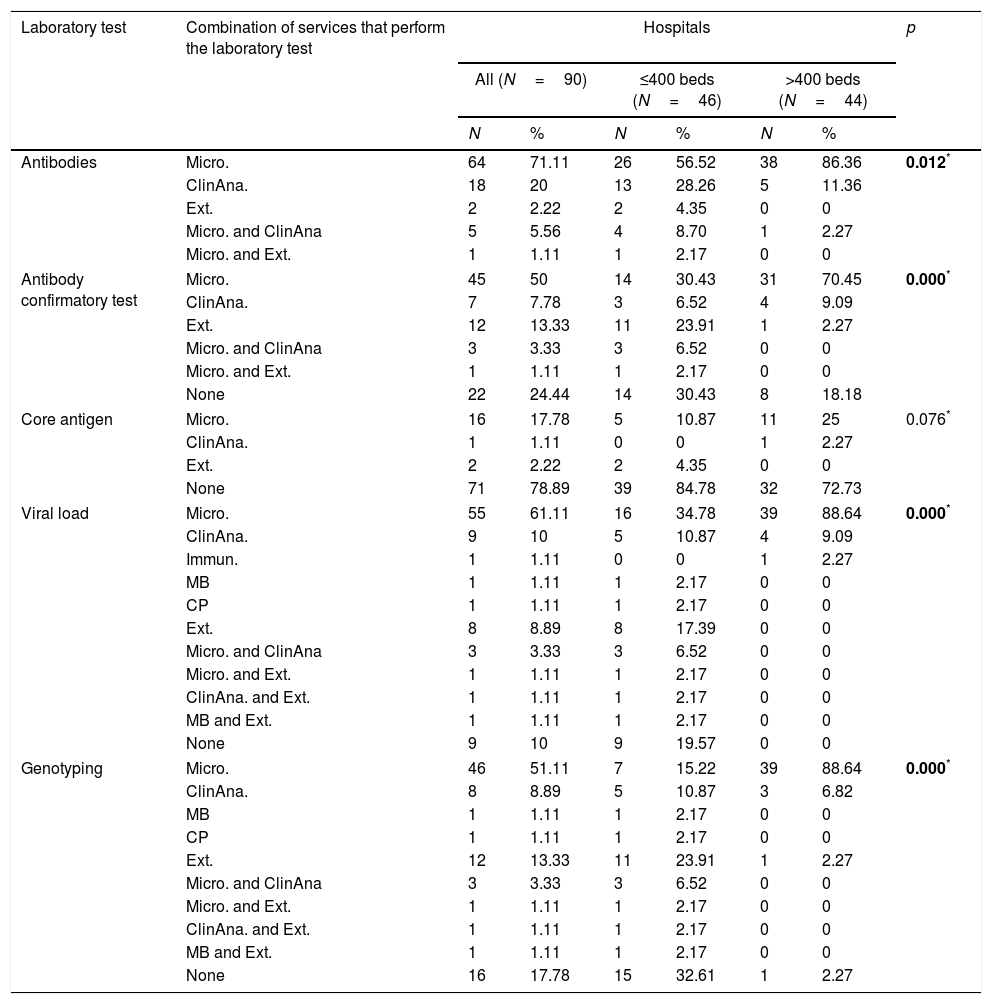
At 64 (71.1%) hospitals, it is the Microbiology service only that performs Ab testing, at 18 (20.0%) the Clinical Analysis service only, and 2 (2.2%) hospitals do not have Ab testing and request it from external services. At some hospitals, Ab testing is performed by more than one service. There was a statistically significant difference between large and small hospitals in the distribution of services that perform Ab testing (Table 3).
Combinations of services performing laboratory tests in the diagnosis of HCV according to the size of the hospital (number of beds).
| Laboratory test | Combination of services that perform the laboratory test | Hospitals | p | |||||
|---|---|---|---|---|---|---|---|---|
| All (N=90) | ≤400 beds (N=46) | >400 beds (N=44) | ||||||
| N | % | N | % | N | % | |||
| Antibodies | Micro. | 64 | 71.11 | 26 | 56.52 | 38 | 86.36 | 0.012* |
| ClinAna. | 18 | 20 | 13 | 28.26 | 5 | 11.36 | ||
| Ext. | 2 | 2.22 | 2 | 4.35 | 0 | 0 | ||
| Micro. and ClinAna | 5 | 5.56 | 4 | 8.70 | 1 | 2.27 | ||
| Micro. and Ext. | 1 | 1.11 | 1 | 2.17 | 0 | 0 | ||
| Antibody confirmatory test | Micro. | 45 | 50 | 14 | 30.43 | 31 | 70.45 | 0.000* |
| ClinAna. | 7 | 7.78 | 3 | 6.52 | 4 | 9.09 | ||
| Ext. | 12 | 13.33 | 11 | 23.91 | 1 | 2.27 | ||
| Micro. and ClinAna | 3 | 3.33 | 3 | 6.52 | 0 | 0 | ||
| Micro. and Ext. | 1 | 1.11 | 1 | 2.17 | 0 | 0 | ||
| None | 22 | 24.44 | 14 | 30.43 | 8 | 18.18 | ||
| Core antigen | Micro. | 16 | 17.78 | 5 | 10.87 | 11 | 25 | 0.076* |
| ClinAna. | 1 | 1.11 | 0 | 0 | 1 | 2.27 | ||
| Ext. | 2 | 2.22 | 2 | 4.35 | 0 | 0 | ||
| None | 71 | 78.89 | 39 | 84.78 | 32 | 72.73 | ||
| Viral load | Micro. | 55 | 61.11 | 16 | 34.78 | 39 | 88.64 | 0.000* |
| ClinAna. | 9 | 10 | 5 | 10.87 | 4 | 9.09 | ||
| Immun. | 1 | 1.11 | 0 | 0 | 1 | 2.27 | ||
| MB | 1 | 1.11 | 1 | 2.17 | 0 | 0 | ||
| CP | 1 | 1.11 | 1 | 2.17 | 0 | 0 | ||
| Ext. | 8 | 8.89 | 8 | 17.39 | 0 | 0 | ||
| Micro. and ClinAna | 3 | 3.33 | 3 | 6.52 | 0 | 0 | ||
| Micro. and Ext. | 1 | 1.11 | 1 | 2.17 | 0 | 0 | ||
| ClinAna. and Ext. | 1 | 1.11 | 1 | 2.17 | 0 | 0 | ||
| MB and Ext. | 1 | 1.11 | 1 | 2.17 | 0 | 0 | ||
| None | 9 | 10 | 9 | 19.57 | 0 | 0 | ||
| Genotyping | Micro. | 46 | 51.11 | 7 | 15.22 | 39 | 88.64 | 0.000* |
| ClinAna. | 8 | 8.89 | 5 | 10.87 | 3 | 6.82 | ||
| MB | 1 | 1.11 | 1 | 2.17 | 0 | 0 | ||
| CP | 1 | 1.11 | 1 | 2.17 | 0 | 0 | ||
| Ext. | 12 | 13.33 | 11 | 23.91 | 1 | 2.27 | ||
| Micro. and ClinAna | 3 | 3.33 | 3 | 6.52 | 0 | 0 | ||
| Micro. and Ext. | 1 | 1.11 | 1 | 2.17 | 0 | 0 | ||
| ClinAna. and Ext. | 1 | 1.11 | 1 | 2.17 | 0 | 0 | ||
| MB and Ext. | 1 | 1.11 | 1 | 2.17 | 0 | 0 | ||
| None | 16 | 17.78 | 15 | 32.61 | 1 | 2.27 | ||
ClinAna.: clinical analysis; CP: clinical pathology; Ext.: external; HCV: hepatitis C virus; Inmun.: Immunology; Micro: Microbiology; MB: Molecular Biology; N: number of hospitals.
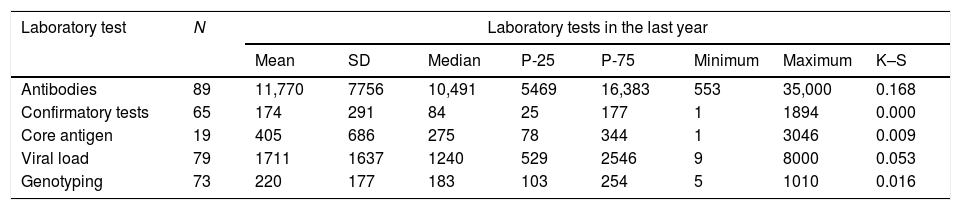
The hospitals performed an average of 11,770 (SD: 7756) Ab tests, with a minimum of 553 and a maximum of 35,000 per year (Table 4).
Number of analytical tests performed annually.
| Laboratory test | N | Laboratory tests in the last year | |||||||
|---|---|---|---|---|---|---|---|---|---|
| Mean | SD | Median | P-25 | P-75 | Minimum | Maximum | K–S | ||
| Antibodies | 89 | 11,770 | 7756 | 10,491 | 5469 | 16,383 | 553 | 35,000 | 0.168 |
| Confirmatory tests | 65 | 174 | 291 | 84 | 25 | 177 | 1 | 1894 | 0.000 |
| Core antigen | 19 | 405 | 686 | 275 | 78 | 344 | 1 | 3046 | 0.009 |
| Viral load | 79 | 1711 | 1637 | 1240 | 529 | 2546 | 9 | 8000 | 0.053 |
| Genotyping | 73 | 220 | 177 | 183 | 103 | 254 | 5 | 1010 | 0.016 |
K–S: Kolmogorov–Smirnov test; N: number of hospitals that gave test figures; P-25: 25th percentile; P-75: 75th percentile; SD: standard deviation.
At 68 (75.6%) hospitals the confirmatory Ab test is carried out by their own services and/or external services. The Microbiology service does the test at 49 (54.4%) hospitals, the Clinical Analysis service at 10 (11.1%), some hospital service at 56 (62.2%), and 13 (14.4%) hospitals order the test from external services (Table 2). A comparison of these proportions according to hospital size is shown in Table 2.
At 45 (50.0%) hospitals, it is the Microbiology service only that performs the confirmatory test, at seven (7.8%) the Clinical Analysis service only, and 12 (13.3%) hospitals only order the confirmatory test from external services. At three (3.3%) hospitals the confirmatory diagnosis is made by the Microbiology and Clinical Analysis services, and at one (1.1%) hospital, by Microbiology and external services. There was a statistically significant difference between large and small hospitals in the distribution of services that perform the confirmatory Ab test (Table 3).
The median number of confirmatory diagnostic tests annually was 84.0 (IQR: 25–177), with a minimum of 1 and a maximum of 1894 (Table 4).
Core antigen detection for the diagnosis of hepatitis CNineteen hospitals (21.1%) have core antigen (Ag) testing done by their own services and/or external services. At 16 (17.8%) hospitals the Microbiology service performs the test, at one (1.1%) it is the Clinical Analysis service, and two (2.2%) hospitals use services outside the hospital (Table 2). A comparison of these proportions according to hospital size is shown in Table 2.
Ag testing is not performed by more than one service at any of the hospitals. There are 73 (81.1%) hospitals with no Ag testing, but two (2.2%) of them order the test from external services (Table 3). There was no statistically significant difference between large and small hospitals in the distribution of services that perform Ag testing (Table 3).
The median number of Ag tests performed annually was 275 (IQR: 78–344), with a minimum of 1 and a maximum of 3046 (Table 4).
Measurement of viral load for the diagnosis of hepatitis CMeasurement of viral load (VL) is carried out by 81 (90.0%) hospitals by their own services and/or external services. At 59 (65.6%) hospitals the Microbiology service performs the test, at 13 (14.4%) it is the Clinical Analysis service, other services at four (4.4%), and 11 (12.2%) hospitals use services outside the hospital (Table 2). A comparison of these proportions according to hospital size is shown in Table 2.
At 55 (61.1%) hospitals, it is the Microbiology service only that performs VL measurement, at nine (10.0%) the Clinical Analysis service only, at three (1.1%) another service only, and eight (8.9%) hospitals only order the VL test from external services. At three (3.3%) hospitals VL can be determined by the Microbiology and Clinical Analysis services, at one (1.1%) hospital, by Microbiology and external services, at one (1.1%), by Clinical Analysis and external services, and at one (1.1%), by Molecular Biology and external services. There are 17 (18.9%) hospitals (all small) with no facility for VL measurement, but eight (8.9%) of them order the test from external services (Table 3). There was a statistically significant difference between large and small hospitals in the distribution of services that perform VL measurement (Table 3).
Primary care physicians can request the determination of VL at 35 (38.9%) hospitals: eight in Valencia Region, six in Catalonia, five in Andalusia, four in Castile-León, two in the Canary Islands, two in Cantabria, two in Extremadura, two in Galicia, two in Madrid Region, one in Castile-La Mancha and one in Ceuta.
The average number of VL determinations performed annually was 1711 (SD: 1637), with a minimum of 9 and a maximum of 8000 (Table 4).
Genotyping for the diagnosis of hepatitis CAt 74 (82.2%) hospitals the genotyping (GT) is carried out by their own services and/or external services. At 50 (55.5%) hospitals the Microbiology service performs the test, at 12 (13.3%) it is the Clinical Analysis service, other services at three (3.3%), and 15 (16.7%) hospitals use services outside the hospital (Table 2). A comparison of these proportions according to hospital size is shown in Table 2.
At 46 (61.1%) hospitals, it is the Microbiology service only that performs GT, at eight (8.9%) the Clinical Analysis service only, at two (2.2%) another service only, and 12 (31.1%) hospitals only order GT from external services. There are 28 (18.9%) hospitals with no facility for GT, 12 (13.3%) of which order the test from external services. At three (3.3%) hospitals GT is performed by the Microbiology and Clinical Analysis services, at one (1.1%) hospital by Microbiology and external services, at one (1.1%) by Clinical Analysis and external services, and at one (1.1%) by Molecular Biology and external services. There was a statistically significant difference between large and small hospitals in the distribution of services that perform GT (Table 3).
Primary care physicians can request GT at 24 (26.7%) hospitals: seven in Valencia Region, six in Catalonia, three in Andalusia, two in Castile-León, two in the Canary Islands, two in Extremadura, one in Cantabria and one in Galicia.
The median number of GT tests performed annually was 183 (IQR: 103–254), with a minimum of five and a maximum of 1010 (Table 4).
Single-visit diagnosisSVD is possible in 73 (81.1%) of the hospitals. However, in the case of a positive Ab result for HCV, only 28 (31.1%) hospitals provide SVD, meaning that only 38.4% of the hospitals with the capacity actually do so.
Of the 28 hospitals that provide SVD, four (14.3%) only do the Ag test, three (10.7%) Ag+VL; two (7.1%) Ag+VL+GT; one (3.6%) Ag+GT; five (17.9%) VL only; and 13 (46.4%) VL+GT.
There were no statistically significant differences between hospitals with >400 beds (34.1%) and hospitals with ≤400 beds (28.3%) in terms of how many provided SVD (p=0.55).
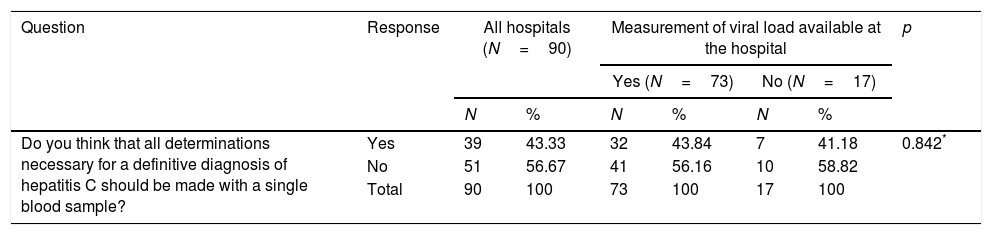
When asked if they thought SVD should be provided, 39 (43.3%) hospitals answered affirmatively, with no differences between hospitals able to measure VL at the hospital itself and those unable to do the test (Table 5). Nonetheless, 20 (71.4%) hospitals that provide SVD and 19 (30.6%) hospitals that do not responded affirmatively (p=0.000) (Table 5).
Association between the respondent's opinions and availability of diagnostic resources at the same hospital.
| Question | Response | All hospitals (N=90) | Measurement of viral load available at the hospital | p | ||||
|---|---|---|---|---|---|---|---|---|
| Yes (N=73) | No (N=17) | |||||||
| N | % | N | % | N | % | |||
| Do you think that all determinations necessary for a definitive diagnosis of hepatitis C should be made with a single blood sample? | Yes | 39 | 43.33 | 32 | 43.84 | 7 | 41.18 | 0.842* |
| No | 51 | 56.67 | 41 | 56.16 | 10 | 58.82 | ||
| Total | 90 | 100 | 73 | 100 | 17 | 100 | ||
| Question | Response | All hospitals (N=90) | The hospital makes virological diagnoses with one single sample | p | ||||
|---|---|---|---|---|---|---|---|---|
| Yes (N=28) | No (N=62) | |||||||
| N | % | N | % | N | % | |||
| Do you think that all determinations necessary for a definitive diagnosis of hepatitis C should be made with a single blood sample? | Yes | 39 | 43.33 | 20 | 71.43 | 19 | 30.65 | 0.000* |
| No | 51 | 56.67 | 8 | 28.57 | 43 | 69.35 | ||
| Total | 90 | 100 | 28 | 100 | 62 | 100 | ||
| Question | Response | All hospitals (N=90) | The hospital has a reporting strategy in place | p | ||||
|---|---|---|---|---|---|---|---|---|
| Yes (N=62) | No (N=28) | |||||||
| N | % | N | % | N | % | |||
| Do you think there should be some sort of alert to the diagnosis of an active HCV infection? | Yes | 80 | 88.89 | 61 | 98.39 | 19 | 67.86 | 0.018* |
| No | 10 | 11.11 | 1 | 1.61 | 9 | 32.14 | ||
| Total | 90 | 100 | 62 | 100 | 28 | 100 | ||
HCV: hepatitis C virus; N: number of hospitals.
Of the 62 hospitals that do not do SVD in the case of a positive Ab result, 56 provided information about what they actually do. At 22 (39.3%) hospitals a second sample is recommended. At 34 (60.7%) nothing is done, they simply wait for a second request. The delay from the time the positive Ab result is reported to the measurement of VL (53 hospitals responded) is a median of four weeks (IQR: 2–5), with a minimum of one week and a maximum of 20 weeks.
Strategies for communicating resultsWhen an active infection with HCV is detected, 62 (68.9%) hospitals use some type of communication strategy (25 use more than one), while 28 (31.1%) have no strategy. The communication strategies used are: direct contact with the requesting doctor at 39 (43.3%) hospitals; alert in the report at 32 (35.6%); contact with other doctors at 9 (10.0%); and a different strategy at 11 (12.2%). These other strategies were: “automatic alert in patient's records”; “when the first result comes back positive, a second sample is requested to confirm the result”; “email”; “for some time we have sent the list of confirmatory tests positive for HCV to gastroenterology”; “in the case of primary care physicians, weekly meeting with the requesting doctors to refer the patient to the specialists as quickly as possible”; “Public Health receives new positive results through alerts via the epidemiological surveillance network RedMiva”; “notification by mail or telephone”; “it is notified to the Microbiological Information System”; “the Hospital Preventive Medicine Service is informed”; and “the requesting doctor and the preventive medicine service are notified in order to report it”.
Small hospitals use direct contact with the requesting physician as a communication strategy more than the large hospitals (54.3% vs. 31.8%; p=0.031).
To the question, “Do you think there should be some sort of alert to the diagnosis of an active HCV infection?”, 80 (88.9%) hospitals responded affirmatively, but the rate was higher (98.4%) for hospitals with a communication strategy than for those without (67.9%) (p=0.018) (Table 5).
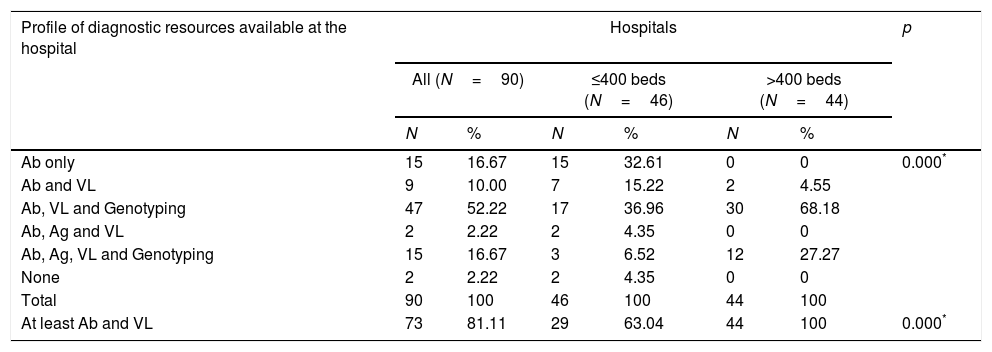
Diagnostic profiles according to the available resourcesSix diagnostic profiles were identified, according to the availability of the following diagnostic tests within the hospitals’ own services: (1) Ab only (15 hospitals [16.7%]); (2) Ab and VL (9 hospitals [10%]); (3) Ab, VL and GT (47 hospitals [52.2%]); (4) Ab, Ag and VL (2 hospitals [2.2%]); (5) Ab, Ag, VL and GT (5 hospitals [16.7%]); and (6) none (2 hospitals [2.2%]). There was a statistically significant difference between large and small hospitals in the distribution of these profiles (Table 6).
Relationship between the number of beds and profiles of diagnostic resources available at the hospital.
| Profile of diagnostic resources available at the hospital | Hospitals | p | |||||
|---|---|---|---|---|---|---|---|
| All (N=90) | ≤400 beds (N=46) | >400 beds (N=44) | |||||
| N | % | N | % | N | % | ||
| Ab only | 15 | 16.67 | 15 | 32.61 | 0 | 0 | 0.000* |
| Ab and VL | 9 | 10.00 | 7 | 15.22 | 2 | 4.55 | |
| Ab, VL and Genotyping | 47 | 52.22 | 17 | 36.96 | 30 | 68.18 | |
| Ab, Ag and VL | 2 | 2.22 | 2 | 4.35 | 0 | 0 | |
| Ab, Ag, VL and Genotyping | 15 | 16.67 | 3 | 6.52 | 12 | 27.27 | |
| None | 2 | 2.22 | 2 | 4.35 | 0 | 0 | |
| Total | 90 | 100 | 46 | 100 | 44 | 100 | |
| At least Ab and VL | 73 | 81.11 | 29 | 63.04 | 44 | 100 | 0.000* |
Ab: antibodies; Ag: core antigen; N: number of hospitals; VL: viral load.
In order for a hospital to provide SVD, it must be able to determine Ab and VL or Ab and Ag. Consequently, 73 (81.1%) hospitals have the ability to provide SVD (63% of small and 100% of large hospitals) (Table 6).
DiscussionThis study shows high variability in the diagnosis of hepatitis C, in terms of the service responsible for measuring VL (Microbiology in two thirds of hospitals and very different services in the rest), the use of the confirmatory test, the use of SVD, and how they communicate the results. One explanation for such variability may be the lack of clinical guidelines for the diagnostic process, but other reasons may be inadequate ongoing training, the disparity in healthcare professionals involved in the diagnosis, and the variability of resources from one hospital to another.
Some studies have shown a delay between the diagnosis of HCV infection and treatment,21–24 particularly in vulnerable populations.25,26 The lack of continuity of care between detection of Ab and confirmation of active infection with VL are barriers to diagnosis and treatment.27 Our study also shows unnecessary delays. For example, despite the fact that 81% of hospitals have the necessary diagnostic resources, only 31% of hospitals actually perform SVD and only 43% think they should. This would be a good basis for implementing SVD strategies, which could be developed with recommendations from the scientific societies involved. Implementation of SVD would improve efficiency18,19 and avoid duplication and underutilisation of resources; e.g. hospitals that outsource tests when they can be performed in-house. Not carrying out SVD means a delay in diagnosis, which can be as long as 20 weeks. Moreover, in 61% of hospitals that do not perform SVD, they take no action, but simply wait to receive a second request.
Another finding we made is that 75% of hospitals perform confirmatory tests. Nowadays, with serology having sensitivity and specificity close to 100%,2,28 confirmatory antibody tests are of little interest and take time and resources away from implementing SVD.
The strategy for communicating results is also highly variable. When an active infection with HCV is detected, almost a third of the hospitals do not use any communication strategy. The jumbled variety of strategies we found underlines the need for recommendations to establish effective communication strategies that contribute to reducing the time between confirmation of diagnosis and the start of treatment. Given that 89% of respondents believe that there should be some sort of alert to the diagnosis of an active HCV infection, we are sure that healthcare professionals would welcome the introduction of communication strategies.
One limitation of this study may be the apparently low response rate of 56%. However, our rate was similar to that of other studies of this type.29,30 Another possible limitation associated with the poor response is the fact that not all provinces of Spain are represented. Nonetheless, there are no differences between the population and the sample in terms of the characteristics of the hospitals, so we think it is safe to assume that there are no significant selection biases and that the sample of hospitals is sufficiently representative for the variables examined in this study. One of the strengths of the study, which minimises the likelihood of selection bias, is that the hospital population used for the survey is that of Spanish hospitals in the CNH, and not simply from registries or databases that do not cover the country as a whole.
This study corroborates previous findings from a similar study in Andalusia,31 and aims to examine what is known about the current situation regarding the diagnosis of hepatitis C with data from 2017. The Andalusian study showed that there is great variability in the strategies used for the diagnosis of HCV, that SVD is used far less than is technically possible and clinically desirable, and that the communication of diagnostic results needs to be improved. They also show, however, that the available diagnostic resources represent a very solid basis for the efficient implementation of SVD with the aim of improving the health of patients and eliminating the disease.
FundingThis study has been funded by the Fundación Española del Aparato Digestivo [Spanish Gastrointestinal System Foundation].
Conflicts of interestJavier Crespo: grants from and advisory boards and speakers’ bureaux for AbbVie, Gilead, MSD and Janssen.
Antonio Aguilera: grants from and speakers’ bureaux for Gilead.
Javier García-Samaniego: lectures and consultant for AbbVie, BMS, Gilead, Janssen and MSD; grants from BMS and Gilead.
José María Eiros: advisory work for the companies AbbVie and Gilead.
José Luis Calleja: consultant and speaker for Gilead, AbbVie and MSD.
Federico García: Grants from and advisory boards and speakers’ bureaux for Roche, Hologic, Werfen, ViiV, AbbVie, Janssen, MSD and Gilead.
Antonio Javier Blasco and Pablo Lázaro received funding from the Fundación Española del Aparato Digestivo for the development of methodology for the project and drafting of the manuscript.
We thank the hospitals and the researchers from each centre who responded to the survey (see appendix) for their participation and for providing the data which made it possible to carry out this study.
The following are the supplementary data to this article:
Please cite this article as: Crespo J, Lázaro de Mercado P, Blasco Bravo AJ, Aguilera Guirao A, García-Samaniego Rey J, Eiros Bouza JM, et al. El diagnóstico de la infección por el virus de la hepatitis C en España: una oportunidad para mejorar. Enferm Infecc Microbiol Clin. 2019;37:231–238.
