


To describe the factors related to the situation of SARS-CoV-2 transmission identified by health professionals in Spain and to propose prevention strategies.
MethodCross-sectional descriptive study. The population were healthcare professionals working in institutions caring for COVID-19 patients and also confirmed cases of SARS-CoV-2 infection. A questionnaire with sociodemographic, occupational and epidemiological variables was used. Descriptive and bivariate analysis was performed according to the nature of the variables.
ResultsTwenty-two hundred and thirty questionnaires were analysed on a potential population of 41,239 (5.47%). The diagnosis was made based on a suspicious case (63.4%) and a probable case (12.3%). A study of contacts was carried out at 50.3%. The perception about the availability of protective measures as "always/frequently" were: FPP1 mask 57.3%, gloves 89.5%, soap 95% and hydroalcoholic solution 91.5%. In PPE, FPP2, FPP3 mask, goggles and disposable gowns at around 50%. The availability of protective measures, by field of work, presented significant differences. The average number of patients attended related to the performance of hand hygiene at moment 4 and the perception of performing it correctly at moments 4 and 5.
ConclusionsPreliminary data are presented, with variability in the response rate by Autonomous Region. Healthcare professionals infected by SARS-CoV-2 identified the management of the chain of infection transmission, the use and adequacy of protective equipment, as well as the effectiveness of handwashing as factors related to the transmission of the virus among professionals.
Describir los factores relacionados con la situación de contagio del SARS-CoV-2 identificados por los profesionales de la salud en España y proponer estrategias de prevención.
MétodoEstudio descriptivo transversal. La población fueron profesionales de la salud trabajando en instituciones con atención a pacientes con COVID-19 y caso confirmado de infección por SARS-CoV-2. Se utilizó un cuestionario con variables sociodemográficas, laborales y epidemiológicas. Se realizó análisis descriptivo y bivariado según la naturaleza de las variables.
ResultadosSe analizan 2230 cuestionarios sobre una población potencial de 41,239 (5,47%). El motivo para realizar el diagnóstico fue: caso sospechoso (63,4%) y caso probable (12,3%). Se hizo estudio de contactos al 50,3%. La percepción sobre la disponibilidad de medidas de protección como “siempre/frecuentemente” fueron: mascarilla FPP1 57,3%, guantes 89,5%, jabón 95% y solución hidroalcohólica 91,5% y en EPIs, mascarillas FPP2, FPP3, gafas y batas desechables alrededor del 50%. La disponibilidad de medidas protectoras, por ámbito de trabajo, presentó diferencias significativas. La media de pacientes atendidos se relacionó con la realización de higiene de manos del momento 4 y en la percepción de realizarla correctamente en momentos 4 y 5.
ConclusionesSe presentan datos con carácter preliminar y con variabilidad en la tasa de respuesta por Comunidad Autónoma. Los profesionales de la salud contagiados por SARS-CoV-2 identifican la gestión de la cadena de contagios, el uso y adecuación en la disponibilidad de equipos de protección, así como la efectividad en la realización del lavado de manos, como factores relacionados con el contagio de los profesionales.
The SARS-CoV-2 pandemic has had a heavy social and healthcare impact worldwide. In Spain it has led to a high rate of contagion amongst healthcare professionals and there is a need to identify the possible factors of impact in order to develop appropriate prevention strategies to avoid contagion, minimize its repercussions and help to effectively control risk.
What does this paper contribute?Healthcare professionals infected by COVID-19 have identified as possible factors related to infection control of the contagion chain, the use and availability of protective equipment and effectiveness in hand-washing. This is the first study in Spain to be conducted during the pandemic on factors which could be implicated in the SARS-CoV-2 contagion amongst healthcare professionals. Data obtained suggest homogenizing occupational risk prevention procedures in healthcare centres relating to the study of contagion chains; the optimization of availability and training in the use of PPE; the improvement and introduction of updated protocols; the reinforcement of adherence to hand hygiene and the adaptation of workloads within the care context.
On December 31st 2019 China informed the World Health Organisation (WHO) of the appearance of 27 cases of pneumonia of origin unknown.1 The causal agent was identified as an RNA virus of the coronavirus family which was named SARS-CoV-2,2 and the disease it caused received the name COVID-19.3 The symptoms usually appear after incubation of 4−8days.4 The most common symptoms are mild respiratory and other symptoms, although they may turn into highly serious cases with pneumonia, multi-systemic failure and death.
On 11th March 2020 the WHO considered this situation as a pandemic,5 and to date, 30th April, the cases reported worldwide are 3,090,445, with 217,769 deaths; in Europe there are 1,434,649 confirmed cases and 135,961 deaths.6 Although real data on mortality are unknown and there are serious difficulties in obtaining an accurate estimation, the current figure is approximately 4.8% (Between 1.0 and 11.4%).4 In Spain, since the beginning of the SARS-CoV-2 alert 213,435 diagnosed cases and 4543 deaths have been recorded.5,7
The mechanism of transmission is from person to person through drops transmitted by speaking, coughing or sneezing from the infected8 individuals, and therefore transmission also comes about through contact with contaminated surface areas by drops deposited on them. Transmission through aerosols,9 has also been suggested but there is no evidence to prove of any vertical transmission.10
This mechanism of transmission turns the activity of healthcare professionals into “risk exposure”, since repeated close contact with cases of infection by SARS-CoV-2 occur. They are exposed to splashes of biological fluids and carry out procedures with aerosols (CPR, intubation, extubation, etc.). According to the Ministry of Health,11 classification of occupational health risk levels according to the tasks performed by health professionals establishes 7 groups of vulnerable professionals and 4 levels of risk (RL1-RL4). The professionals in the most vulnerable groups and in accordance with the task classification would be at RL3-RL4 (those at greatest risk).
According to the WHO, on 8th April there were 22,073 cases of COVID-19 in healthcare professionals in a total of 52 countries.12 In China, on 17th February, 3.8% of infected people corresponded to healthcare professionals.13 In Italy around 18,000 health care workers were infected.14 In Spain, at 30th April the number of infected healthcare professionals working in healthcare centres was 41,239,15 but the press published data which ranged from 31% of infected professionals reported by the Hospital of Alcorcón (Madrid), 24% by the Hospital Ramón y Cajal (Madrid) and 11% by the Hospital Clínic (Barcelona).16 This was particularly alarming since healthcare professionals accounted for 21.4% of total infected individuals5 and could act as contagion vectors to patients through their s essential activity in patient care, treatment and cure.
Contagion prevention protocols amongst healthcare centre workers and community healthcare workers included three main plans of action17: a)personal protective equipment (PPE), comprising mask, gloves, protective clothes and eye or facial protection18–20; b)hand-washing with liquid or solid soap and water (if hands were clean a hydroalcoholic solution could be used) for at least 40–60 seconds, in keeping with the 5 moments recommended by the WHO,21 and c)actions in the workplace: cleaning and disinfection of surfaces and consumables, daily replacement of uniform and showering before returning home.22
Due to the high contagion by SARS-COV-2 amongst the healthcare professionals in Spain, the SANICOVI® project was initiated, It aimed to describe the factors relating to the SARS-CoV-2 contagion situation identified by health care professionals in Spain and to propose prevention strategies.
MethodDesignCross-sectional descriptive study which reported on data collected between 4th and 30th April 2020.
Population and study scopeThe target population comprised healthcare professionals from all autonomous communities in Spain working in any centre that cared for COVID-19 patients and whose case of SARS-CoV-2 infection were confirmed by a laboratory.
For calculation of the sample a minimum margin of error of 2.7% was estimated which would correspond to the percentage of responses ≥5% of the total infected professionals.
VariablesSociodemographic: sex, age, professional/student profile and qualifications, place of residence, means of transport used to go to work, characteristics of residence, number and age of cohabitants and frequency and destination of outside home excursions.
Employment and epidemiological: Place and unit of work, length of employment in the last 10 years, protection elements (availability, use and perception of correct use), methods and frequency of hand-washing and other methods of hygiene on the job, workload in the last working day, existence of protection protocols, reason for doing the test and person responsible for referring them to it, date of symptom onset, positive test and negative test, contacts prior to the test, isolation and its characteristics, and return to work.
Data collectionA 21-question questionnaire was designed for this study, which included all the previously mentioned variables grouped into 8 blocks. The questionnaire was reviewed by experts and a pilot study was conducted to evaluate viability, comprehension and suitability.
Control mechanisms were put into place as quality criteria to avoid automatic responses and to ensure each individual responded only once. Questionnaire completion time was also measured and those completed in less than 6min were eliminated (minimum established response time in the pilot study). Consistency between the different data was reviewed (onset of symptoms, results from the diagnostic tests, positive and negative test), and finally five “control” questions were included to identify inconsistent responses.
The questionnaire was distributed through social networks, electronic mail and direct contact with management, scientific associations and research groups, schools and professional syndicates of nursing and medicine, and the centres which formed part of the “Centres of Excellence in Healthcare Project®.
The Gnoss® knowledge and artificial intelligence management platform was used. This is an ontological model (enabling data management and their representation in a mode interpretable by machines and systems) and is cross-examinable through a control panel.
Data collection in the first phase was developed in two periods: from 4th to 10th April (pilot) and from 11th to 30th April 2020, and a second phase will continue until the end of the pandemic. After the pilot period a question was added to the questionnaire regarding return to work with a negative test and differentiation was made between the PCR test and the antibody test used.
Data analysisDescriptive analysis was made of all study variables, arithmetic averages, standard deviations (SD), minimums and maximums, for the continuous variables, and absolute frequencies and proportions for the categorical variables. Confidence intervals were calculated at 95% (95% CI). Bivariate analysis was made with the Chi-square test for the qualitative variables and with the Student’s T-test and ANOVA test for quantitative variables. Three variables were recorded for this: place of work (hospital and primary care environments), professional category (internal nursing resident [INR], nurse, doctor, resident medical intern (RMI), nursing assistant technician [NAT] and others) and the availability of protective materials (always or frequently, at times or occasionally and never).
In all cases bilateral comparisons were used with a significance level for p<.05. Analysis was performed with SPSS v25 software.
Ethical considerationsThe questionnaire complied with the ethical principles of scientific research. As this was an online questionnaire, informed consent was an obligatory requisite prior to data completion, and this included information on the project, its objectives and specified the voluntary nature of participation. The project was coordinated by the research unit in healthcare and services, was assessed by the Instituto de Salud CarlosIII and requested permission from the Ethics Committee. Responses were disassociated from the electronic mail to guarantee anonymity and confidentiality. Personal data obtained were treated in compliance with EU Regulation UE/2016/679, of 27th April 2016, the General Data Protection and Organic Law 3/2018, of 5th December, governing Personal Data Protection and guarantee of digital rights through a contract signed by the ISCIII for data management and treatment.
ResultsTwo thousand two hundred and fifty five responses were obtained. Their distribution by autonomous community and the margin of error in response rate are contained in Table 1. After confirming the quality criteria, 2230 questionnaires were included in this preliminary analysis. 76.4% of participants were women; mean age was 42.53years (SD: 11.27) and it was essentially nurses (48.3%) and doctors (29.6%) who responded (Table 2).
Distribution of COVID-19 cases in healthcare professionals and participation by autonomous community.
| Communities | Cases | Questionnaires | % | 95% error margin |
|---|---|---|---|---|
| Andalusia | 3970 | 117 | 2.95 | 8.93 |
| Aragon | 803 | 70 | 8.72 | 11.2 |
| Asturias | 670 | 34 | 5.07 | 16.39 |
| Canarias | 574 | 28 | 4.88 | 18.08 |
| Cantabria | 392 | 12 | 3.06 | 27.89 |
| Castile-La Mancha | 4570 | 123 | 2.69 | 8.72 |
| Castile-Leon | 2540 | 185 | 7.28 | 6.94 |
| Catalonia | 8235 | 470 | 5.71 | 4.39 |
| Ceuta | 20 | 0 | .00 | ― |
| Valencia | 2183 | 62 | 2.84 | 12.27 |
| Extremadura | 445 | 36 | 8.09 | 15.68 |
| Galicia | 1450 | 38 | 2.62 | 15.96 |
| Balearic Islands | 332 | 36 | 10.84 | 15.45 |
| La Rioja | 341 | 56 | 16.42 | 11.99 |
| Madrid | 10,458 | 735 | 7.03 | 3.49 |
| Melilla | 37 | 2 | 541 | ― |
| Region of Murcia | 379 | 21 | 5.54 | 20.81 |
| Navarre | 806 | 58 | 7.20 | 12.4 |
| Basque country | 3034 | 172 | 567 | 7.26 |
| Total | 41,239 | 2.255 | 5.47 | 2.01 |
Socio-demographic, employment and epidemiological characteristics of the simple.
| n | % | 95% CI | |
|---|---|---|---|
| Woman | 1704 | 76.4 | 74.6−78.1 |
| Healthcare professional (2230) | |||
| Nurse | 1078 | 48.3 | 46.3−50.4 |
| Doctor | 660 | 29.6 | 27.7−31.5 |
| Physiotherapist | 10 | .4 | .2−.8 |
| RMI/INR | 170 | 7.6 | 6.6−8.8 |
| NAT | 199 | 8.9 | 7.8−10.2 |
| Other technicians | 32 | 1.4 | 1.0−2.0 |
| Final year students | 4 | .1 | ― |
| Others | 77 | 3.5 | 2.8−4.3 |
| Place of work (n=2153) | |||
| Hospital emergency or community emergency departments | 247 | 11.5 | 10.2−12.9 |
| ICU with respirator | 209 | 9.7 | 8.5−11.0 |
| ICU without respirator | 30 | 1.4 | .1−2.0 |
| Surgical hospitalisation | 156 | 7.2 | 6.2−8.4 |
| Medical hospitalisation | 744 | 34.6 | 32.6−36.6 |
| Primary care centres | 493 | 22.9 | 21.2−24.7 |
| Home care | 55 | 2.6 | 2.0−3.4 |
| Residential care home staff | 86 | 4.0 | 3.2−4.9 |
| Non healthcare centres converted into health centres | 5 | .2 | ― |
| Rotating staff | 128 | 5.9 | 5.0−7.0 |
| Hospitals | 74 | 57.8 | 49.1−66.0 |
| Emergency department service | 24 | 18.8 | 12.9−26.3 |
| Community care centres | 22 | 17.2 | 11.6−24.6 |
| Care facilities for dependents | 2 | 1.6 | ― |
| Intensive care units | 6 | 4.7 | ― |
| Reason for taking the test (n=2.230) | |||
| Suspected case | 1.414 | 63.4 | 61.4−65.4 |
| Probable case | 275 | 12.3 | 11.0−13.8 |
| Asymptomatic case with contact | 191 | 8.6 | 7.5−9.8 |
| Other reasons | 278 | 12.5 | 11.2−13.9 |
| Own request | 72 | 3.2 | 2.57−4.0 |
| Min.-Max | Mean (SD). | |
|---|---|---|
| Age (years) | 20−72 | 42.53 (11.27) |
| Time worked in the last 10 years (months) | > 1−131 | 99.28 (38.61) |
| Number of patients in last working daya | 0−99 | 18.75 (17.90) |
SD: Standard deviation; INR: Internal Nursing Resident; Max.: Maximum; Min: Minimum; RMI: Resident Medical Intern; NAT: Nursing Assistant Technician.
The reason for taking a test was suspected case in 63.4% and probable case in 12.3%, based on symptoms (Table 2). The employment services indicated the test in 58.6% (n=828) of suspected cases and in 56.4% (n=155) of probable cases; and benchmark healthcare services in 27.2% (n=384) of suspected cases and 24% (n=66) of probable cases. Mean days between symptoms and positive testing was 4.67 (SD: 4.36; n=1486; minimum: 1; maximum: 40). In one group of professionals the diagnostic test used was analysed, with 12.1% (n=270) being PCR and 1.2% (n=27) being antibody tests.
Contact of the professional with cases was through work for 80.1% and they confirmed that a study of their contacts was made in 50.3%. The percentage of healthcare professionals who self-isolated at home was 97.1%, or who complied with the recommended measures (67.2%) and with telephone follow-up (78.5%). 6.1% and .4% of the sample required hospital admission or intensive care unit admission, respectively (Table 3).
Contact and isolation data.
| N | % | 95% CI | |
|---|---|---|---|
| A. Contact relationship (n=191) | |||
| Work | 153 | 80.1 | 73.9−85.1 |
| Cohabitant | 33 | 17.3 | 12.6−23.7 |
| Casual contact | 5 | 2.6 | 1.1−6.0 |
| Duration (n=191) | ― | ||
| Continuous | 40 | 20.9 | 15.8−27.3 |
| Regular | 88 | 46.1 | 39.1−53.1 |
| Sporadic | 63 | 33.0 | 26.7−39.9 |
| Contact study (2230) | ― | ||
| Was undertakena | 1121 | 50.3 | 48.2−52.3 |
| Contact in work/social environment | 827 | 55.9 | 53.3−58.4 |
| Close contacts in work/social environment | 462 | 31.2 | 28.9−33.6 |
| Cohabitants | 191 | 12.9 | 11.3−14.7 |
| I do not know if it was undertaken | 253 | 11.3 | 10.1−12.7 |
| I think it was not undertakenb | 856 | 38.4 | 36.4−40.4 |
| B. Isolation (n=2.127 | |||
| At home 100% compliance | 1429 | 67.2 | 65.2−69.1 |
| At home. not wholly complied with | 637 | 29.9 | 28.0−31.9 |
| Home of a family member or friend | 11 | .5 | .3−.9 |
| In a hotel provided by the organisation | 50 | 2.4 | 1.8−3.2 |
| Characteristics of residence (n=2215) | ― | ||
| Under 50 m2 | 187 | 8.4 | 7.4−9.7 |
| Between 50 and 100 m2 | 1113 | 50.2 | 48.2−52.3 |
| More than 100 m2 | 435 | 19.6 | 18.0−21.3 |
| Single-family home | 324 | 14.6 | 13.2−16.2 |
| Detached house | 142 | 6.4 | 5.5−7.5 |
| Other | 14 | .6 | ― |
| Follow-up in isolation (2230) | |||
| Isolation and telephone follow-up | 1750 | 78.5 | 76.7−80.1 |
| Isolation and face-to-face consultation | 275 | 12.3 | 11.3−13.8 |
| Hospital admission | 137 | 6.1 | 5.2−7.2 |
| Intensive care unit admission | 8 | .4 | ― |
| Other | 60 | 2.7 | 2.1−3.6 |
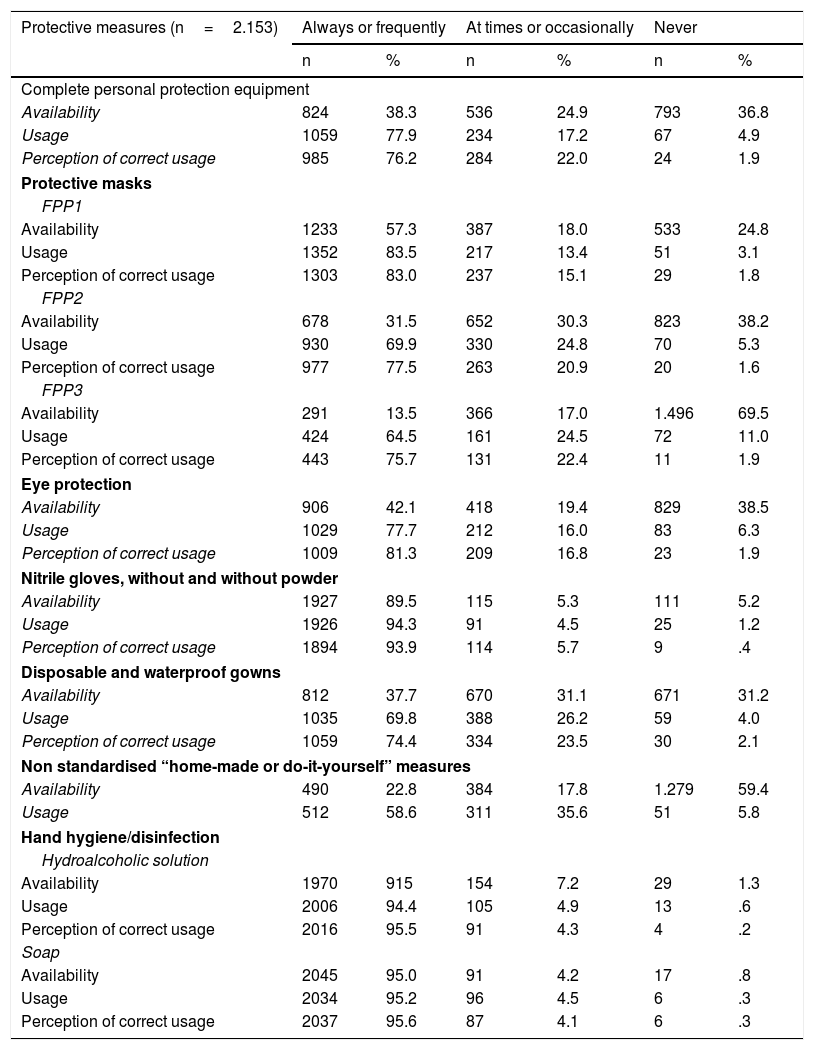
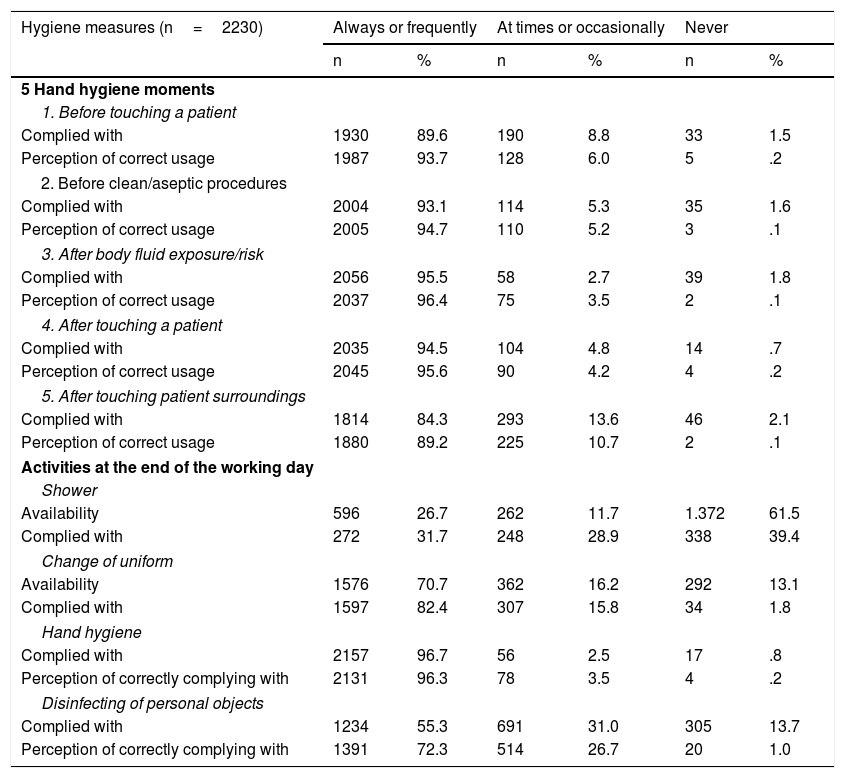
Regarding the perception of the professionals, during the first few weeks of the pandemic the availability of protective measures in the “always/frequently” category was: for FPP1 mask 57.3%; gloves 89.5%; soap 95%, and hydroalcoholic solution 91.5%. Complete PPE of FPP2, FPP3 masks, protection goggles and disposable gowns the declared percentage was under 50%. Their perception of usage when it was necessary and following the indications of the institution, except for home-made measures, varied between 69.8% and 95.2%, and their perception of correct usage between 76.2% and 95.6% (Table 4). Whilst performing the “5 moments” in hand hygiene/disinfection proposed by the WHO, the declaration of having been in the category of “always/frequently” varied between 84.3% for moment 5 and 95.5% for moment 3. The perception of correct procedure was 89.2% for moment 5 and 96.4% for moment 3. Regarding other hygiene measures on termination of the working day, the most complied with moment was hand hygiene (96.7%) and the least was showering (31.7%) (Table 5).
perception of the protective measures in the 5 days prior to taking the test.
| Protective measures (n=2.153) | Always or frequently | At times or occasionally | Never | |||
|---|---|---|---|---|---|---|
| n | % | n | % | n | % | |
| Complete personal protection equipment | ||||||
| Availability | 824 | 38.3 | 536 | 24.9 | 793 | 36.8 |
| Usage | 1059 | 77.9 | 234 | 17.2 | 67 | 4.9 |
| Perception of correct usage | 985 | 76.2 | 284 | 22.0 | 24 | 1.9 |
| Protective masks | ||||||
| FPP1 | ||||||
| Availability | 1233 | 57.3 | 387 | 18.0 | 533 | 24.8 |
| Usage | 1352 | 83.5 | 217 | 13.4 | 51 | 3.1 |
| Perception of correct usage | 1303 | 83.0 | 237 | 15.1 | 29 | 1.8 |
| FPP2 | ||||||
| Availability | 678 | 31.5 | 652 | 30.3 | 823 | 38.2 |
| Usage | 930 | 69.9 | 330 | 24.8 | 70 | 5.3 |
| Perception of correct usage | 977 | 77.5 | 263 | 20.9 | 20 | 1.6 |
| FPP3 | ||||||
| Availability | 291 | 13.5 | 366 | 17.0 | 1.496 | 69.5 |
| Usage | 424 | 64.5 | 161 | 24.5 | 72 | 11.0 |
| Perception of correct usage | 443 | 75.7 | 131 | 22.4 | 11 | 1.9 |
| Eye protection | ||||||
| Availability | 906 | 42.1 | 418 | 19.4 | 829 | 38.5 |
| Usage | 1029 | 77.7 | 212 | 16.0 | 83 | 6.3 |
| Perception of correct usage | 1009 | 81.3 | 209 | 16.8 | 23 | 1.9 |
| Nitrile gloves, without and without powder | ||||||
| Availability | 1927 | 89.5 | 115 | 5.3 | 111 | 5.2 |
| Usage | 1926 | 94.3 | 91 | 4.5 | 25 | 1.2 |
| Perception of correct usage | 1894 | 93.9 | 114 | 5.7 | 9 | .4 |
| Disposable and waterproof gowns | ||||||
| Availability | 812 | 37.7 | 670 | 31.1 | 671 | 31.2 |
| Usage | 1035 | 69.8 | 388 | 26.2 | 59 | 4.0 |
| Perception of correct usage | 1059 | 74.4 | 334 | 23.5 | 30 | 2.1 |
| Non standardised “home-made or do-it-yourself” measures | ||||||
| Availability | 490 | 22.8 | 384 | 17.8 | 1.279 | 59.4 |
| Usage | 512 | 58.6 | 311 | 35.6 | 51 | 5.8 |
| Hand hygiene/disinfection | ||||||
| Hydroalcoholic solution | ||||||
| Availability | 1970 | 915 | 154 | 7.2 | 29 | 1.3 |
| Usage | 2006 | 94.4 | 105 | 4.9 | 13 | .6 |
| Perception of correct usage | 2016 | 95.5 | 91 | 4.3 | 4 | .2 |
| Soap | ||||||
| Availability | 2045 | 95.0 | 91 | 4.2 | 17 | .8 |
| Usage | 2034 | 95.2 | 96 | 4.5 | 6 | .3 |
| Perception of correct usage | 2037 | 95.6 | 87 | 4.1 | 6 | .3 |
Hand hygiene according to the (WHO) 5 moments for hand hygiene at the end of the working day.
| Hygiene measures (n=2230) | Always or frequently | At times or occasionally | Never | |||
|---|---|---|---|---|---|---|
| n | % | n | % | n | % | |
| 5 Hand hygiene moments | ||||||
| 1. Before touching a patient | ||||||
| Complied with | 1930 | 89.6 | 190 | 8.8 | 33 | 1.5 |
| Perception of correct usage | 1987 | 93.7 | 128 | 6.0 | 5 | .2 |
| 2. Before clean/aseptic procedures | ||||||
| Complied with | 2004 | 93.1 | 114 | 5.3 | 35 | 1.6 |
| Perception of correct usage | 2005 | 94.7 | 110 | 5.2 | 3 | .1 |
| 3. After body fluid exposure/risk | ||||||
| Complied with | 2056 | 95.5 | 58 | 2.7 | 39 | 1.8 |
| Perception of correct usage | 2037 | 96.4 | 75 | 3.5 | 2 | .1 |
| 4. After touching a patient | ||||||
| Complied with | 2035 | 94.5 | 104 | 4.8 | 14 | .7 |
| Perception of correct usage | 2045 | 95.6 | 90 | 4.2 | 4 | .2 |
| 5. After touching patient surroundings | ||||||
| Complied with | 1814 | 84.3 | 293 | 13.6 | 46 | 2.1 |
| Perception of correct usage | 1880 | 89.2 | 225 | 10.7 | 2 | .1 |
| Activities at the end of the working day | ||||||
| Shower | ||||||
| Availability | 596 | 26.7 | 262 | 11.7 | 1.372 | 61.5 |
| Complied with | 272 | 31.7 | 248 | 28.9 | 338 | 39.4 |
| Change of uniform | ||||||
| Availability | 1576 | 70.7 | 362 | 16.2 | 292 | 13.1 |
| Complied with | 1597 | 82.4 | 307 | 15.8 | 34 | 1.8 |
| Hand hygiene | ||||||
| Complied with | 2157 | 96.7 | 56 | 2.5 | 17 | .8 |
| Perception of correctly complying with | 2131 | 96.3 | 78 | 3.5 | 4 | .2 |
| Disinfecting of personal objects | ||||||
| Complied with | 1234 | 55.3 | 691 | 31.0 | 305 | 13.7 |
| Perception of correctly complying with | 1391 | 72.3 | 514 | 26.7 | 20 | 1.0 |
The differences between hospital and primary care environments were analysed. Regarding the workload during the last working day, the mean patients cared for were 15.46 (SD: 15.51) vs 26.15 (SD: 20.53), respectively (p<.0001). The perception of availability at the beginning of the pandemic, in measures of protection for the environment also presented statistically significant differences for all of them (p<.0001). The percentages of perception of non availability were, respectively: PPE 34.3% (n=511) vs 42.5% (n=282); FPP2 masks 34.2% (n=509) vs 47.4% (n=314); FPP3 masks 63.4% (n=945) vs 83.1% (n=551); eye protection 34.8% (n=518) vs 46.9% (n=311); gowns 26.2% (n=391) vs 42.2% (n=280). Regarding the performing of the 5 moments of hand hygiene, in the category of “always /frequently” the differences were: moment1” before touching a patient” 90.1% (n=1342) vs 88.7% (n=588); moment2 “before clean/aseptic procedures 94.2% (n=1403) vs 90.6% (n=601); moment3 “after body fluid exposure/risk” 95.8% (n=1428) vs 94.7% (n=628); moment4 “After touching a patient” 94.8% (n=1412) vs 94% (n=623); moment5 “After touching patient surroundings” 85.8% (n=1278) vs 80.8% (n=536). These differences were statistically significant in moments 1 (p=.012), 2 (p=.007) and 5 (p=.004).
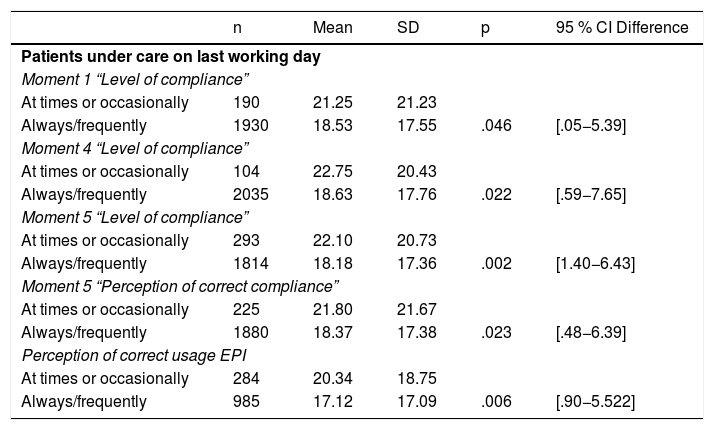
Workload was related to the degree of hand hygiene of moment1 (p=.046) and moment4 (p=.002), and with the perception of correctly performing them at moments 4 and 5 (p=.002 and p=.023), as well as the perception of correct usage of the PPE (p=.006). The mean of patients was higher when they declared “at times or occasionally” (Table 6).
Relationship between perception of protective measures/hygiene and workload.
| n | Mean | SD | p | 95 % CI Difference | |
|---|---|---|---|---|---|
| Patients under care on last working day | |||||
| Moment 1 “Level of compliance” | |||||
| At times or occasionally | 190 | 21.25 | 21.23 | ||
| Always/frequently | 1930 | 18.53 | 17.55 | .046 | [.05−5.39] |
| Moment 4 “Level of compliance” | |||||
| At times or occasionally | 104 | 22.75 | 20.43 | ||
| Always/frequently | 2035 | 18.63 | 17.76 | .022 | [.59−7.65] |
| Moment 5 “Level of compliance” | |||||
| At times or occasionally | 293 | 22.10 | 20.73 | ||
| Always/frequently | 1814 | 18.18 | 17.36 | .002 | [1.40−6.43] |
| Moment 5 “Perception of correct compliance” | |||||
| At times or occasionally | 225 | 21.80 | 21.67 | ||
| Always/frequently | 1880 | 18.37 | 17.38 | .023 | [.48−6.39] |
| Perception of correct usage EPI | |||||
| At times or occasionally | 284 | 20.34 | 18.75 | ||
| Always/frequently | 985 | 17.12 | 17.09 | .006 | [.90−5.522] |
95% CI: Confidence Interval at 95% for difference between means; Moment 1: Before touching a patient; Moment 4: Hand hygiene/disinfection after touching a patient; Moment 5: Hand hygiene/disinfection after touching patient surroundings SD: Standard Deviation; PPE: Personal Protection Equipment.
80.4% (n=1730) of participants stated that procedures of action had been established on COVID-19. Those who referred to a single procedure were 81.3% (n=1406), two procedures 13% (n=225), three 3.2% (n=56), and those with four procedures were 2.5% (n=43). For those with only one procedure exclusively, the procedure came from the institution itself in 63.8% (n=898) of cases, 35% (n=493) from health authorities, .7% (n=10) from the WHO and other institutional organizations and .3% (n=5) from scientific associations.
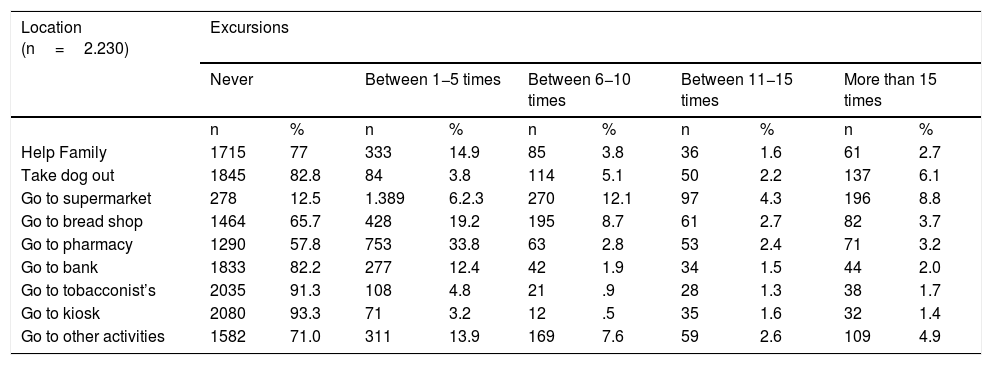
Regarding excursions outside the home on the 10 days prior to the diagnostic test, the most frequent were “to the supermarket” (8.8%) and “taking the dog out” (6.1%) (Table 7). The method of transport used during the 5 days prior to the test in 65.4% (n=1458) of cases was private car, in 13.7% (n=306) on foot, in 12.2% (n=272) public transport, in 3.5% (n=79) shared car, in 3.3% (n=73) motorbike, in 1.5% (n=33) bicycle/skateboard and in .4% (n=9) taxi.
Remaining in the home the last 10 days.
| Location (n=2.230) | Excursions | |||||||||
|---|---|---|---|---|---|---|---|---|---|---|
| Never | Between 1−5 times | Between 6−10 times | Between 11−15 times | More than 15 times | ||||||
| n | % | n | % | n | % | n | % | n | % | |
| Help Family | 1715 | 77 | 333 | 14.9 | 85 | 3.8 | 36 | 1.6 | 61 | 2.7 |
| Take dog out | 1845 | 82.8 | 84 | 3.8 | 114 | 5.1 | 50 | 2.2 | 137 | 6.1 |
| Go to supermarket | 278 | 12.5 | 1.389 | 6.2.3 | 270 | 12.1 | 97 | 4.3 | 196 | 8.8 |
| Go to bread shop | 1464 | 65.7 | 428 | 19.2 | 195 | 8.7 | 61 | 2.7 | 82 | 3.7 |
| Go to pharmacy | 1290 | 57.8 | 753 | 33.8 | 63 | 2.8 | 53 | 2.4 | 71 | 3.2 |
| Go to bank | 1833 | 82.2 | 277 | 12.4 | 42 | 1.9 | 34 | 1.5 | 44 | 2.0 |
| Go to tobacconist’s | 2035 | 91.3 | 108 | 4.8 | 21 | .9 | 28 | 1.3 | 38 | 1.7 |
| Go to kiosk | 2080 | 93.3 | 71 | 3.2 | 12 | .5 | 35 | 1.6 | 32 | 1.4 |
| Go to other activities | 1582 | 71.0 | 311 | 13.9 | 169 | 7.6 | 59 | 2.6 | 109 | 4.9 |
Return to healthcare work was in place for 34.2% (762) professionals. Of these 81.25% (n=619) was after 1negative test, 6.45% (n=49) after 2 negative tests and 12.30% (n=94) with no negative test. For incorporated professionals the mean days between the positive and first negative test was 16.89 (SD: 5.05; n=515, minimum: 11, maximum: 42). 91.1% (1759) of the professionals lived with 1–3 people and the people they lived with were under 60 years of age in 93% of cases.
DiscussionOn 30th April data positioned Spain as one of the countries with the highest rates of contagion amongst healthcare professionals at 21.4%,5 with an unequal representation through the different autonomous communities.
In the majority of cases (75.7%) diagnostic tests were performed due to the presence of symptoms: however, an important number of cases did not present with symptoms but took a test due to some type of risk contact or other motives, including individual request. This reflects a prioritization in testing for cases with a clearly indicative clinical picture, but highlights some difference in criteria in covering screening in the remainder of cases, possibly conditioned by the available of laboratory tests, depending on the institution.
Furthermore, considering that the start of infection transmission begins one or two days prior to the onset of symptoms and that, according to the data obtained, the mean between the onset of symptoms and the positive test was 4.67days, there is a critical window period of up to one week where the professional could have been a transmission vector to patients, family members and other professionals. Even if the professionals had followed the recommendations and interrupted their activity when symptoms began, there would still be 1−2days of high contagion risk during the subclinical or asymptomatic period.23 Contagion from asymptomatic individuals (2.5% according to the ENE-COVID study) is one of the main complexities for early diagnosis which in healthcare professionals may be critical in their ability to effectively control the rate of contagion in healthcare centres.
The study of contacts is one of the key points in the different strategies for contention of contagions.11 In this sense, only half of the participants stated that a study was made of their contacts, with 55.9% being focused on the work environment. Also, 12.3% of the professionals who returned to work stated they had done so without a test. This lack of follow-up of contacts could have contributed to the delay in diagnosing new cases,24 which, together with the impact of environmental factors, such as the dimension of commonly used spaces at work, could have potentially increased the risk of contagion. In fact, in Spain, according to data reported on 30th April 2020, 69% of workers were infected due to close contact with probable or confirmed cases.25
Regarding protection equipment, the professionals declared their perception of high availability in the first few weeks of the pandemic of the most basic equipment (FPP1 masks and gloves), together with elementary hand hygiene resources (soap and water and hydroalcoholic solution). However, the lack of certain protective equipment was declared, especially relating to FPP2/FPP3 masks, eye protection and complete PPE, which may suggest that at the beginning of the pandemic there could have been professionals who lacked adequate protection. It would be interesting to conduct a follow-up of the evolution of availability throughout the study, since this lack of protective equipment has to be analysed in the context of a never before known worldwide pandemic, where demand multiplied exponentially and production capacity was limited in an industrial delocalization environment.26
The WHO guideline was to recommend a minimum availability of a protective mask, facial and eye protection and 25 gowns per patient per day27 for care of patients in isolation in a hospital environment. This was far beyond the supplies of the Spanish national health system at the start of the pandemic. The percentage of professionals who did not perceive of accurate usage of most protective equipment is striking, leaving open a line of research which requires future in-depth probing.
Regarding hand hygiene, a high percentage stated that they always complied with this at all of the established times, but 15% did not always do so in moment5 “after touching patient surroundings”. Given the high availability of basic hand hygiene material and means, possibility of contagion by work-associated formites is suggested. This workload, measured by the number of people cared for in the last working day, was high, and with greater turnover in primary care than in the hospital. It was linked to the use and perception of adequate use of some protective measures.
The variation of procedures in a few weeks, as new knowledge was acquired, may have led to some confusion in professionals, even regarding basic elements such as the classification of masks, and delay in communication of more updated measures.
Training, particularly face-to-face,28 is another basic pillar for correct PPE usage.29 The broad professional experience of the sample of infected professionals should imply continuous professional training with regard to PPE usage,30 although no data exist.
The frequency of excursions declared during the confinement phase is also important to determine the permanence of SARS-CoV-2 on surfaces and contagion by formites, with generalized use of masks not having been recommended at that time. The great majority of the professionals stated a low number of cohabitants, and since their ages in over 90% of cases was under 60 years of age, it appears that the professionals decided to distance themselves from people with high risks.
Regarding study limitations, this was a cross-sectional study exclusively of infected individuals; Causal relationships may therefore not be established. Furthermore, regarding the validity of the questionnaire, despite a group of experts designing and piloting of it, this process was carried out by non systematic consensus. As indications and protocols changed due to the situation of the pandemic, they had to add two items to the questionnaire after the pilot phase. There was also a possible confusion in respondents’ interpretation between the FPP1 masks and surgical masks. In general, the protective masks supplied by health services were FPP2 and FPP3.
Another limitation to consider is the margin of error in the questionnaire response rate, the result of which could be non representative in some communities. These data should therefore be interpreted with caution, bearing in mind that these are preliminary results. Added to this is the fact that this survey was widely distributed through social networks, and could imply a certain bias of social desirability, set characteristics, or recall.
To conclude and bearing in mind the preliminary nature of the data and the need to broaden the sample to reduce the error margin in response rate, the data obtained in the first few weeks suggest that management of the chain of infection, the use and suitability of protective equipment availability and the effectiveness in carrying out different stages of hand washing were the key factors which could have impacted the contagion of the professionals. Strategies should therefore be developed to: reinforce occupational hazard prevention procedures regarding conation; improve the training in PPE for professionals; provide appropriate protection measures; improve the availability and distribution of updated protocols; reinforce adherence to hand hygiene, and set workloads within the care context.
FinancingThe SANICOVI® Project was financed in calls for the expression of interest in projects on SARS-CoV-2 and the COVID-19 disease from the Instituto de Salud CarlosIII. File number: COV20/01539
Conflict of interestsThe authors have no conflict of interests to declare.
Our thanks to all the front-line health professionals in the SARS-CoV-2 pandemic, to those who have suffered from the disease and particularly to those who were lost to it.
Eva Abad-Corpa, Laura Albornos-Muñoz, Elvira Casado-Ramírez, Rafaela Camacho-Bejarano, María Ángeles Cidoncha-Moreno, María Consuelo Company-Sancho, Silvia Esteban-Sepúlveda, Isabel Feria-Raposo, Esther González-María, Ana Covadonga González-Pisano, Francisco Javier Iruzubieta-Barragán, Xosé Manuel Meijome Sánchez, María Teresa Moreno-Casbas, Daniel Muñoz Jiménez, María Isabel Orts-Cortés, Lorena Pinilla-Navas, Manuel Rich-Ruiz, Pilar Rodríguez-Baz, Dolores Sánchez-López, M. Clara Vidal Thomàs.
Members of the Group SANICOVI are related in the Appendix 1.
Please cite this article as: Moreno-Casbas MT, en nombre del Grupo SANICOVI y Grupo de profesionales de la salud trabajando en la pandemia COVID-19. Factores relacionados con el contagio por SARS-CoV-2 en profesionales de la salud en España. Proyecto SANICOVI. Enferm Clin. 2020;30:360–370.
on behalf of the Grupo SANICOVI and Grupo de profesionales de la salud trabajando en la pandemia COVID-19.
articles

Enfermería Clínica (English Edition) follows the Recommendations for the Conduct, Reporting, Editing and Publication of Scholarly Work in Medical Journals