


Attention deficit hyperactivity disorder (ADHD) is a common neurodevelopmental disorder. Adult ADHD is currently diagnosed based only on subjective clinical and scoring measures, which inevitably lead to a low correct diagnosis rate. Hence, an effective auxiliary examination with higher sensitivity is needed.
MethodTwenty healthy controls (HC) subjects and 20 adults with ADHD were included in this study. The functional near-infrared spectroscopy (fNIRS) under verbal fluency test (VFT) was performed to detect cerebral cortex hemodynamics. Correlation and Receiver operating characteristic (ROC) curve analysis were employed to reveal the relationship between differences in hemodynamic response and clinical characteristics.
ResultsThe HbO response of adult ADHD in the prefrontal cortex (PFC) was significantly smaller than that of HC. HbO concentration changes in the corresponding channels were negatively correlated with the ASRS-inattention score. HbO concentration changes of channels 16 and 26 corresponding to the medial PFC might be helpful for the diagnosis of adult ADHD.
ConclusionAdult ADHD patients have low activation of the PFC, changes of whose corresponding channels were significantly associated with attention deficit, indicating that fNIRS under VFT may be an effective auxiliary examination for adult ADHD.
Attention deficit hyperactivity disorder (ADHD) is a common neurodevelopmental disorder, which could persist into adulthood. The prevalence of adult ADHD is about 1.4–3.6%.1 However, the adult ADHD diagnosis is considered to be more difficult than children due to multiple comorbidities and variable access to childhood records or histories.2 Therefore, effective auxiliary examination method for adult ADHD is in need.
With the development of functional brain imaging, evidence on the neuroimaging changes of ADHD has accumulated significantly, providing the possibility of potential biomarker of ADHD. Several functional MRI (fMRI) study have generally implicated the frontal, frontoparietal, temporal, and even frontal limbic networks abnormalities in ADHD.3 However, fMRI have the disadvantage of high sensitivity to movement artifacts, low ecological validity as well as low temporal resolution. These limitations preclude their widespread use in clinical diagnosis especially among the active ADHD populations.
By contrast, functional near-infrared spectroscopy (fNIRS) is a non-invasive neuroimaging technique, performed with a light and small instrument without a radiographer. Studies have shown a high correlation (r = 0.77–0.94) between fNIRS and fMRI in measure activity during cognitive tasks.4 Furthermore, it is compatible with a variety of neuroimaging instruments, which make it suitable for multimodal measures. However, fNIRS cannot reconcile its bad spatial resolution to good temporal resolution, due to the lack of neuroanatomical structures detailed pictures.5 Regional neuron activity triggers an increase in oxygenated hemoglobin (HbO) and a slight decrease in deoxyhemoglobin (HbR), called neurovascular coupling. Near-infrared light of different wave-lengths (650–1000 nm) are emitted from fNIRS device, absorbed and reflected by hemoglobin. Using the modified Beer–Lambert law, monitored reflected light is used to compute the changes of HbO and HbR concentrations over time to maps brain activity.6,7
In recent years, fNIRS has been increasingly used to study a wide range of psychiatric disorders, including schizophrenia,8 major depression disorder (MDD),9,10 bipolar disorder (BD),11 panic disorder,12 obsessive-compulsive disorder,13 autism spectrum disorder14,15 and ADHD.16,17 fNIRS was also used to identify mental illnesses with overlapping symptoms. For instance, it has been used to differentiate BD with MDD,18 borderline personality disorder (BPD) with MDD,19 and BPD with BD.20 The above studies provide some fNIRS features of psychiatric disorders, but are not yet sufficient for clinical diagnosis.
In adult ADHD, reduced hemodynamic responses have been observed with fNIRS. Schecklmann et al. reported significantly smaller [oxy-Hb] changes during the phonological and semantical fluency task in the bilateral inferior frontal gyrus, ventrolateral prefrontal cortex (VLPFC), dorsolateral prefrontal cortex (DLPFC) and parts of the superior temporal gyrus in adult ADHD, compared with healthy controls (HC).21 Recently, Yamagata et al. examined reduced activations in bilateral prefrontal and temporal cortices in response to verbal fluency test (VFT), revealed a detailed aberrant activation patterns of ADHD.22 VFT, a commonly used experimental paradigm in neuropsychology, activates areas that closely related to executive function, such as inferior frontal gyrus and DLPFC, representing highly sensitivity to cognitive impairment caused by various causes.23
Based on previous studies on adult ADHD, we thought it was necessary to explore if the reduced hemodynamic responses to VFT were associated with clinical symptoms, and verify its value in clinical diagnosis. In this study, we hypothesized that adults with ADHD would have reduced prefrontal hemodynamic responses to VFT as measured by fNIRS, associating with ADHD symptoms. We included 20 HC subjects and 20 adults with ADHD, assessed the ADHD symptoms with adult ADHD self-report scale (ASRS), and explored the difference of cerebral cortex hemodynamics between adult ADHD and HC through fNIRS during VFT paradigm. In addition, the Pearson correlation coefficient and ROC curve analysis revealed the clinical application potential of fNIRS during VFT paradigm for ADHD diagnosis.
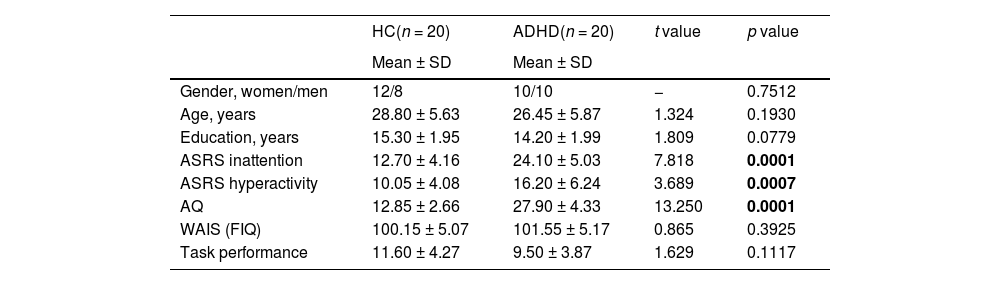
MethodParticipantsThis study included 20 adult ADHD patients and 20 age-, sex-, education-, IQ-matched HCs. In the adult ADHD group, a total of 31 adult ADHD were included, 11 were ruled out according to the exclusion criteria. The demographic and clinical data for participants are shown in Table 1. All the participants were respectively examined by two psychiatrists (Manli Ran and Xiao Zhang) using the Mini-International Neuropsychiatric Interview.
Participant characteristics.
Inclusion criteria for the whole sample were as follows: (1)18–50 years old; (2) years of schooling ≥9; (3) native speakers of Chinese; (4) right handedness (scores of Edinburgh Handedness Inventory ≥ 70)24; (5) full-scale IQ of Wechsler Adult Intelligence Scale-Revised in China (WAIS-RC) ≥90.
Conditions for recruitment into the adult ADHD group should also include that participants were assessed by two experienced psychiatrists as meeting the adult ADHD diagnostic criteria in the DSM-V. For a more reliable diagnosis, we collected information about the patients' childhood from their caregivers (always their mother/father).
Exclusion criteria for all the participants were: (1) a history of neurological illness, such as epilepsy, cerebrovascular disease, encephalitis, etc.; (2) traumatic brain injury with any known cognitive consequences or loss of consciousness for more than 5 min; (3) a physical condition requiring treatment.
Healthy controls with the following conditions will be excluded: (1) current and lifetime history DSM-V diagnoses; (2) a family history of psychiatric disease among their first-degree relatives.
An additional exclusion criterion for the adult ADHD were: (1) diagnosed with ADHD as a child; (2) lifetime history of psychiatric disorders other than ADHD (e.g. autism spectrum disorder, bipolar disorder, depression, anxiety, schizophrenia, obsessive-compulsive disorder, drug or alcohol misuse, etc.); (3) a history of treatment with stimulants or other psychiatric medication.
To assess the presence of autistic traits, autism spectrum quotient (AQ) was applied in all participants. When participants got score greater than 32, further interviews were conducted. An adult ADHD who got AQ scores of 44 was eliminated due to comorbidity of autism spectrum disorder after detailed psychiatric examination and childhood information provided by his mother. Besides, two psychiatrists performed detailed psychiatric examination separately among participants and gave a consistent diagnosis. Three adults with ADHD were comorbid with anxiety, five with depressive episode, two with alcohol abuse, all of which were ruled out.
The adult attention deficit/hyperactivity disorder self-report scales (ASRS)ASRS were developed by a WHO advisory committee composed of ADHD experts in collaboration with the WHO World Mental Health (WMH) Survey Initiative.25 The ASRS v1.1 symptom checklist is a self-report 18-item scale and is meant to identify patients who may be at risk for ADHD. Each question asked how often a symptom occurred over the past 6 months on a 0–4 scale with responses of never (0), rarely (1), sometimes (2), often (3), and very often (4).26 ASRS is ease to use and has good reliability and validity, which make this tool useful for evaluating patients in the clinical setting.27
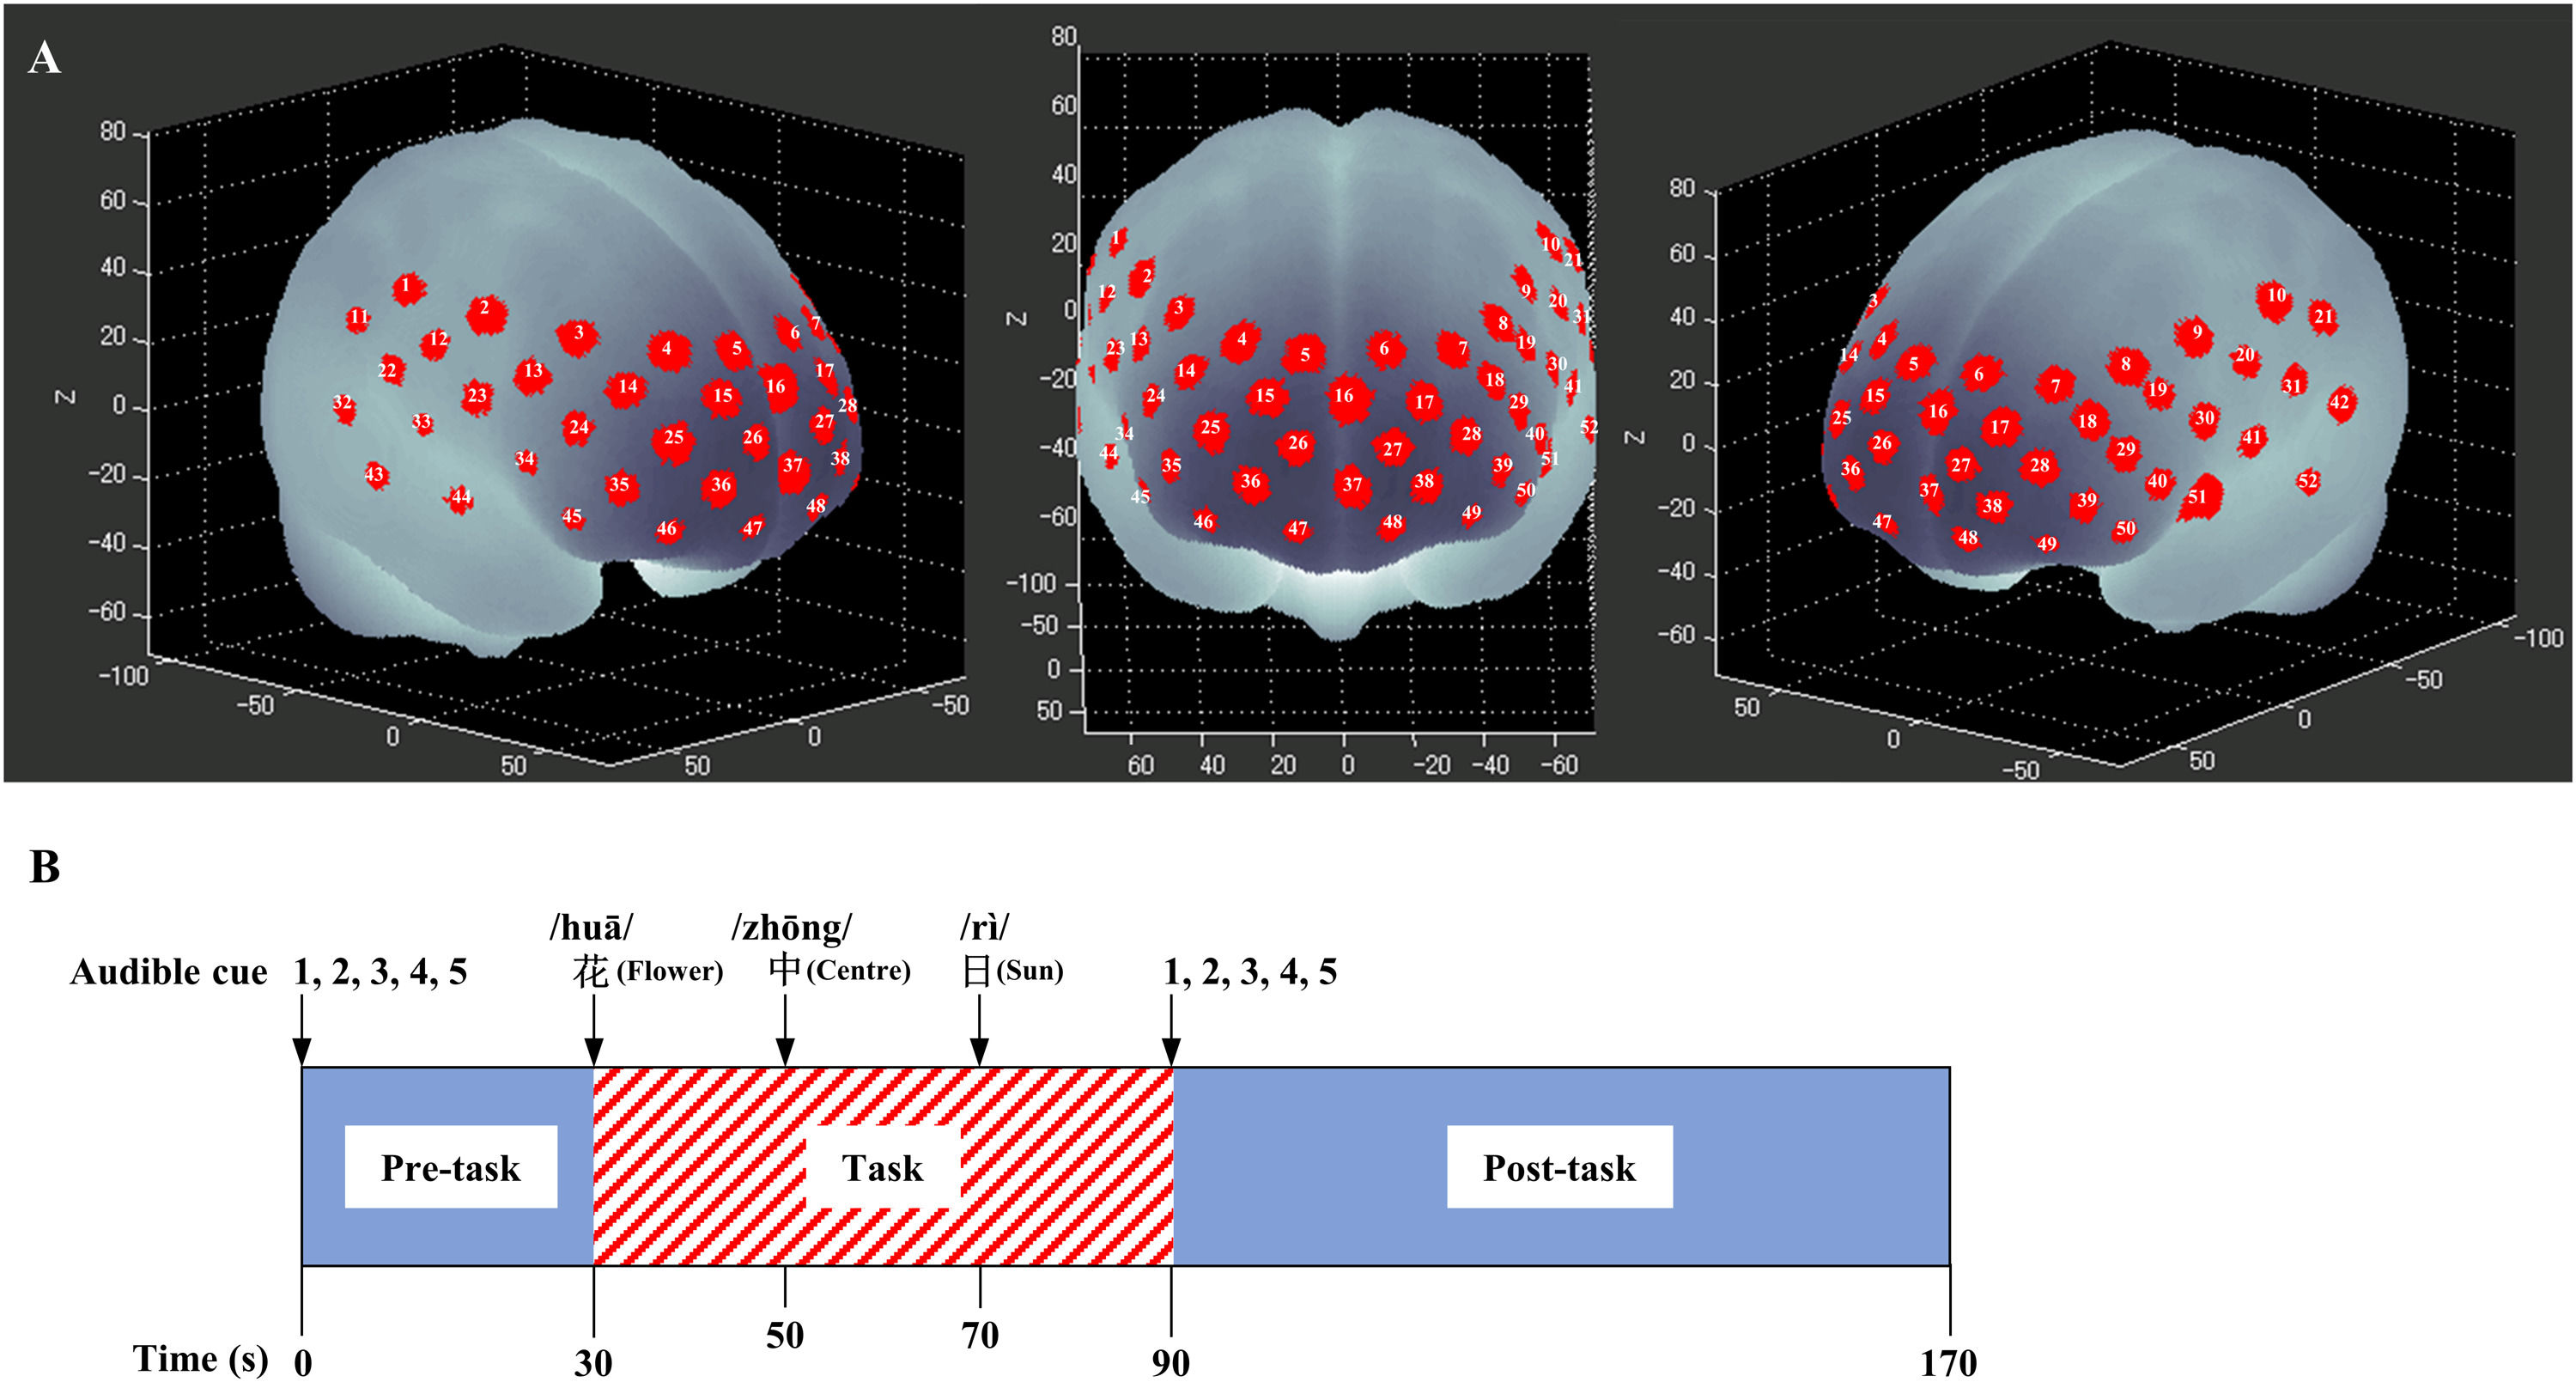
Functional near-infrared spectroscopyA 52-channel functional near-infrared spectral machine (ETG-4000, Hitachi, Tokyo, Japan) was used to measure the relative optical signals changes. Sixteen emission light sources and 17 detectors were placed in a 3 × 11 probe sheath with a distance of 3 cm between the light source and the detector. Each measurement area between pairs of source/detector probes was defined as a “channel” (Fig. 1A). The light source emitted near-infrared light at 695 nm and 830 nm at a sampling rate of 10 Hz. The probe sheath was covered over the surface regions of the PFC on bilateral sides [DLPFC; ventrolateral PFC (VLPFC); frontopolar PFC] and the temporal cortex. The lowest probes were positioned along the T3–Fpz–T4 line, according to the international 10/20 system.28 To estimate the cortical localization of each channel, we used the virtual registration method, which enables the probabilistic registration of NIRS data onto the Montreal Neurological Institute (MNI) coordinate space without data on magnetic resonance images or probe positions.29
 The image shows the probe setting and measurement points for 52-channel fNIRS. The channel numbers are indicated above the cortical regions. (B) The timeline presents the stimulus during the pre-task, task and post-task periods of VFT.")
Since HbO was more effective and sensitive than HbR in reflecting cerebral hemodynamics,30 we only focused on the HbO in this study. After manually deleting obvious abnormal signals, the raw data were converted into changes in optical density data. The obtained data were analyzed using the “integral mode”; the pre-task baseline was determined as the mean across 10 s before the active task period, and the post-task baseline was determined as the mean across the last 10 s of the post-task period; a linear fitting was applied to the data between these two baselines. The wavelet-based motion artifact correction function (hmrMotionCorrectWavelet. m) in homer2 toolkit was applied to correct spike artifacts.31,32 Data were filtered with a 1 Hz low-pass filter and 0.1 Hz high-pass filter to remove baseline wandering.33 The corrected optical density data were converted into HbO and HbR concentration changes according to the Modified Beer–Lambert law.30 Based on the negative correlation between HbO and HbR, the hmrMotionCorrectCbsi. m function was used to further enhance the signal-to-noise ratio.34 The Student's t-test was performed to detect the average of the HbO change with the false discovery rate (FDR) correction for multiple comparisons applied. The difference was considered statistically significant when p < 0.01.
Verbal fluency taskThe Chinese version of verbal fluency task consisted of a 30 s pre-task, a 60 s activation task, and a 80 s post-task. During the pre-task and post-task baseline periods, participants were instructed to repeat numbers from one to five. During the task period, the prompt voice read a Chinese character every 20 s (‘花’,‘中’,‘日’, which indicate “flower”, “center”, and “sun”, respectively). The participants were instructed to generate as many Chinese words containing a designated Chinese character as possible (Fig. 1B).
Statistical analysisStatistical analysis was performed with MATLAB R2013a (The MathWorks, Inc., Natick, MA). Firstly, the Shapiro–Wilk normality test was applied. The Levene test was performed to test the homogeneity of variance. All data were consistent with a normal distribution and variance homogeneity. The Student's t-test was performed to detect the statistical differences. The Pearson correlation coefficient was used to evaluate the linear correlation between HbO change and ASRS score. Receiver operating characteristic (ROC) curve analysis was performed to determine a cut-off level for HbO change associated with ADHD diagnosis. The statistically optimal cut-off value was estimated by the maximal Youden index. A p value <0.05 was deemed significant.
ResultsDemographic dataAs shown in Table 1, the HC and adult ADHD groups did not significantly differ with regard to gender (HC, 60% women vs ADHD, 50% women, p = 0.7512), age (HC, 28.80 ± 5.63 vs ADHD, 26.45 ± 5.87, t = 1.324, p = 0.1930), education (HC, 15.30 ± 1.95 vs ADHD, 14.20 ± 1.99, t = 1.809, p = 0.0779), or FIQ (HC, 100.15 ± 5.07 vs ADHD, 101.55 ± 5.17, t = 0.865, p = 0.3925). Adult ADHD scored significantly higher than HC on the ASRS part A (inattention) (HC, 12.70 ± 4.16 vs ADHD, 24.10 ± 5.03, t = 7.818, p < 0.0001) and part B (hyperactivity) (HC, 10.05 ± 4.08 vs ADHD, 16.20 ± 6.24, t = 3.689, p = 0.0007). 95% adult ADHD participants (n = 19) exceeded the cut-off of the ASRS (≥17), except one of twenty scored below 17 in both parts of ASRS, whose diagnosis of adult ADHD was confirmed by psychiatrist based on DSM-V. 50% (n = 11) ADHD participants were classified as combined subtype, while 45% (n = 8) were classified as predominately inattentive subtype. The mean AQ score of adult ADHD was 27.90 (SD, 4.33), significantly higher than that of HC (12.85 ± 2.66) (t = 13.250, p < 0.0001). The generated Chinese words number in VFT of each group were not significantly different (HC, 11.60 ± 4.272 vs ADHD, 9.50 ± 3.87, t = 1.629, p = 0.1117).
fNIRS data resultsThe HbO concentration changes between task and post-task periods of VFT were tested by a 52-channel fNIRS machine. Group differences were tested with FDR correction. A topographic representation of the p-values of HbO comparison between the two groups during the VFT is shown in Fig. 2. The HbO changes in the ADHD group were significantly smaller than those in the HC group in the channels corresponding to the right DLPFC (CH4, p = 0.0040, CH15, p < 0.0001), left DLPFC (CH17, p = 0.0077), and medial prefrontal cortex (MPFC) (CH16, p = 0.0057, CH26, p = 55, CH36, p = 0.0074).
Correlation and ROC curve analysis
For the participants of both groups, correlation analyses showed that the changes of HbO concentration in the right DLPFC (CH4, r = −0.4160, p = 0.0084, CH15, r = −0.4247, p = 0.0110), left DLPFC (CH17, r = −0.3533, p = 0.0437), and MPFC (CH16, r = −0.3984, p = 0.0109, CH26, r = −0.4497, p = 0.0076) were negatively correlated with the ASRS-inattention score, while changes of HbO concentration in the MPFC (CH26, r = −0.3568, p = 0.0383) was negatively correlated with the ASRS-hyperactivity score (Table 2). Meanwhile, HbO changes in the CH4 (r = −0.3724, p = 0.0196), CH15 (r = −0.4663, p = 0.0047) and CH17 (r = −0.3850, p = 0.0269) were negatively correlated with AQ score. Therefore, the changes of HbO concentration in the channels 16 and 26, corresponding to the MPFC, were correlated with ADHD symptoms, but not autism spectrum disorder.
Correlation between the ADHD symptoms and fNIRS data.
As shown in Fig. 3, ROC curve analysis was performed to evaluate the predictive accuracies and cut-off values of HbO concentration changes. The area under the curve (AUC) for HbO concentration changes in channel 16 and 26 were 0.7550 (p = 0.0058) and 0.7647 (p = 0.0084), whose cut-off value based on Youden index was 0.1519 (sensitivity, 65.00%, specificity, 85.00%) and 0.2808 (sensitivity, 70.59%, specificity, 76.47%), respectively. These results indicated that HbO concentration changes of channel 16 and 26 might be superior to other channels in terms of assisting the diagnosis of adult ADHD.
Discussion
In this study, differences in hemodynamic response during VFT between adults with ADHD and HC were explored. It was found that the HbO response of adult ADHD in PFC was significantly smaller than that of HC, though there was no difference in the number of words generated during the VFT. Moreover, the HbO activation of corresponding channels was significantly negatively correlated with the score of ASRS, but not AQ. ROC curve analysis suggested that the change of HbO concentration in channels 16 and 26, corresponding to the MPFC, was of auxiliary value in the diagnosis of adult ADHD. These results were in line with our hypotheses, providing support for the use of fNIRS in adults ADHD diagnosis.
Our results found the reduced activation in PFC in adult ADHD compared to HC, which was consistent with the previous functional magnetic resonance imaging (fMRI) findings. A meta-analysis of task-based fMRI studies reported the ADHD-associated hypoactivation in frontoparietal regions.35 Analogously, another meta-analysis of 287 individuals with ADHD and 320 HCs indicated that during the task, ADHD patients exhibited reduced activation in frontostriatal regions.36 Although fMRI detects subcortical brain activity with higher signal-to-noise ratio and spatial resolution, fNIRS is widely used in clinical psychiatry due to its cost-effectiveness, portability, high ecological validity and resistance to motion artifacts.4,37 Our findings of VFT task coincided with the results across gold-standard task based fMRI studies in adult ADHD, suggesting that fNIRS may be useful for assessing the symptoms of ADHD.
Correlation analyses revealed that the HbO changes in CH4, CH15, CH16 and CH17 during VFT were negatively correlated with the ASRS-attention deficit scores in total 40 participants, and CH26 HbO change was negatively correlated with both inattention and hyperactivity scores of ASRS, which were in line with previous studies. Ueda et al,38 used the Stroop color-word task to examine the characteristics of prefrontal hemodynamic responses in adult ADHD. They found that there were negative correlations between the symptomatic severity and the oxy-Hb changes at channels 16, 21, 23 and 24 (located in the inferior prefrontal cortex) of the ADHD group. Interestingly, in our research, CH16 and CH26 HbO changes showed good correlation with ADHD symptoms, independent to autism spectrum disorder. CH16 and CH26 HbO changes of VFT-based fNIRS may therefore be helpful for the diagnosis of adult ADHD, whose diagnostic values were revealed by ROS curve analysis. However, diagnostic value based on single channel HbO change is unstable. HbO change based on regression analyses of multiple channels, which ask for larger sample size and less missing values, may increase the sensitivity, specificity and stability
Recently, machine learning (ML) has been gradually applied to assist the diagnosis, treatment outcomes and prognosis for psychiatric disorders.39-41 ML is able to automatically learning from empirical data to recognize complex patterns, particularly suitable for processing complex neuroimaging data.42 In the future, with the continuous development of fNIRS and the update of artificial intelligence algorithms, more large-sample, multi-stratified, long-term research will be carried out. For example, ML that analyzes the response of patients with different fNIRS characteristics to certain treatments can help predict patients' sensitivity to the treatment and achieve personalized treatment.
ConclusionThis study further verified the diminished prefrontal hemodynamic response in adult ADHD compared with HC, which was significantly associated with attention deficit. The cut-off value of HbO change in CH16 and CH26 has high sensitivity and specificity in adult ADHD diagnosis. These results provided supporting evidence for the application of VFT-based fNIRs in adult ADHD, indicating that MPFC HbO changes during VFT may be an auxiliary biomarker of adult ADHD.