


Intellectual disability (ID) is a prevalent comorbidity in children with cerebral palsy (CP), presenting significant challenges to individuals, families and society. This study aims to develop a predictive model to assess the risk of ID in children with CP.
MethodsWe analyzed data from 885 children diagnosed with CP, among whom 377 had ID. Using least absolute shrinkage and selection operator regression, along with univariate and multivariate logistic regression, we identified key predictors for ID. Model performance was evaluated through receiver operating characteristic curves, calibration plots, and decision curve analysis (DCA). Bootstrapping validation was also employed.
ResultsThe predictive nomogram included variables such as preterm birth, CP subtypes, Gross Motor Function Classification System level, MRI classification category, epilepsy status and hearing loss. The model demonstrated strong discrimination with an area under the receiver operating characteristic curve (AUC) of 0.781 (95% CI: 0.7504-0.8116) and a bootstrapped AUC of 0.7624 (95% CI: 0.7216-0.8032). Calibration plots and the Hosmer-Lemeshow test indicated a good fit (χ2= 7.9061, p = 0.4427). DCA confirmed the model's clinical utility. The cases were randomly divided into test group and validation group at a 7:3 ratio, demonstrating strong discrimination, good fit and clinical utility; similar results were found when stratified by sex.
ConclusionsThis predictive model effectively identifies children with CP at a high risk for ID, facilitating early intervention strategies. Stratified risk categories provide precise guidance for clinical management, aiming to optimize outcomes for children with CP by leveraging neuroplasticity during early childhood.
Cerebral palsy (CP) is defined as a movement and posture disorder that results in activity limitation due to no progressive disturbances in the developing brain, often accompanied by various impairments (Rosenbaum et al., 2007). Among these, intellectual disability (ID) is particularly prevalent, though there is significant variability in estimates regarding its prevalence in children with CP. Western countries with national registries report prevalence rates of about 30% to 42.01% (Bufteac Gincota, Jahnsen, Spinei, & Andersen, 2021; Cummins et al., 2021; Himmelmann et al., 2006; Sigurdardottir et al., 2008). A population-based study based on the Victorian CP Register reported a prevalence of 45% (Reid et al., 2018). A meta-analysis in 2023 found the prevalence to be 37.2% (95%CI 26.7-48.3%) (Sattoe & Hilberink, 2023). Additionally, a systematic review reported that half of the children with CP have ID (Novak et al., 2012). Another recent meta-analysis of studies from China reported the prevalence of 58.0% (95% CI: 51.8-64.3%) (Gong et al., 2023). ID significantly impacts daily activities, caregiver burden, quality of life, and longevity (Aguayo et al., 2019; Olusanya et al., 2022). Furthermore, motor and intellectual abilities are interdependent, especially during early developmental stages (Casey et al., 2005). However, ID can typically only be diagnosed in children older than 4 or 5 years of age using IQ tests and assessments of adaptive capacity, or through clinical features in those unable to complete such assessment. Delays in diagnosis of ID may hinder timely interventions that leverage early neuroplasticity to improve outcomes (Yuan et al., 2018).
ID is challenging to predict because it encompasses a heterogeneous group of conditions that affect intellectual functioning and adaptive behaviors. A study from the health database of the Nice Region developed a diagnostic model to identify severe ID in teenagers with CP (Bertoncelli et al., 2019). This model was based on data from 21 subjects with severe ID out of 486 individuals with CP. Although the development of the predictive learning model was detailed, its validation and calibration were not provided (Bertoncelli et al., 2019). Additionally, focusing on teenagers may miss the optimal time for intervention, and the study's small sample size (only 21 subjects with severe ID) could limit the reliability of the findings (Bertoncelli et al., 2019).
To explore the comorbidities associated with ID in CP, we utilized a case-control design within a large CP cohort to develop and validate a logistic regression diagnostic model. This model aims to identify risk factors associated with ID in CP. This study adheres to the Transparent Reporting of a multivariable prediction model for Individual Prognosis or Diagnosis guidelines or multivariable prediction model research (Collins et al., 2015; Wolff et al., 2019). Additionally, to minimize the risk of bias, the Prediction model Risk of Bias Assessment Tool was employed as a guiding checklist for this study (Wolff et al., 2019) .
Materials and methodsStudy populationData were collected from pediatric patients diagnosed with CP who underwent rehabilitation interventions at the Child Rehabilitation Center of the Third Affiliated Hospital between January 1, 2011 and December 31, 2020. Pediatric neurologists or child rehabilitation doctors conducted comprehensive evaluations, which included assessing maternal, perinatal, and postnatal risk factors, developmental milestones, medical history, neurological examinations, routine cerebral imaging, and laboratory tests. Metabolic or genetic analyses were recommended for children with normal brain imaging results and no evident high-risk factors. Children whose last admission to the center was less than 24 months ago were followed up until they reached at least 24 months of age. Those found to have abnormal genetic or metabolic features explaining the clinical features of "CP" were excluded from the CP group during hospitalization or follow-up (Yuan et al., 2024). Only cases with comprehensive data were included in the analysis.
Sample size calculation and predictor selectionThe sample size was calculated using the methodology proposed by Riley and implemented through the pmsampsize package (Riley et al., 2020). With an observed ID rate of 43% among children with CP and a c-index (Bertoncelli et al., 2019) of 0.74, the necessary sample size was calculated to be 836. This sample size is adequate to develop and validate a clinical prediction model effectively.
Predictor variables were chosen based on various factors associated with CP, categorized into maternal, perinatal, and postnatal risk factors (Sadowska et al., 2020; Yuan et al., 2019). Maternal factors included advanced maternal age, adverse pregnancy histories (Qian et al., 2023), family address, and accompany diseases during pregnancy. Perinatal risk factors such as perinatal adversity, gestational age, sex, multi-birth, intrauterine growth retardation, gravidity, and parity were also considered. Additionally, postnatal risk factors, clinical features and comorbidities, such as Gross Motor Function Classification System (GMFCS) (Dalvand et al., 2012), MRI classification system (MRICS) (Reid et al., 2018), CP subtypes (Noten et al., 2022), epilepsy (Reid et al., 2018), hearing loss (Reid et al., 2018), and visual impairments (Reid et al., 2018) were included. The selection of these predictors was informed by previous studies indicating their association with ID in individuals with CP (Bertoncelli et al., 2019; Cummins et al., 2021; Huang et al., 2016; Reid et al., 2018).
Data management and definitionID was identified in children aged 4 years and older, through the use of IQ tests with scores below 70 and evaluations of limited adaptive functioning. In cases where children were unable to complete standard intelligence assessments due to their condition, ID was determined through clinical observations, with only these estimations being deemed reliable (Stadskleiv, 2020). Maternal age was dichotomized into advanced maternal age (≥35 years) and no-advanced maternal age (younger than 35 years) (Attali & Yogev, 2021; Schneider et al., 2018). Adverse pregnancy histories included spontaneous abortions and stillbirths. Maternal conditions included in the analysis were hypertension, diabetes, pre-eclampsia and eclampsia. Preterm birth was defined as delivery before 37 weeks of gestation. Birth weight was classified as low birth weight (<2500 g) and normal birth weight (≥2500 g) (Başaran et al., 2023). Intrauterine growth retardation was characterized by fetal weight falling below the 10th percentile for gestational age (Vandenbosche & Kirchner, 1998), as determined by the standards derived from a study encompassing 28 provinces in China (Li et al., 2015). Definitions for CP subtypes, epilepsy, learning loss, visual impairment, GMFCS, MRICS were established prior to the initiation of this study (Yuan et al., 2024).
Statistical analysisThe data were presented as counts and percentages and analyzed using R (V 4.3.2; https://www.R-project.org) and Stata 17. Univariate analysis was performed using Tableone package to identify significant variables (p<0.1). The LASSO method (glmnet package) was utilized to avoid collinearity and identify optimal predictors for the ID risks in children with CP. Predictors with a significance level of p < 0.1 in univariate analysis were considered for LASSO analysis, and predictors with nonzero coefficient in LASSO analysis (logλ1_SE) were used to establish the nomogram of clinical prediction model (Hmisc package; rms package). Statistical tests were conducted as two-sided, ensuring a comprehensive evaluation of the results.
The prediction model was validated across three aspects (Iasonos et al., 2008): 1) Discrimination: The model's discrimination ability was evaluated using receiver operating characteristic (ROC) curves, and the area under the ROC curve (AUC). An AUC value greater than 0.7 was deemed to be indicative of robust predictive performance. Furthermore, a corrected C-index was calculated using bootstrapping with 1000 replicates to further confirm the model's discriminative capacity. 2) Calibration: The calibration of the model was assessed through calibration plots (rms packages) and the Hosmer-Lemeshow test (ResourceSelection package) (Lele & Keim, 2006). A Hosmer - Lemeshow test with a p value > 0.05 indicated satisfactory calibration, validating that the predicted probabilities closely matched the actual outcomes. 3) Clinical Utility: The clinical utility of the model was evaluated using decision curve analysis (DCA) (rmda package), which measured the net benefits across various threshold probabilities in the entire cohort to assess its clinical practicality.
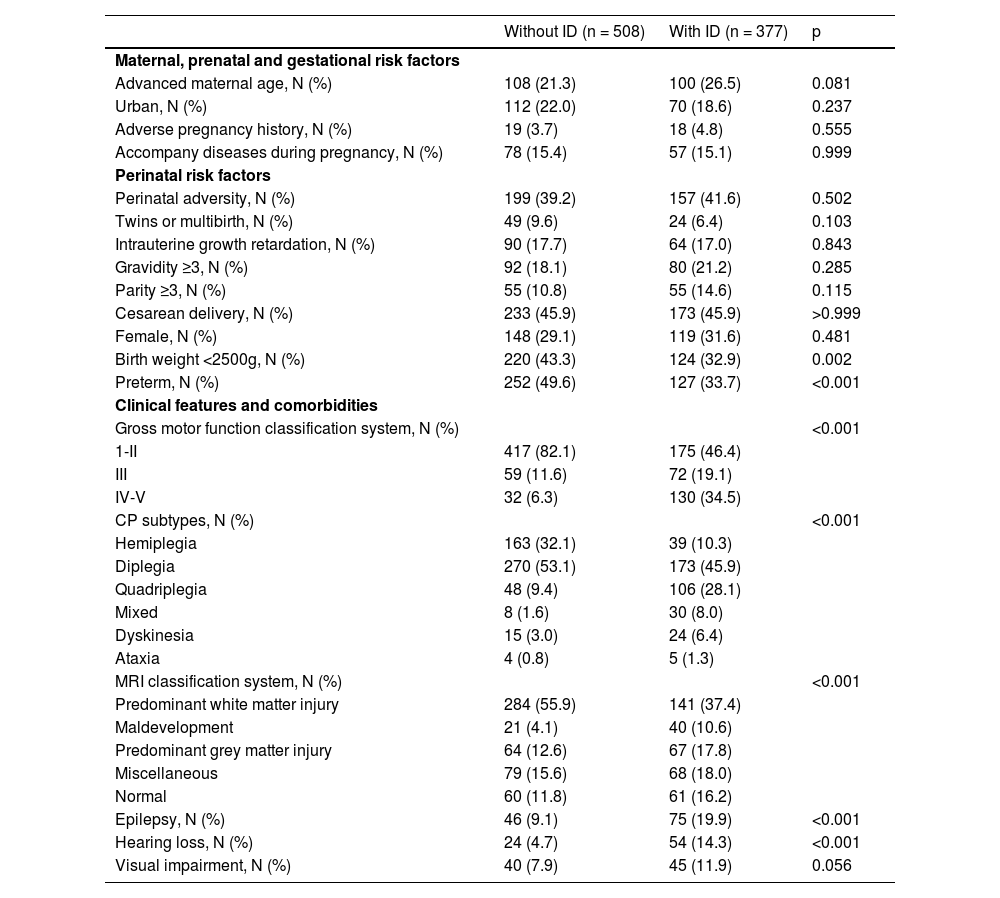
ResultsStudy cohortA total of 885 children aged 48 months and older (range: 48 -189 months) with CP were included in the study, all of whom had complete datasets. Within the sample population, 42.60% (377 out of 885 were identified as having ID, with 78.25% (295 out of 377) categorized as mild ID, and 21.75% (82 out of 377) as severe ID. Additionally, 69.88% (618 out of 885) of these children were male, with an average age of 80.11 ± 26.32 months. The 885 CP children were randomly classified into the derivation (n = 599) and validation sets (n = 256) at a 7:3 ratio. Further details regarding the demographic characteristics of the children can be found in Table 1.
Clinical and demographic characteristics of the cohort.
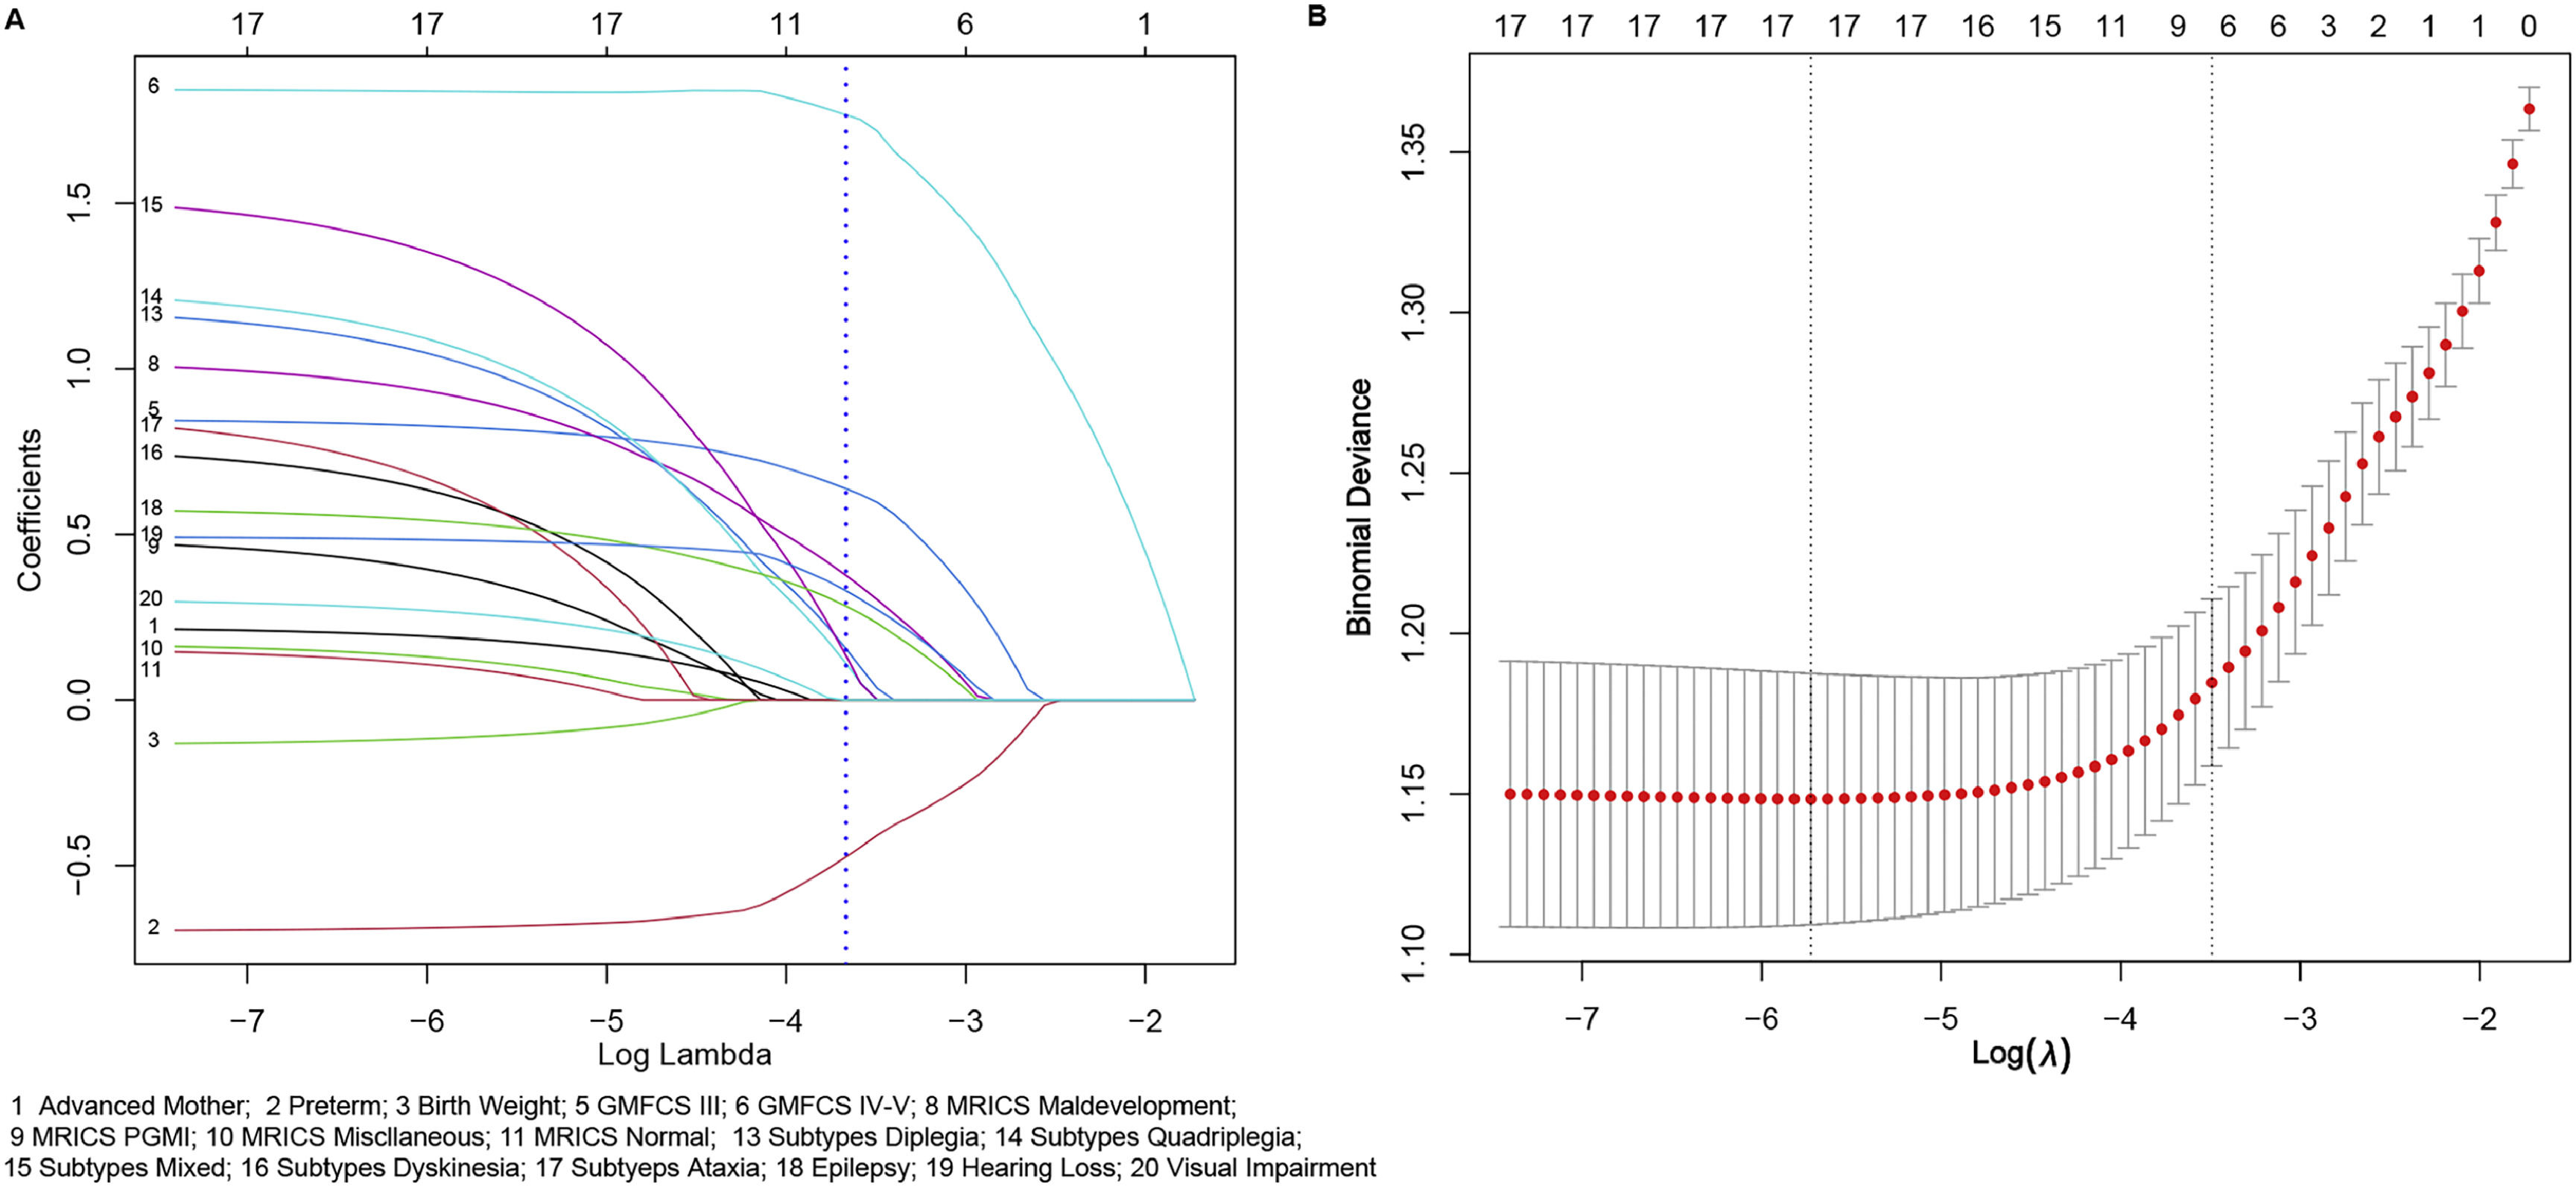
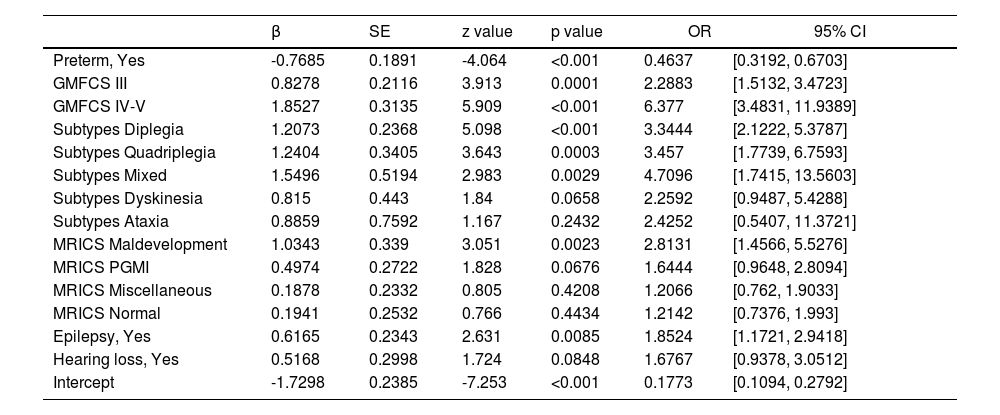
In this study, 9 variables that achieved a p < 0.1 were subsequently analyzed using LASSO logistic regression, of which 8 demonstrated nonzero coefficients with a penalty parameter (λ) (Fig 1). Variables with p < 0.05 including preterm birth, GMFCS levels, MRICS, CP subtypes, and epilepsy were identified as independent predictors for ID development on multivariate logistic regression analysis. Although the variable hearing loss had a p-value of 0.0848, considering the increased risk of hearing problems in people with ID (Willems et al., 2022) and its OR (1.6767), we included hearing loss in our prediction model. Based on these results, a new predictive equation was established: Logit P = −1.2798 - 0.7685*(preterm) + 0.8278*(GMFCS III-V) + 1.8527*(GMFCS, V) + 1.2072*(Subtypes, diplegia) + 1.2404*(Subtypes, quadriplegia) + 1.5496*(Subtypes, mixed) + 0.815* (Subtypes, dyskinesia) + 0.8859 *(Subtypes, ataxia) +1.0343*(MRICS, maldevelopment) + 0.4974*(MRICS, PGMI) + 0.1878*(MRICS, miscellaneous) + 0.1941*(MRICS, normal) + 0.6165*(epilepsy) + 0.5168*(MRICS, hearing loss). The details of the prediction equation are shown in Table 2, which includes the odds ratios (ORs) indicating the strength of each independent variable's contribution to the outcome. Table 2 also provides the estimated beta coefficient for the independent variables, where β = ln (OR). The results of multivariate logistic regression analysis show that the ORs and β coefficients are adjusted or weighted (Stoltzfus, 2011).
. A blue dotted vertical line indicates one standard error of the lambda from ten-fold cross-validation, marking the optimal lambda. This resulted in the selection of 8 features with nonzero coefficients. B. The LASSO regression model was employed with ten-fold cross-validation based on the minimum criteria. The plot illustrates log (lambda) on the x-axis and binomial deviance on the y-axis. The dotted vertical lines represent the minimum lambda (0.003263) and one standard error of the lambda (0.03043) on the log (lambda) scale.")
Selection of demographic and clinical features using the lasso regression model. A. The coefficients of the variables are plotted against log (lambda). A blue dotted vertical line indicates one standard error of the lambda from ten-fold cross-validation, marking the optimal lambda. This resulted in the selection of 8 features with nonzero coefficients. B. The LASSO regression model was employed with ten-fold cross-validation based on the minimum criteria. The plot illustrates log (lambda) on the x-axis and binomial deviance on the y-axis. The dotted vertical lines represent the minimum lambda (0.003263) and one standard error of the lambda (0.03043) on the log (lambda) scale.
Multivariate logistic regression analysis of independent risk factors.
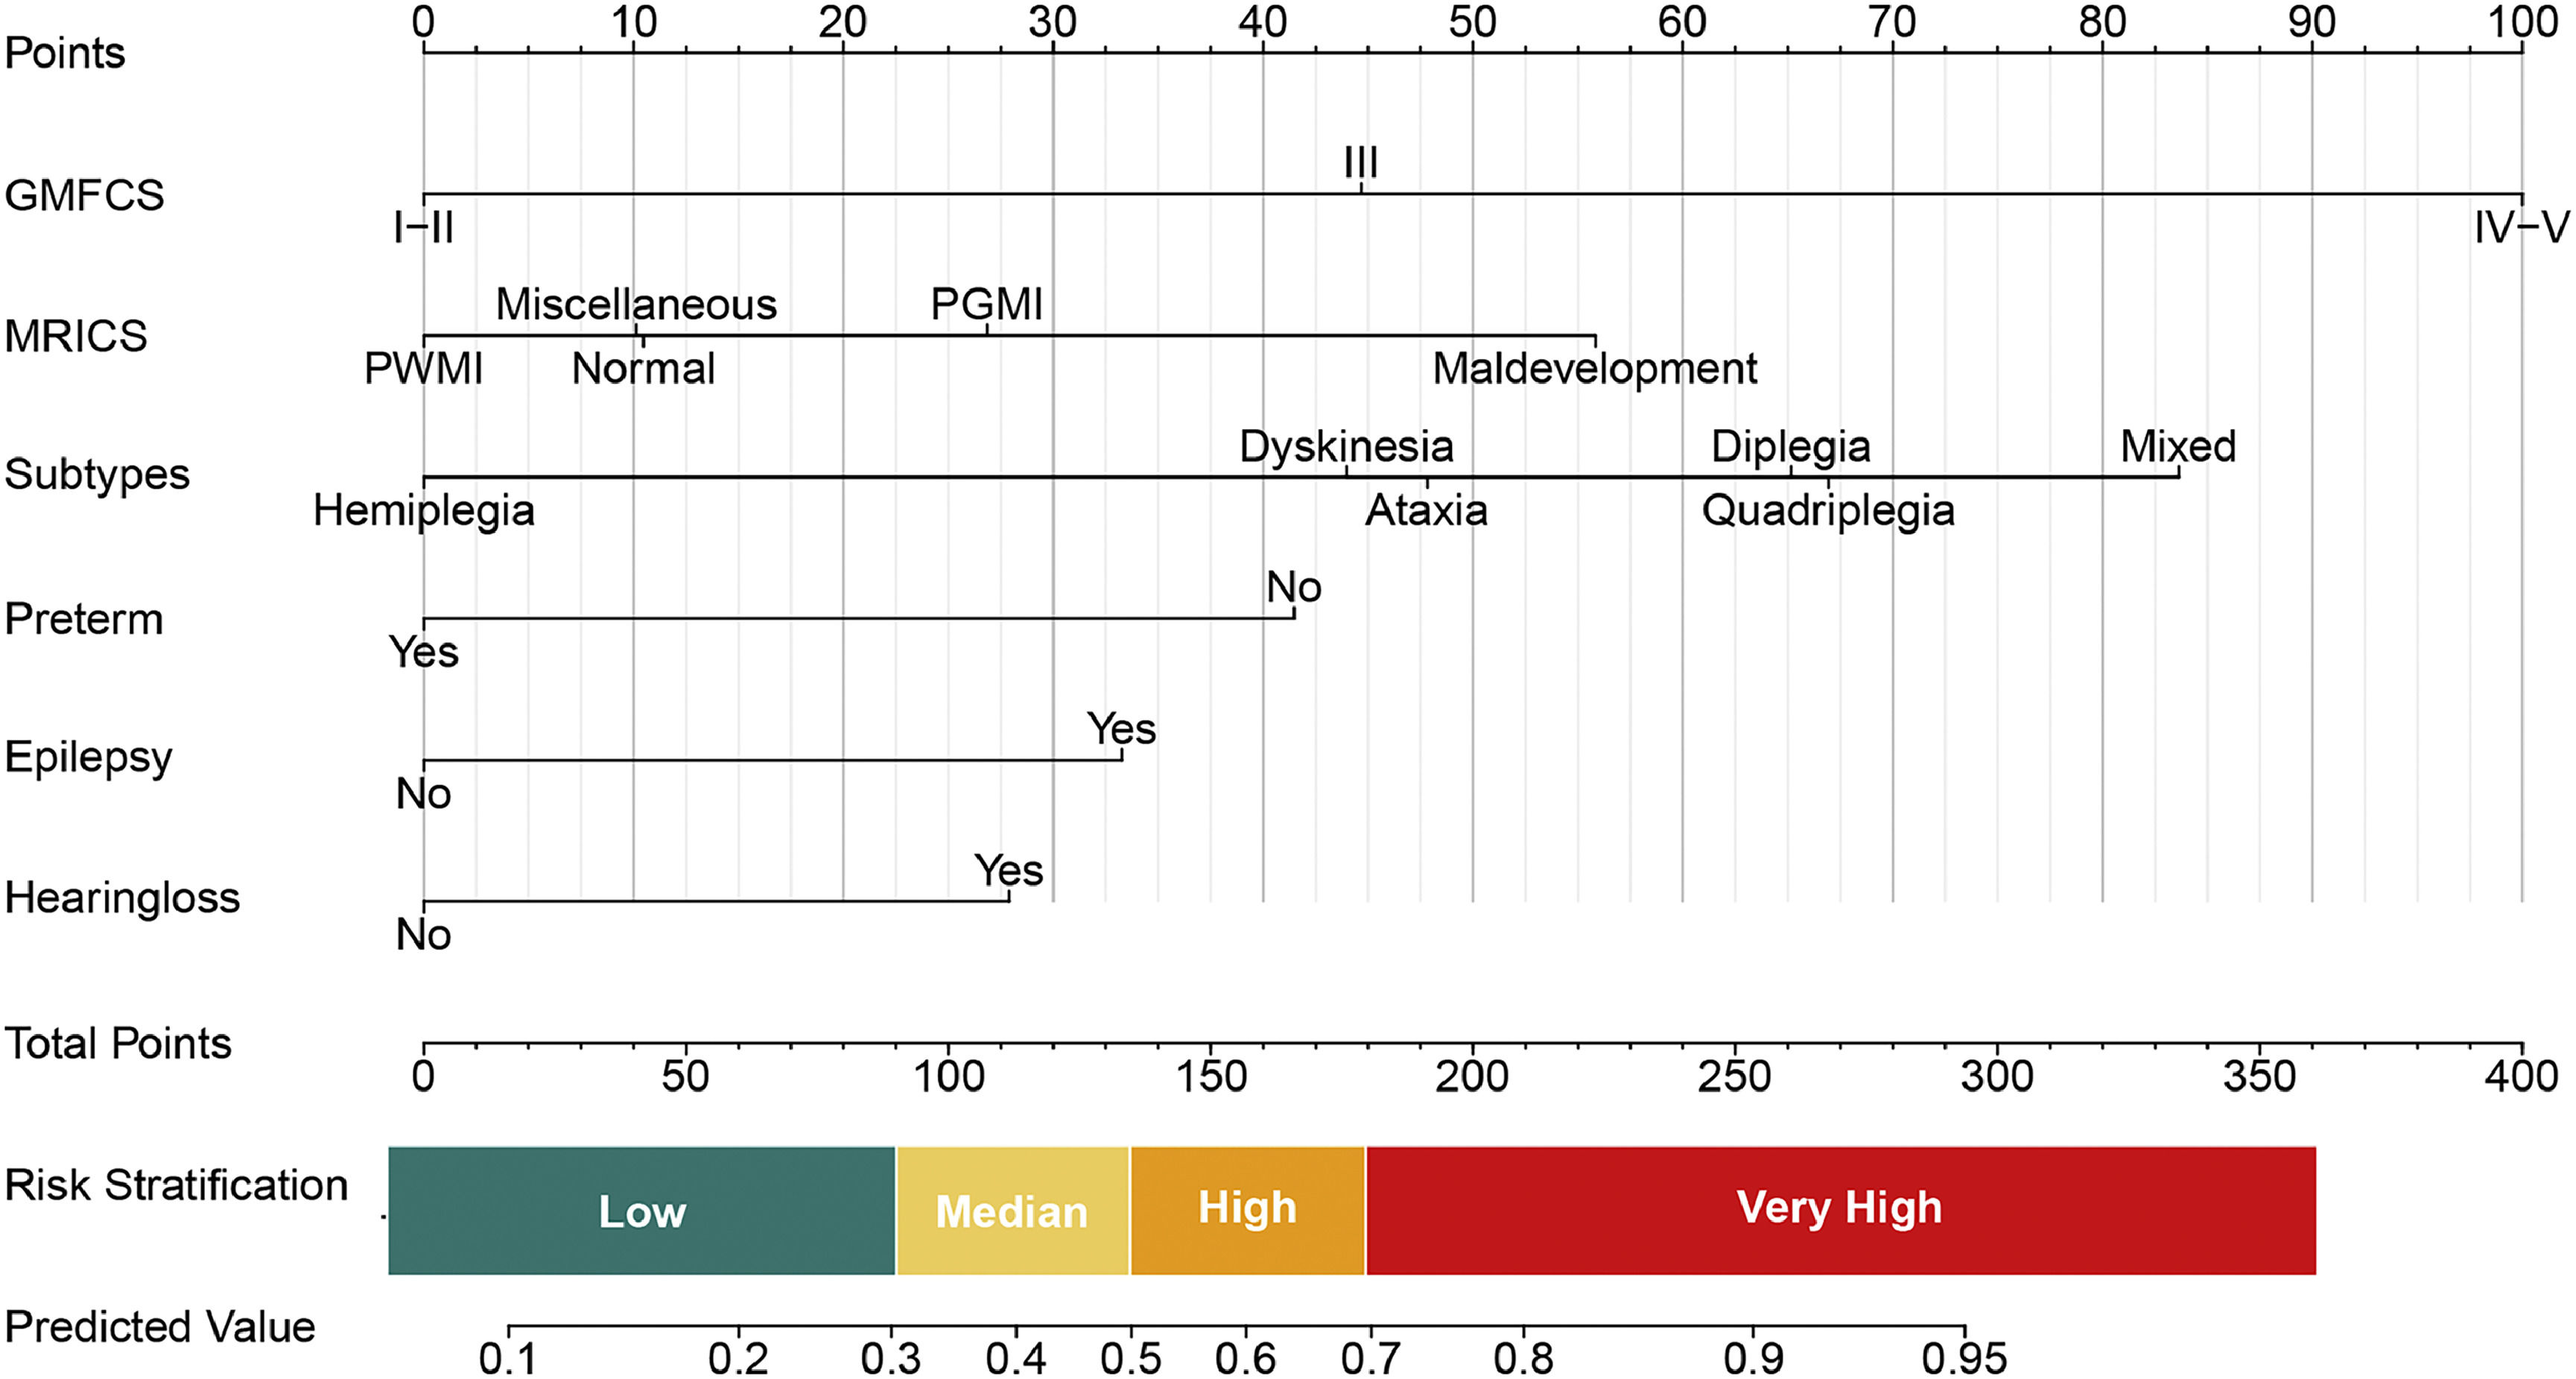
The model developed through univariable analysis and lasso regression was applied to the study participants and is depicted in a nomogram plot in Fig. 2. Each predictor's point can be determined by drawing a vertical line to the corresponding axis, and the total points are calculated by summing the points of each relevant factor in the nomogram. The model exhibited a sensitivity of 81.43% (95% CI: 77.45%-85.41%) and a specificity of 61.02% (95% CI: 56.5%-65.16%) at the threshold defined by the Youden index. Moreover, this high value of the Youden's index demonstrates the positive predictive value was 60.79%, and the negative predictive value was 81.58%.

Predictive nomogram for ID in Children with CP. The predictive nomogram was developed using the following variables: GMFCS, MRICS, CP subtypes, preterm birth, epilepsy, and hearing loss. It translates predicted probabilities into points on a scale from 0 to 100, displayed above the figure. The total points accumulated from all predictors correspond to the predicted probability of ID in children with CP.
The interpretation of the prognostic model is illustrated in Fig. 2, indicating that approximately 38.77% of children with CP are projected to be classified as low-risk, with a probability of less than 0.3. This subgroup exhibits a relative risk (RR) of 0.43 comparisons to the baseline population prevalence of 45% (Table 1 and Supplementary Table 1). Additional RR values for various predictive factors are provided in Supplementary Table 1.
Based on these calculated RRs, risk thresholds were stratified within the risk model as illustrated in Fig. 2. Various strategies are suggested based on different risk levels: individuals with predictive values ranging from 0 to 0.3 are advised to undergo follow-up concentrating on cognition and comprehensive language; those with values between 0.3 and 0.5 are recommended to receive outpatient intervention and follow-up; and individuals with values exceeding 0.5 are strongly encouraged to undergo inpatient intervention.
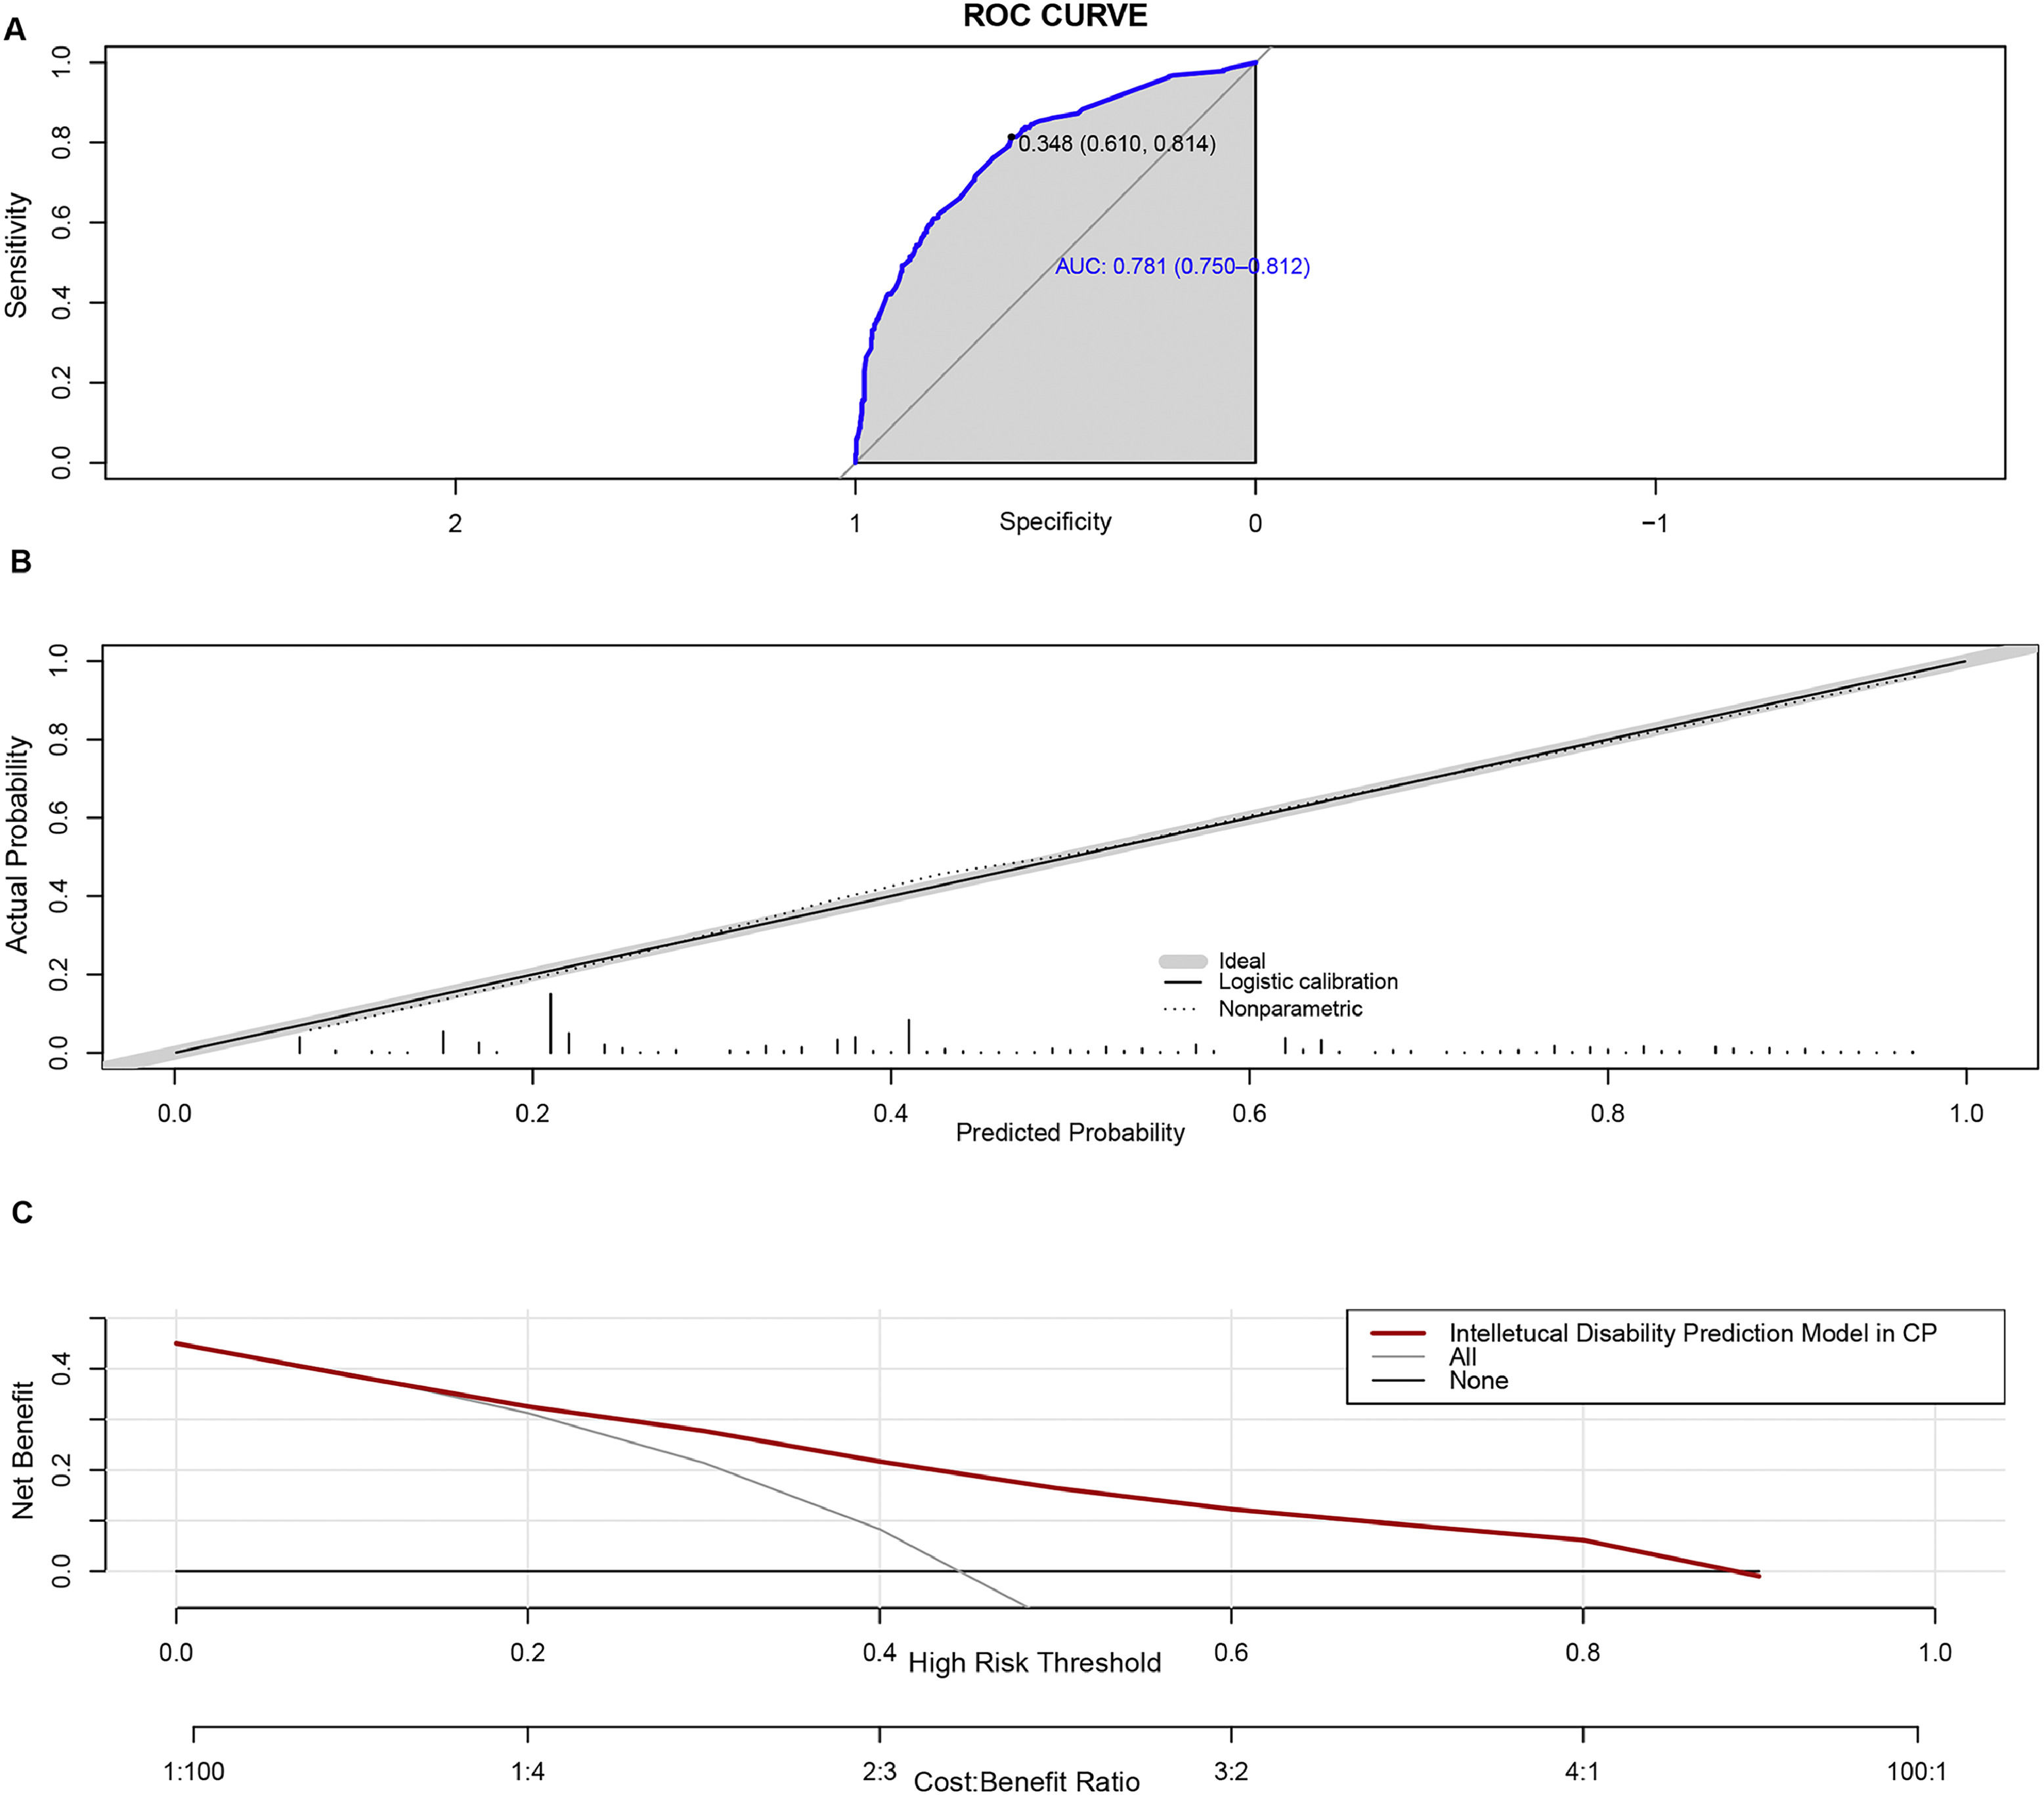
Model performanceThe AUC value of the prediction model was 0.781 (95% CI: 0.7504-0.8116). Bootstrapping validation with 1000 repetitions confirmed the AUC value to be 0.7624 (95% CI: 0.7216 - 0.8032). The Hosmer–Lemeshow test was not significant (χ2= 7.9061, p = 0.4427), indicating satisfactory calibration of the model. The ROC plot and calibration curve are shown in Fig. 3A and 3B. The mean probability of the cohort without ID was 0.3231 ± 0.1877, while the cohort with ID had a mean probability of 0.5648 ± 0.2392, demonstrating a significant difference (t = -16.248, p < 0.001).

Performance of the predictive nomogram. A. The x-axis represents specificity, and the y-axis represents sensitivity of the model. The shaded area denotes the area under the ROC curve. B. The x-axis shows the predicted risk of ID, while the y-axis shows the actual probability. The dotted line represents perfect prediction by an ideal model, and the solid line indicates the performance of the nomogram. C. Decision curve analysis. The y-axis measures the net benefit. The red line represents the risk association with the model. The label “All” indicates the assumption that all children with CP have an ID. The “None” line represents the assumption that no children with CP have ID.
DCA was employed to assess the clinical efficacy of the predictive nomogram. The decision curve depicted in Fig. 3C demonstrates that within a threshold probability range of 0.15 - 0.9, employing the model for predicting the likelihood of ID in children with CP would yield a favorable net benefit.
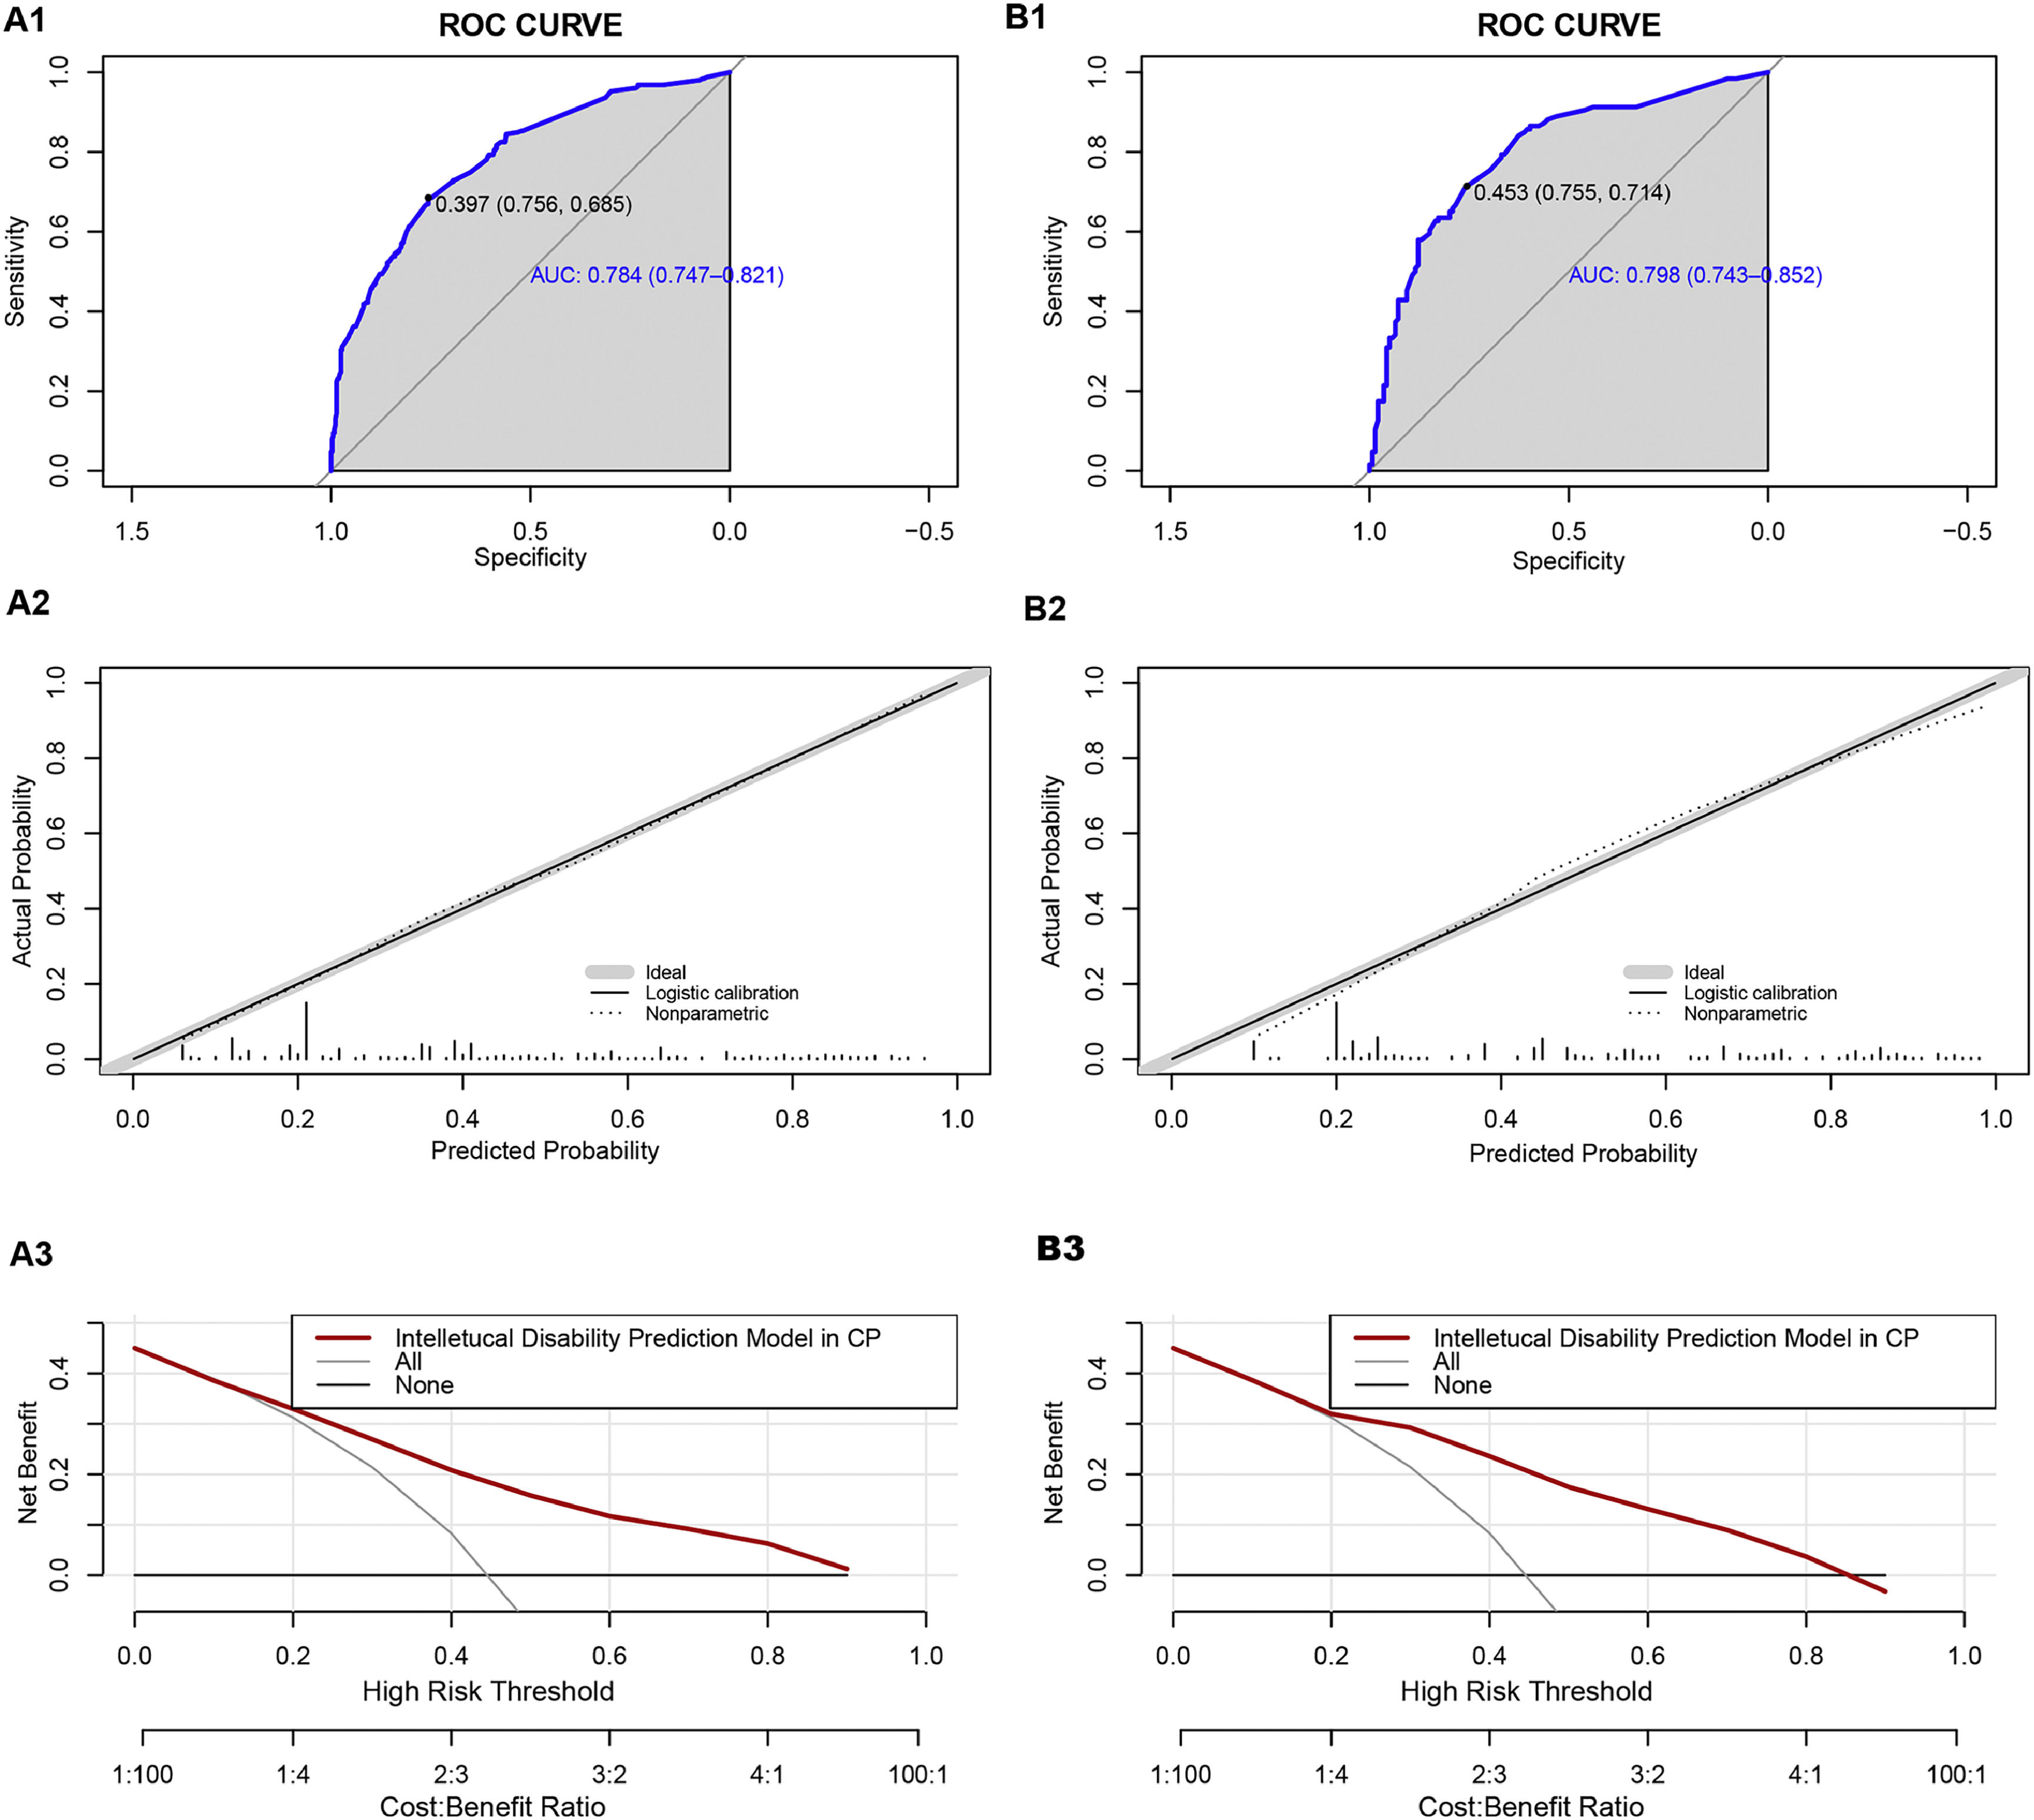
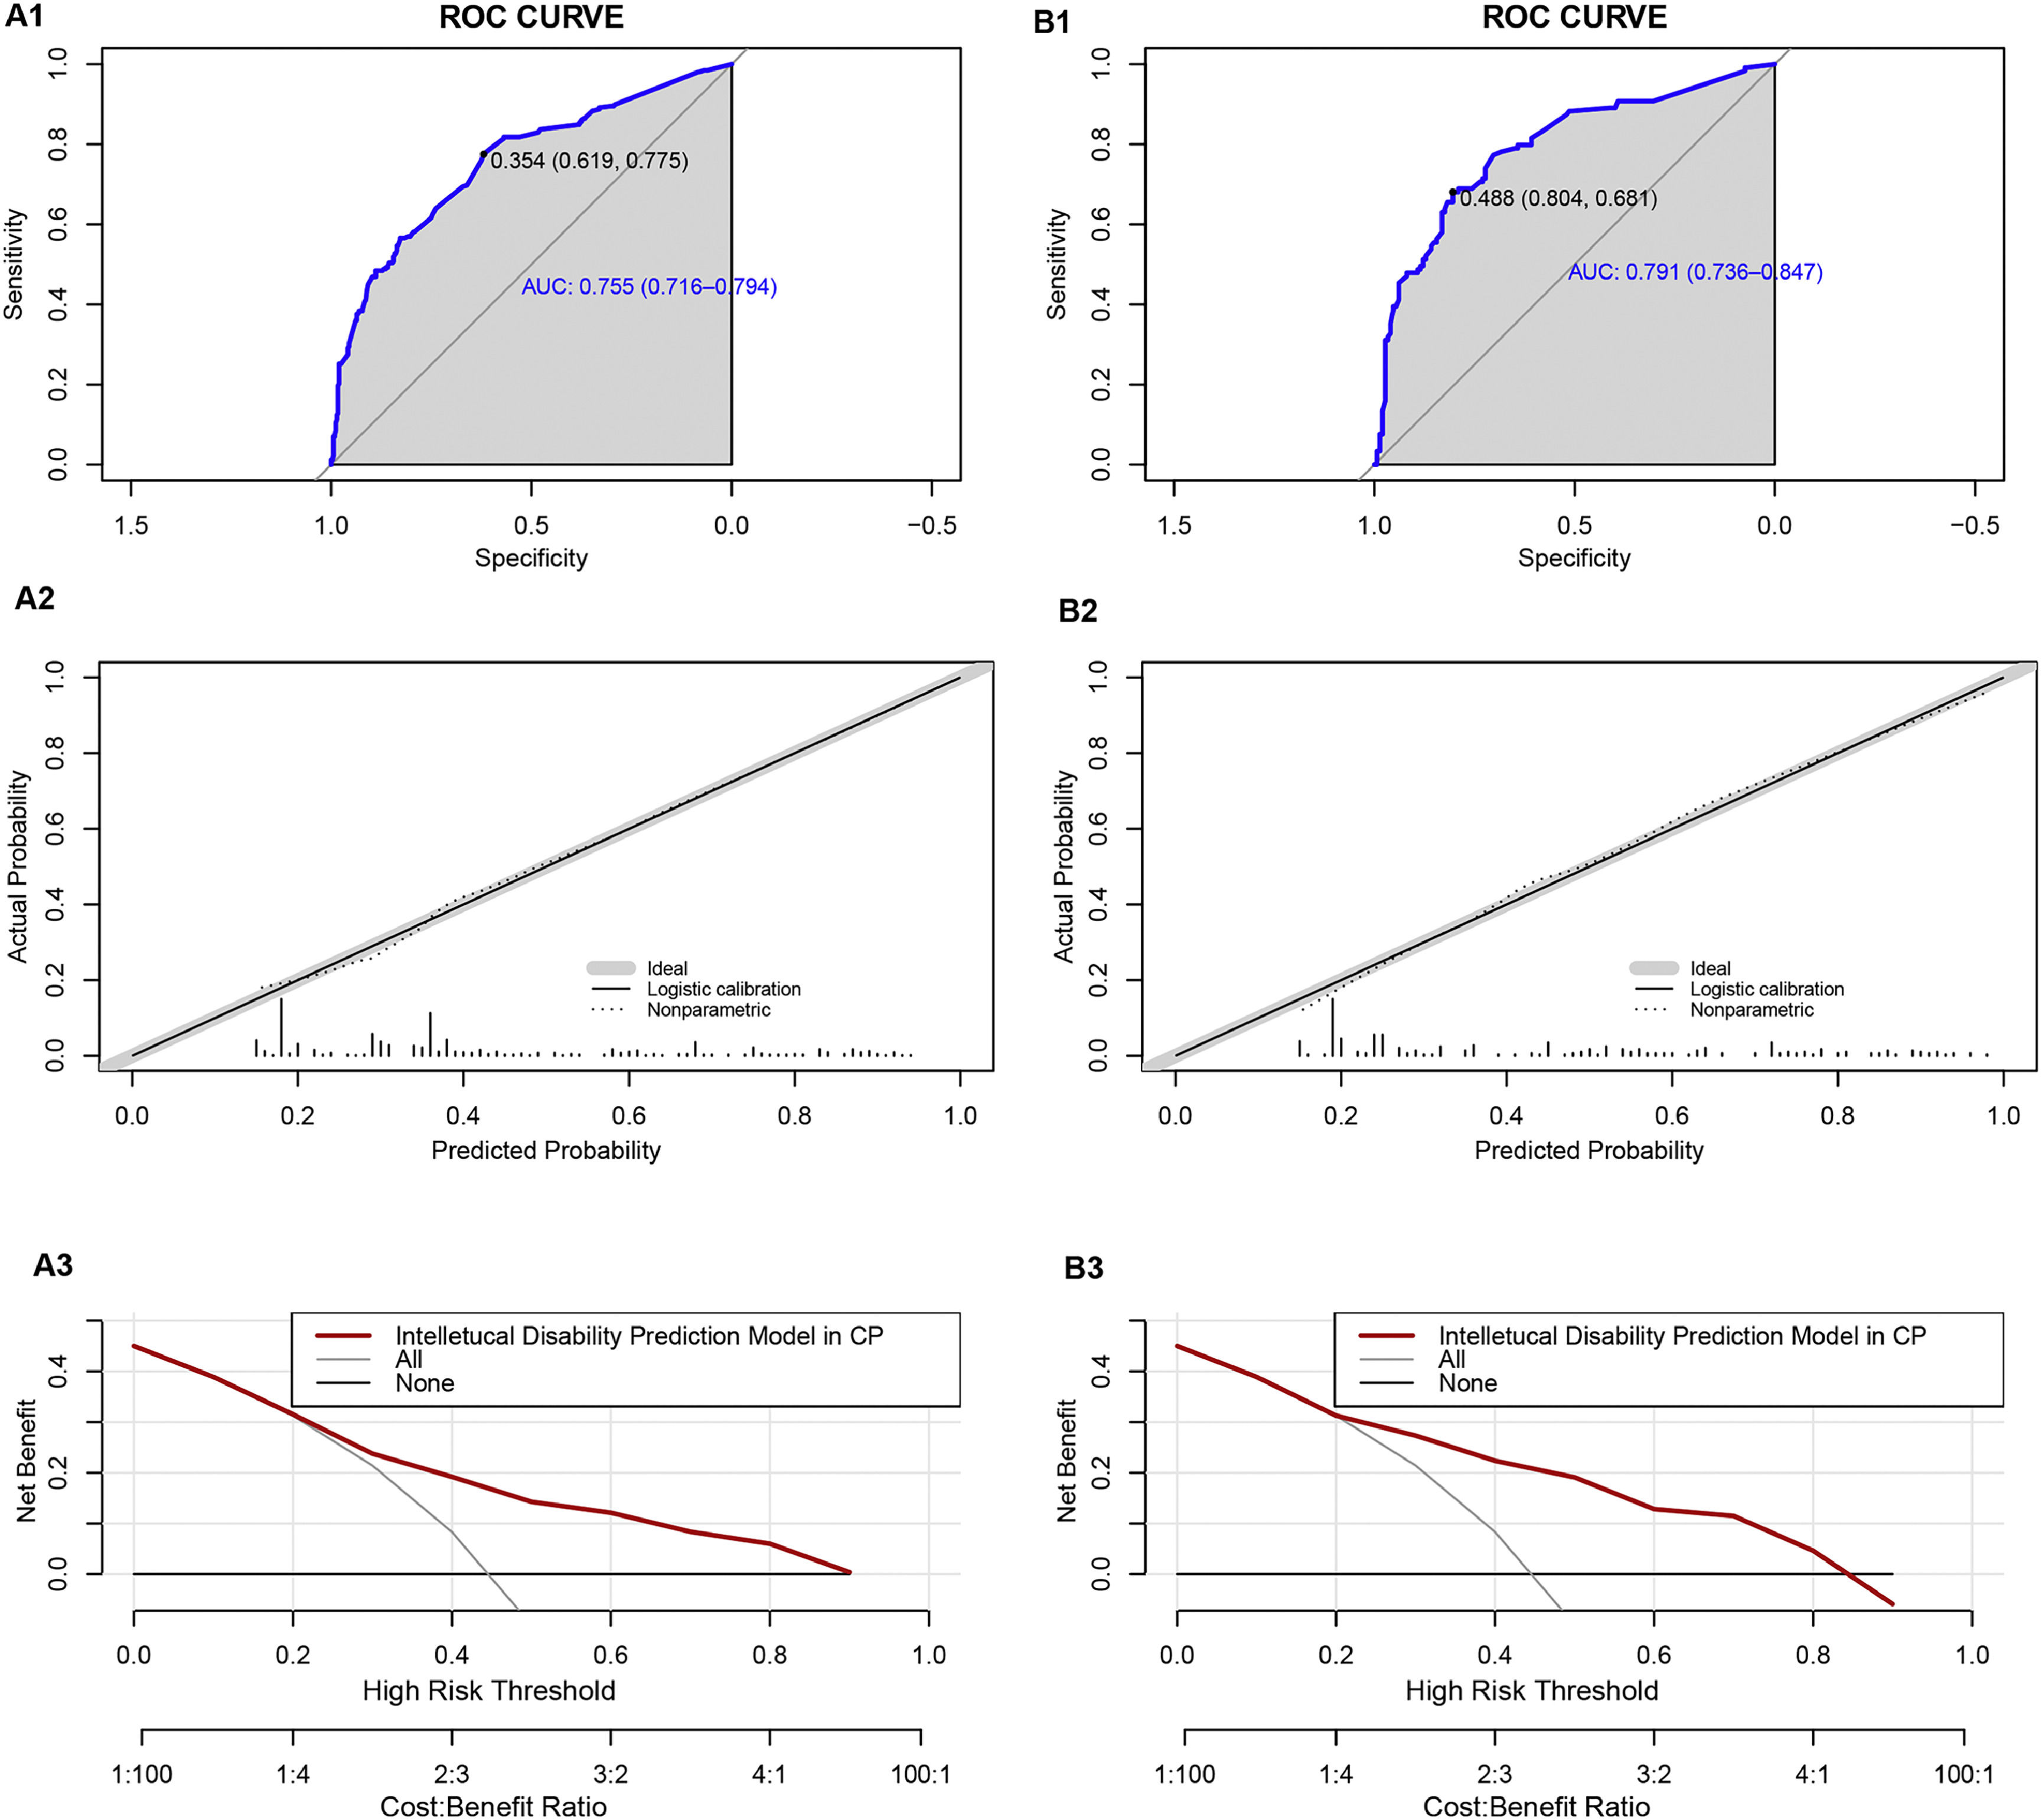
We classified all the cases into test and validation groups at a 7:3 ratio, respectively (set random seed: 20240608). The results of AUC value, calibration plot and DCA analysis from the validation group were similar to those from the test group. In the test group, the goodness-of-fit χ2 of ID in CP children was 4.8849 (p = 0.7698), and in validation group, it was 8.9001(p = 0.2599), indicating no evidence of poor fit between observation and prediction (Fig. 4A2 and Fig. 4B2). Additionally, the ROC curve revealed an AUC value of 0.784 (95% CI: 0.7474-0.8206) in test group and 0.7975 (95% CI: 0.7433-0.8518) in validation group (Fig. 4A1 and Fig. 4A2). Moreover, the prediction model demonstrated a high net benefit in predicting ID probability among CP children by DCA analysis in both the test and validation groups (Fig. 4C1 and Fig. 4C2).

Performance of the prediction model in the test and validation group. A1 ROC curve of the multivariate prediction model in the test group; A2 Calibration curve of the multivariate prediction model in the test group; A3 DCA of the model in the test group. B1 ROC curve of the multivariate prediction model in the validation group; B2 Calibration curve of the multivariate prediction model in the validation group; B3 DCA of the model in the validation group.
There were 618 male children and 267 female children in our cohort. In the male group, the goodness-of-fit χ2 of the prediction model was 7.8801 (p = 0.3433), and in the female group, it was 8.4207 (p = 0.297), indicating no evidence of poor fit between observation and prediction (Fig. 5A2 and Fig. 5B2). Additionally, the ROC curve revealed an AUC value of 0.7548 (95% CI: 0.7156-0.7941) in the male group and 0.7912 (95% CI: 0.7357-0.8468) in the female group (Fig. 5A1 and Fig. 5B1). Furthermore, the prediction model showed a high net benefit in predicting ID probability among CP children by DCA analysis in both the male and female groups (Fig. 5A3 and Fig. 5B3).

Performance of the prediction model in the male and female groups. A1 ROC curve of the multivariate prediction model in the male group; A2 Calibration curve of the multivariate prediction model in the male group; A3 DCA of the model in the male group. B1 ROC curve of the multivariate prediction model in the female group; B2 Calibration curve of the multivariate prediction model in the female group; B3 DCA of the model in the female group.
The nomogram was developed using several predictors identified through rigorous statistical methods, including preterm birth, CP subtypes, GMFCS levels, MRICS, and epilepsy. The model showed strong discrimination with an AUC of 0.781 and robust calibration, indicating it accurately predicts the likelihood of ID in children with CP. The results demonstrate the effectiveness of the nomogram in predicting ID, emphasizing its clinical utility for early intervention.
This predictive model is significant for clinicians as it allows for the early identification of children at high risk for ID. Such early identification is crucial because it enables timely interventions, leveraging the neuroplasticity in young children to improve outcomes. The model stratifies risk into four categories: low (<0.3), medium (0.3-0.5), high (0.5-0.7), and very high (>0.7), providing clear guidelines for clinical management. For example, children in the low-risk category may benefit from regular follow-ups focusing on cognitive and language development, while those in higher-risk categories may require more intensive interventions, including inpatient care (Aguayo et al., 2019; Olusanya et al., 2022).
Among the predictors, preterm birth was identified as a protective factor (OR = 0.4637, 95% CI: 0.3192-0.6703), which is counterintuitive given its general association with developmental issues. This finding aligns with other studies (Cummins et al., 2021; Dolk et al., 2006; Hemming et al., 2008; Reid et al., 2018) suggesting that term births might have underlying genetic or metabolic factors leading to CP, while preterm CP is often due to hypoxia which predominantly affects motor functions more than intellectual abilities (Back, 2017; Lear et al., 2022). Additionally, CP occurring in the late third trimester is primarily associated with cortical or deep grey matter injury (Himmelmann et al., 2017), which has a more significant impact on intellectual functioning than earlier insults (Cummins et al., 2021). This distinction underscores the complexity of CP and the multifactorial nature of its comorbidities (Vandenbosche & Kirchner, 1998). Furthermore, a less mature fetal brain may be better able to recover from early damage, compared to a term infant's brain (Hemming et al., 2008; O'Shea, 2008).
The severity of motor impairment, as measured by GMFCS levels, showed a strong correlation with the likelihood of ID (GMFCS III versus GMFCS I-II: OR = 2.2883; GMFCS IV-V versus GMFCS I-II: OR = 6.377), consistent with previous research (Bertoncelli et al., 2019; Reid et al., 2018). This highlights the importance of GMFCS as a critical tool not only for assessing motor function (Palisano et al., 1997), but also for predicting intellectual outcomes (Bertoncelli et al., 2019). A study recruited 148 children aged 5–10 years with IQ ranging from 50 to 69 and 300 children without intellectual limitations aged 5–10 years to explore predictive items from 75 milestones of the Dutch Developmental Instrument (Vlasblom et al., 2019). This study identified 10 milestones that could predict intelligence function, further demonstrating that motor function can influence cognition.
Regarding CP subtypes, mixed, quadriplegia, diplegia and dyskinesia all had higher probability of comorbidities with ID than hemiplegia, and the mixed had the highest probability (OR = 4.7096). A previous study reported that bilateral spastic CP (including diplegia and quadriplegia) had a 3.23 times higher likelihood of comorbidities ID than unilateral spastic CP (Cummins et al., 2021). A cross-sectional, observational study based on dyskinesia CP reported that 47.7% of children with dyskinesia CP had global delay (Saini et al., 2021), and a review reported that 50% to 60% of children with dyskinesia CP have an IQ less than 70(Stadskleiv, 2020).
Similarly, the presence of epilepsy were associated with higher risk of ID (OR: 1.8524, p<0.001), consistent with previous predictive models for severe ID in teenagers with CP (Bertoncelli et al., 2019). In the prediction model for epilepsy in CP children, a relevant association (OR: 2.698, p = 0.006) between epilepsy and profound ID was found (Bertoncelli et al., 2022).
Except for preterm birth, other predictors selected were all clinical features (GMFCS, MRICS and CP subtypes) or comorbidity (epilepsy). Etiology and high risks were not considered as important predictor for ID in CP children, similar to previous study (Levy-Zaks et al., 2014), underscoring the need to consider these clinical features in the management and prognosis of CP (Aguayo et al., 2019; Cummins et al., 2021; Olusanya et al., 2022).
A major strength of this study is the large sample size, which enhances the reliability and generalizability of the findings. Additionally, the use of rigorous statistical methods, including LASSO regression and bootstrapping validation, ensures the robustness of the model (Collins et al., 2015; van Straalen et al., 2021). The comprehensive inclusion of various potential risk factors—from maternal and prenatal factors to clinical features and comorbidities-adds depth to the predictive power of the model. However, the study has limitations. Firstly, this study is based on hospital data, which may not be entirely representative of the general population; Secondly, children with hypotonia subtype CP were excluded from our study based on the recruit criteria, which might affect the observed prevalence of ID in our CP cohort; Thirdly, we didn't conduct external validation. Additionally, some data were obtained from parental reports, which may introduce recall bias. Future study should consider a population-based approach to further validate the findings.
The study underscores the need for routine follow-up and early intervention in children identified at high risk of ID. Future research should aim to refine the predictive model further and explore the underlying mechanisms linking these predictors to ID. Additionally, expanding the study to diverse populations can enhance the model's applicability and effectiveness. Investigating the genetic and metabolic factors associated with term births leading to CP could provide deeper insights into the etiology of ID in these cases (Bertoncelli et al., 2019; Huang et al., 2016; Wang et al., 2024).
CRediT authorship contribution statementJunying Yuan: Conceptualization, Data curation, Investigation, Formal analysis, Investigation, Methodology, Writing – original draft. Gailing Wang: Data curation, Investigation. Mengyue Li: Data curation, Validation, Investigation. Lingling Zhang: Conceptualization. Longyuan He: Data curation, Validation, Investigation. Yiran Xu: Conceptualization, Resources, Data curation, Investigation, Validation, Supervision. Dengna Zhu: Data curation, Validation, Investigation, Resources, Data curation, Investigation, Validation, Supervision. Zhen Yang: Data curation, Validation, Investigation. Wending Xin: Data curation, Validation, Investigation. Erliang Sun: Data curation, Validation, Investigation. Wei Zhang: Data curation, Validation, Investigation. Li Li: Data curation, Validation, Investigation. Xiaoli Zhang: Data curation, Validation, Investigation. Changlian Zhu: Conceptualization, Writing – review & editing, Funding acquisition.
