


There is evidence that complex relationships exist between motor functions, brain structure, and cognitive functions, particularly in the aging population. However, whether such relationships observed in older adults could extend to other age groups (e.g., younger adults) remains to be elucidated. Thus, the current study addressed this gap in the literature by investigating potential associations between motor functions, brain structure, and cognitive functions in a large cohort of young adults
MethodsIn the current study, data from 910 participants (22–35 yr) were retrieved from the Human Connectome Project. Interactions between motor functions (i.e., cardiorespiratory fitness, gait speed, hand dexterity, and handgrip strength), brain structure (i.e., cortical thickness, surface area, and subcortical volumes), and cognitive functions were examined using linear mixed-effects models and mediation analyses. The performance of different machine-learning classifiers to discriminate young adults at three different levels (related to each motor function) was compared
ResultsCardiorespiratory fitness and hand dexterity were positively associated with fluid and crystallized intelligence in young adults, whereas gait speed and handgrip strength were correlated with specific measures of fluid intelligence (e.g., inhibitory control, flexibility, sustained attention, and spatial orientation; false discovery rate [FDR] corrected, p < 0.05). The relationships between cardiorespiratory fitness and domains of cognitive function were mediated by surface area and cortical volume in regions involved in the default mode, sensorimotor, and limbic networks (FDR corrected, p < 0.05). Associations between handgrip strength and fluid intelligence were mediated by surface area and volume in regions involved in the salience and limbic networks (FDR corrected, p < 0.05). Four machine-learning classifiers with feature importance ranking were built to discriminate young adults with different levels of cardiorespiratory fitness (random forest), gait speed, hand dexterity (support vector machine with the radial kernel), and handgrip strength (artificial neural network)
ConclusionsIn summary, similar to observations in older adults, the current study provides empirical evidence (i) that motor functions in young adults are positively related to specific measures of cognitive functions, and (ii) that such relationships are at least partially mediated by distinct brain structures. Furthermore, our analyses suggest that machine-learning classifier has a promising potential to be used as a classification tool and decision support for identifying populations with below-average motor and cognitive functions.
It is well documented that general intelligence, which comprises fluid and crystallized intelligence, is of considerable importance for cognitive development throughout the lifespan (Cunningham et al., 1975). Fluid intelligence, which is the ability to recognize complex relationships and make inferences based on understanding, increases from infancy and peaks in young adulthood (Craik & Bialystok, 2006). In contrast, crystallized intelligence, representing experience, understanding, and judgment, typically accumulates slowly throughout adulthood after a substantial increase in childhood (Craik & Bialystok, 2006). According to Schaie's theory of cognitive stages (Schaie, 1978), young adulthood is the “achieving stage” in which individuals apply their intelligence and accumulated knowledge to achieve specific personal goals (e.g., establishing a career). Indeed, several lines of evidence support the view that well-developed cognitive functions in young adulthood are critical for a successful life. For example, cognitive function in young adulthood has been identified as a significant determinant of income, social benefits, and life satisfaction (An et al., 2023; Kavaliunas et al., 2019), as a predictor of many forms of academic and career success (Duckworth et al., 2019), and also as a nexus of clinical significance in mental disorders (e.g., bipolar disorder, schizophrenia, major depressive disorder, and posttraumatic stress disorder) (Son et al., 2023). However, with the increasing prevalence of factors such as insufficient sleep (Cheval et al., 2022), obesity (Cook et al., 2017), substance and internet addiction (Latvala et al., 2009), and sedentary lifestyles (Thorp et al., 2011), which have been associated with poorer cognitive performance, younger adults may not be able to fully reach and develop their peak cognitive functions. This limitation may, in turn, have a negative impact on their later life trajectories.
In particular, motor functions, including cardiorespiratory fitness, locomotion (e.g., gait speed), hand dexterity, and handgrip strength, have been associated with several cognitive domains, including executive function and aspects of memory (Åberg et al., 2009; Looser et al., 2023; Reis et al., 2013; Wu et al., 2022). For example, previous studies have shown that higher cardiorespiratory fitness in young adulthood is associated with better psychomotor speed (Reis et al., 2013), inhibitory control (Wu et al., 2022), working and verbal memory (Looser et al., 2023; Reis et al., 2013), and intelligence (Åberg et al., 2009). Additionally, maintaining or increasing higher levels of cardiorespiratory fitness has also been linked to better cognitive functions in later life (Reis et al., 2013). Moreover, the complex relationships between motor and cognitive functions are supported by different brain structures (Liu et al., 2022; Whiteman et al., 2016) that can be quantified by a variety of approaches, including cortical thickness, surface area, and subcortical volume (estimated from magnetic resonance imaging [MRI] of the human brain) (Gogtay et al., 2004; Shaw et al., 2008). Specifically, higher cardiorespiratory fitness was associated with increased midfrontal (Liu et al., 2022), hippocampal (Aghjayan, Jakicic et al., 2021), and entorhinal (Whiteman et al., 2016) volumes and increased parietal surface area (Wade et al., 2020) in younger adults. Furthermore, midfrontal volume was observed to mediate the positive association between cardiorespiratory fitness and executive function (Liu et al., 2022), whereas entorhinal and hippocampal volumes mediated the positive association between cardiorespiratory fitness and memory (Nauer et al., 2020; Whiteman et al., 2016). Although a considerable amount of knowledge has been accumulated on the complex relationships between domains of motor function, brain structure, and cognitive function in recent years (for review, see (Aghjayan, Lesnovskaya et al., 2021; Chen et al., 2020; Stillman et al., 2020; Yu et al., 2021)), some research gaps remain because (i) available studies have mainly focused on older adults (Dunås et al., 2021; Lisanne F Ten Brinke et al., 2015; Raz & Rodrigue, 2006), and (ii) studies in younger adults have often focused on a single measure of motor function (e.g., cardiorespiratory fitness) (Hendrikse et al., 2022), a specific brain structure (e.g., hippocampal volume) (Hendrikse et al., 2022), or a measure of specific cognitive function (e.g., executive function) (Liu et al., 2022). Thus, future research is needed to broaden our knowledge of whether the positive associations between different measures of motor function, brain structure, and cognitive functions being observed in older adults also extend to younger adults (Stillman et al., 2020).
Notably, age-related declines in motor functions (e.g., slow gait speed) often precede cognitive decline by several years in older adults (Allali et al., 2016; Rongtao Jiang et al., 2022; Savica et al., 2017). Although these observations cannot be readily extrapolated to younger adults, recognizing younger individuals at risk of poor motor function and cognitive status may help screen and identify younger adults whose cognitive function would benefit the most from improving motor and physical fitness through regular physical activity and physical exercise interventions. In addition, MRI-based measures of brain structure have been widely used as an important screening tool to investigate the neural correlates of motor and cognitive dysfunction and identify individuals suffering from the former.
Additionally, supervised machine-learning algorithms have recently been accepted to carry out individual-level classification in medical imaging as they can automatically learn features without being limited by data structure and improve the classification power by targeting multivariate group differences distributed across the brain Badillo et al. (2020); Uddin et al. (2019). Among all the machine-learning classifiers, random forests, kernel support vector machines [SVM], and artificial neural networks are the three most popular classifiers with a wide range of applications and favorable performance (Kotsiantis et al., 2007). Thus, the machine-learning classifiers can help to screen and differentiate individuals at different levels of motor functions based on MRI and demographic data, allowing for the prediction of cognitive status. The Human Connectome Project (HCP) consortium (see data source and participants section) classified participants into three groups (below, at, and above the national average) according to their performance on motor function assessment (Won et al., 2021), allowing for further feature learning and modeling of the brain structures of younger adults with different levels of motor function.
In this study, we hypothesized that specific subdomains of motor function would be associated with cognitive function and distinct structural brain signatures. Based on findings from previous studies (Liu et al., 2022; Nauer et al., 2020; Whiteman et al., 2016), we further postulated that brain structure may mediate the associations between motor and cognitive functions. To empirically test our hypotheses, in the first step we analyzed potential associations between motor functions with measures of cognitive functioning and brain structure. In the second step, we examined whether measures of brain structure might mediate the associations between motor and cognitive functions. Finally, we compared three common machine-learning classifiers (i.e., random forests, SVM, and artificial neural networks) based on imaging and demographic data for each motor function to recommend the classifier with the best performance. Taken together, our study aims to elucidate in younger adults the complex associations between motor function, brain structure, and cognitive function potentially contributing to a deeper understanding of these intertwined measures.
MethodsData source and participantsThe HCP consortium is dedicated to mapping the neural pathways underlying brain structure and function and related behaviors (Van Essen et al., 2013). The WU-Minn HCP 1200 Subjects Data Release (S1200 Release, February 2017) shared behavioral, demographic, and 3-Tesla MRI data from 1206 healthy young adult participants (https://www.humanconnectome.org/study/hcp-young-adult) (Van Essen et al., 2013). The current study used cross-sectional behavioral, demographic, and structural MRI data from 1113 participants (22- 35 years) from the S1200 Release (Van Essen et al., 2013). All participants underwent structural MRI scans on a customized 3T scanner at Washington University. Exclusion criteria (Van Essen et al., 2013) are detailed in Appendix A. This study included only right-handed adults because handedness is strongly associated with measures of brain structure and cognitive functions (Forrester et al., 2013; Michel et al., 2013; Sha et al., 2021). The final sample used in the present study consisted of 910 participants. The Institutional Review Board at Washington University in St. Louis approved this study. Written and verbal informed consent was obtained from each participant by HCP investigators.
Outcomes of interest are motor functions, cognitive measures, and brain structure (detailed in the measurements section below and Appendix B-D). Participants’ age, sex (male/female), race (white, Black/African American, American Indian/Alaska Native, or Asian/native Hawaiian/other Pacific Islander populations), ethnicity (Hispanic/Latino or not), and years of education were self-reported. Annual household income was categorized into eight groups: (1) <$10,000, (2) $10,000–19,999, (3) $20,000–29,999, (4) $30,000–39,999, (5) $40,000–49,999, (6) $50,000–74,999, (7) $75,000–99,999, and (8) ≥$100,000. Individuals' height and weight were measured on the day of the first visit, and body mass index (BMI) was calculated as weight divided by height squared (kg/m2).
Structural brain imagingStructural MRI scans were obtained on a customized Siemens 3T Skyra system (32-channel head coil). HCP structural (preFreeSurfer, FreeSurfer, and postFreeSurfer) pipelines were described in a previous study (Glasser et al., 2013). The following imaging parameters were used: field of view = 224 mm, matrix = 320, 256 sagittal slices per single slab, inversion time = 1000 ms, repetition time = 2400 ms, echo time = 2.14 ms, flip angle = 8°, slice thickness = 0.7 mm, bandwidth = 210 Hz per pixel, and echo spacing = 7.6 ms (Glasser et al., 2013). Image analysis was performed using Freesurfer v.5.2.0 software (https://surfer.nmr.mgh.harvard.edu/), including correction and conform (orig. mgz; volumes in 1mm3, 2563 space), non-uniform intensity normalization (T1.mgz), Talairach transform calculation (MNI305 template), skull strip (brain. mgz), white matter segmentation (wm. mgz), gray matter and white matter boundary tessellation (h.orig), automatic topology correction (h.orig), and surface deformation (Glasser et al., 2013). A 10 mm (full width at half maximum) Gaussian kernel was used to smooth the maps. Based on the Desikan-Killiany atlas, FreeSurfer parcellated the cortex into 34 regions of interest per hemisphere and calculated the cortical thickness (in mm) and surface area (in mm2) of each parcellation (Appendix C). FreeSurfer also calculated the subcortical volumes of the thalamus, caudate nucleus, putamen, pallidum, hippocampus, amygdala, and accumbens (Appendix C).
Technicians assessed the quality of the structural scans based on visual inspection of tissue contrast, spatial blurriness, motion, artifacts, and accuracy of defacing and rated each scan using a 4-point scale (1 = poor; 2 = fair; 3 = good; 4 = excellent) (Marcus et al., 2013). At least one T1w scan and one T2w scan rated “good” or higher were required per session. Otherwise, the investigator scheduled another imaging session for that participant (Marcus et al., 2013).
Measures of motor functionFour widely used motor functions were measured using the NIH Toolbox, and the age-adjusted scores were used (Gershon et al., 2013; Reuben et al., 2013). Cardiorespiratory fitness, locomotion (gait speed), hand dexterity, and maximal handgrip strength were assessed separately using the NIH Toolbox 2-Minute Walk Endurance Test, the NIH Toolbox 4-Meter Walk Gait Speed Test, the NIH Toolbox 9-Hole Pegboard Dexterity Test, and the NIH Toolbox Grip Strength Test. More details on motor function assessments are provided in Appendix D.
Measures of cognitive functionFor cognitive functions, cognitive flexibility (a measure of executive function) was assessed by the Dimensional Change Card Sort Test in the NIH Toolbox, inhibitory control (a measure of executive function) using the NIH Toolbox Flanker Inhibitory Control and Attention Test, working memory (a measure of executive function) using the NIH Toolbox List Sorting Working Memory Test, picture sequence memory (a measure of episodic memory) using the NIH Toolbox Picture Sequence Memory Test, verbal episodic memory using the Penn Word Memory Test, sustained attention using the Short Penn Continuous Performance Test, processing speed using the NIH Toolbox Pattern Comparison Processing Speed Test, spatial orientation using the Variable Short Penn Line Orientation Test, impulsivity (a measure of self-regulation) using the delay discounting task, reading decoding (a measure of language) using the NIH Toolbox Oral Reading Recognition Test, and vocabulary comprehension (a measure of language) using the NIH Toolbox Picture Vocabulary Test (Gershon et al., 2013; Weintraub et al., 2013). All the scores were age-adjusted.
Fluid intelligence was calculated by averaging and redistributing normalized scores of Flanker, Dimensional Change Card Sort, Picture Sequence Memory, List Sorting, and Pattern Comparison Tests (Appendix B). Crystallized intelligence was calculated by averaging and redistributing normalized Picture Vocabulary and Reading Test scores (Appendix B). The cognitive function composite score was derived by averaging and redistributing normalized scores of measures related to fluid and crystallized intelligence. More details of cognitive function assessments are available in Appendix D. Participants completed all cognitive tasks in two sessions on different days: one for NIH Toolbox measures and the other for measures not included in the NIH Toolbox (Van Essen et al., 2013). During each visit, the order of these assessments varied based on scheduling considerations (Van Essen et al., 2013).
Statistical analysisAssociation analysisThe linear mixed-effects model (LMM) was used to examine the associations of motor functions with brain structure and cognitive measures. As explained by previous studies (Bauer et al., 2020; Cheng et al., 2021; Dick et al., 2019; Paulus et al., 2019), LMM accounted for genetic relatedness within the family structure. In the LMM, sex, race, ethnicity, household income, years of education, and BMI were used as covariates. Moreover, to test whether the findings related to brain structures were regionally specific, we used intracranial volume as a covariate, a normalization procedure in the brain structure analyses (Hibar et al., 2018; R. Jiang et al., 2022). Brain structure and cognitive measures were modeled as the dependent variables, and the motor functions and the nuisance covariates were modeled as fixed effects. Family structures were modeled as random effects. Associations between brain structure and cognitive measures were then also examined with LMM.
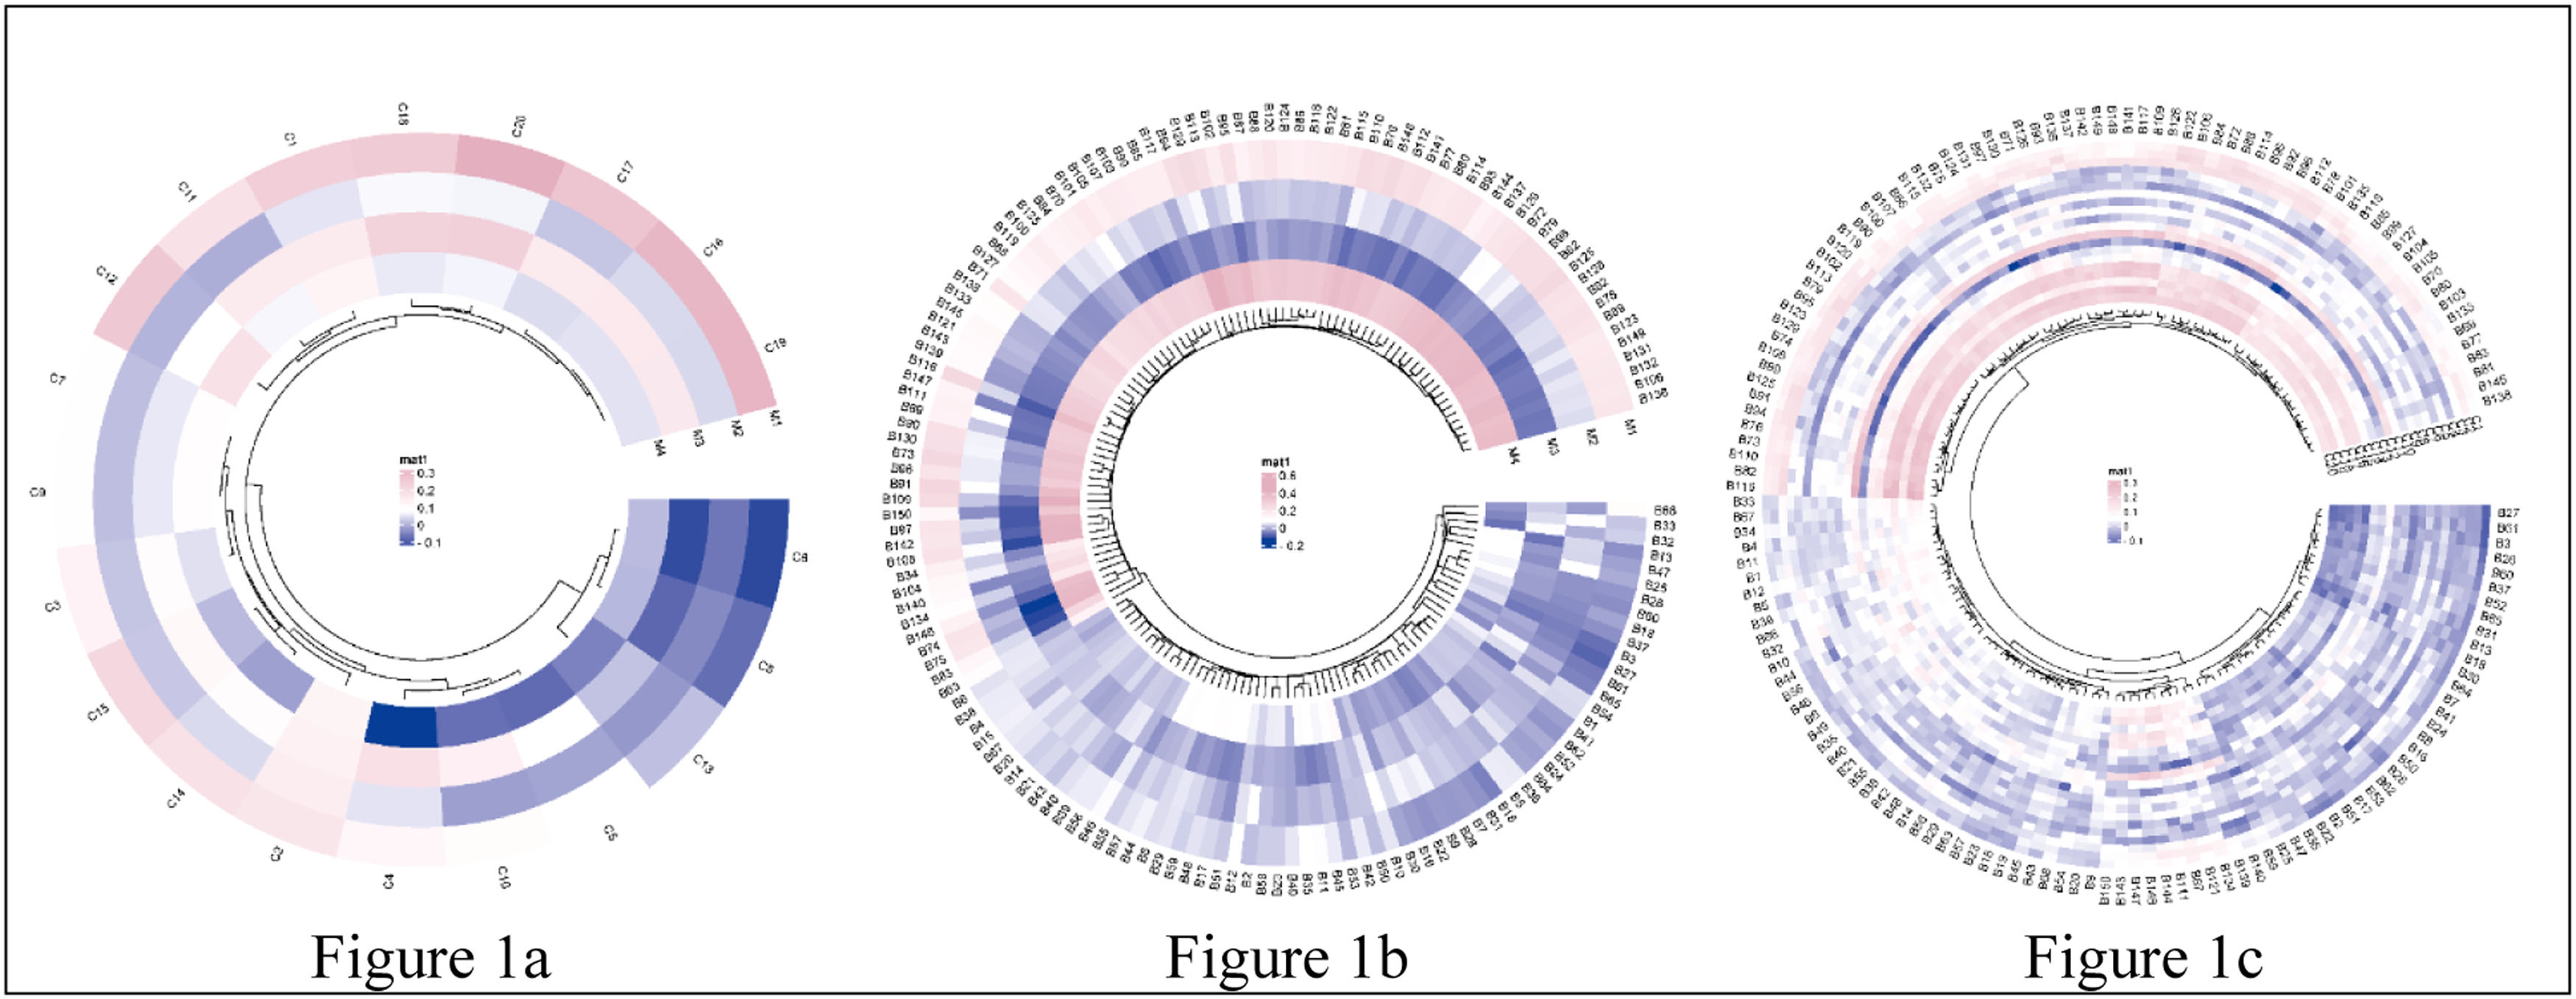
Before building the LMM model, the correlations between motor functions, brain structure, and cognitive functions were explored by partial correlation analysis, as shown in Fig. 1. Skewed data were transformed by the Box-Cox procedure (Box & Cox, 1964), which automatically identified the appropriate exponent (the parameter lambda) in power transformation (Appendix E). The false discovery rate (FDR) was used to control the rate of type I errors in multiple comparisons, with the threshold for significance set at a corrected p-value of < 0.05. Permutation tests with 5000 random samplings were performed to confirm the associations (Lee & Braun, 2012). LMM was applied using the lmerTest (Kuznetsova et al., 2017) and tidyverse (Wickham et al., 2019) packages of the statistical programming language R (version 4.1.3).
.")
Correlation heatmap of motor functions, brain morphometrics, and cognition.
Note. Fig. 1a, the correlation between 4 motor functions and 20 cognitive measures; Fig. 1b, the correlation between 4 motor functions and 150 brain structure measures; Fig. 1c, the correlation between 20 cognitive measures and 150 brain structure measures. The mat color bar represented the correlation coefficient, with the pink and the purple indicating a positive and negative correlation, respectively. Abbreviations, more details in Appendix B & C.).
Mediation analysis was performed to confirm the mediating role of brain structure measures on the relationship between motor and cognitive functions (covariance between two variables explained by the mediator). Please note that a mediation analysis was conducted only when the two following “classical” prerequisites of mediation were fulfilled: (1) a statistically significant association between the independent variable (i.e., motor functions) and the mediator (i.e., a measure of brain structure); and (2) a statistically significant association between the mediator (i.e., a measure of brain structure) and the dependent variable (i.e., cognitive functions) (Baron & Kenny, 1986). A voxel-based mediation analysis was performed using the Mediation Toolbox (Tor Wager's group; https://github.com/canlab/MediationToolbox), widely used in neuroimaging research. Confounding variables mentioned in the association analysis and intracranial volume were included as regressors in the mediation model. Bootstrap-based significance testing with 10,000 random samplings was used for statistical mediation analysis. Consistent with established recommendations, a statistically significant mediation effect was assumed when the bias-corrected bootstrap confidence limits in indirect effects did not include zero (Hayes, 2009; Hayes & Rockwood, 2017). The FDR approach was used to control the rate of type I errors in multiple comparisons across mediation models, with significance determined by a corrected p-value of < 0.05.
Machine learning algorithms in distinguishing samples at different levels of each motor functionFor each motor function, we divided the participants into three groups (below the national average [score below 85 or performance 1 SD below the national average], at the national average [score between 85 and 115 or performance within 1 SD of the national average], and above the national average [score above 115 or performance 1 SD above the national average]) according to normalized scores converted by an age-appropriate band of the NIH Toolbox Norming Sample (Won et al., 2021). Behavioral and brain structural measures were compared between groups at different levels of motor function using a one-way analysis of variance (ANOVA) or the Kruskal–Wallis test. A two-tailed p-value <0.05 was considered statistically significant. Multiple comparisons were corrected using the FDR approach, applying a threshold of corrected p < 0.05 (Benjamini & Hochberg, 1995).
We adopted and compared three widely used machine-learning algorithms (e.g., random forests (Denisko & Hoffman, 2018), SVM (Rosales-Pérez et al., 2022) with linear/radial/polynomial kernel, and artificial neural networks (Tang et al., 2019; Yang & Wang, 2021)) to identify the optimal classifier for differentiating populations at different levels of each motor function, going beyond univariate statistical methods and considering the multivariate nature of structural and behavioral measures. In this study, the three-class classification was employed. As potential features, we used demographic and brain structure variables, as mentioned above. The data were randomly divided into two parts (70 % training data set and 30 % test data set). The 10-fold cross-validation strategy was used to estimate the generalization performance. To control the learning process, various hyperparameters were chosen to tune the models for random forest (e.g., maximum depth/ lead nodes/ sample/ features, minimum sample split/ sample leaf, number of estimators, bootstrap, criterion), SVM (e.g., kernel, C, gamma), and artificial neural network (e.g., weights, bias, learning rate, number of hidden layers/neurons in hidden layers, activation function) algorithms. Grid search estimates performance for combinations of supplied hyperparameters to achieve optimization.
Indices evaluated the performance of three machine-learning algorithms, including accuracy, sensitivity, specificity, positive predictive value, negative predictive value, precision, recall, F1, detection rate, detection prevalence, and area under the receiver operating characteristic curve (ROC-AUC) (Fan et al., 2021). The mean decrease in the Gini coefficient represented the contribution of variables to the node and leaf homogeneity and was used to rank the importance of features in the random forest model, with a higher score indicating higher importance (Menze et al., 2009). Permutation feature importance in the SVM (Zien et al., 2009) and artificial neural networks (Kavzoglu & Mather, 2002) was also calculated by comparing the values of coefficients. Machine-learning analyses were performed using the caret (Kuhn, 2015), kernlab (Karatzoglou et al., 2004), randomForest (Liaw & Wiener, 2002), keras (Allaire et al., 2022), and Rtsne (Krijthe et al., 2018) packages of the statistical programming language R (version 4.1.3).
ResultsAssociations between motor and cognitive functionsAs predicted, after including covariates in the model, we found that cardiorespiratory fitness and hand dexterity were positively and significantly correlated with performance on tests of cognitive flexibility, inhibitory control, working memory, picture sequence memory, verbal episodic memory (accuracy), sustained attention (true positives, median response time, sensitivity, and specificity), processing speed (accuracy), spatial orientation, impulsivity, reading decoding, and vocabulary comprehension, as well as fluid intelligence, crystallized intelligence, and an overall cognitive function composite score (FDR corrected, p < 0.05) (Appendix F). The score of hand dexterity was negatively correlated with median response time in tests of verbal episodic memory and sustained attention (FDR corrected, p < 0.05) (Appendix F). Further, we found a positive association between gait speed and inhibitory control (FDR corrected, p < 0.05). Finally, as predicted, we found that handgrip strength was positively associated with scores of cognitive flexibility, inhibitory control, sustained attention, and spatial orientation (FDR corrected, p < 0.05). The permutation test confirmed all the significant findings (FDR corrected, p < 0.05) and no other statistically significant correlations as the above-reported were observed. A more detailed overview of the results of the correlation analyses is shown in Fig. 1a and Appendix F.
Associations between motor functions and brain structure in the HCP datasetCardiorespiratory fitness was positively associated with the thickness of the left insula, surface areas of brain regions involved in the default mode, sensorimotor and limbic networks (e.g., entorhinal, posterior cingulate, inferior parietal, inferior and middle temporal, and precentral gyri), and subcortical volumes of the bilateral hippocampus (FDR corrected, p < 0.05; permutation tests confirmed results) (Fig. 2; Appendix F & G). We observed that handgrip strength was positively correlated with the cortical thickness of regions involved in the interoceptive network (e.g., bilateral rostral anterior cingulate, left medial orbitofrontal, and right insula gyri), surface areas of regions involved in the default mode, salience, and lateral visual networks (e.g., bilateral inferior parietal, posterior cingulate, rostral middle frontal, left lateral occipital, and right insula gyri), and subcortical volumes of basal ganglia and limbic regions (e.g., putamen, amygdala, and accumbens) (FDR corrected, p < 0.05; permutation tests confirmed results) (Fig. 3; Appendix F & G). Positive associations that did not survive FDR correction were observed between gait speed and measures of brain structure or hand dexterity and measures of brain structure (see Appendix F & G for an overview of these associations).
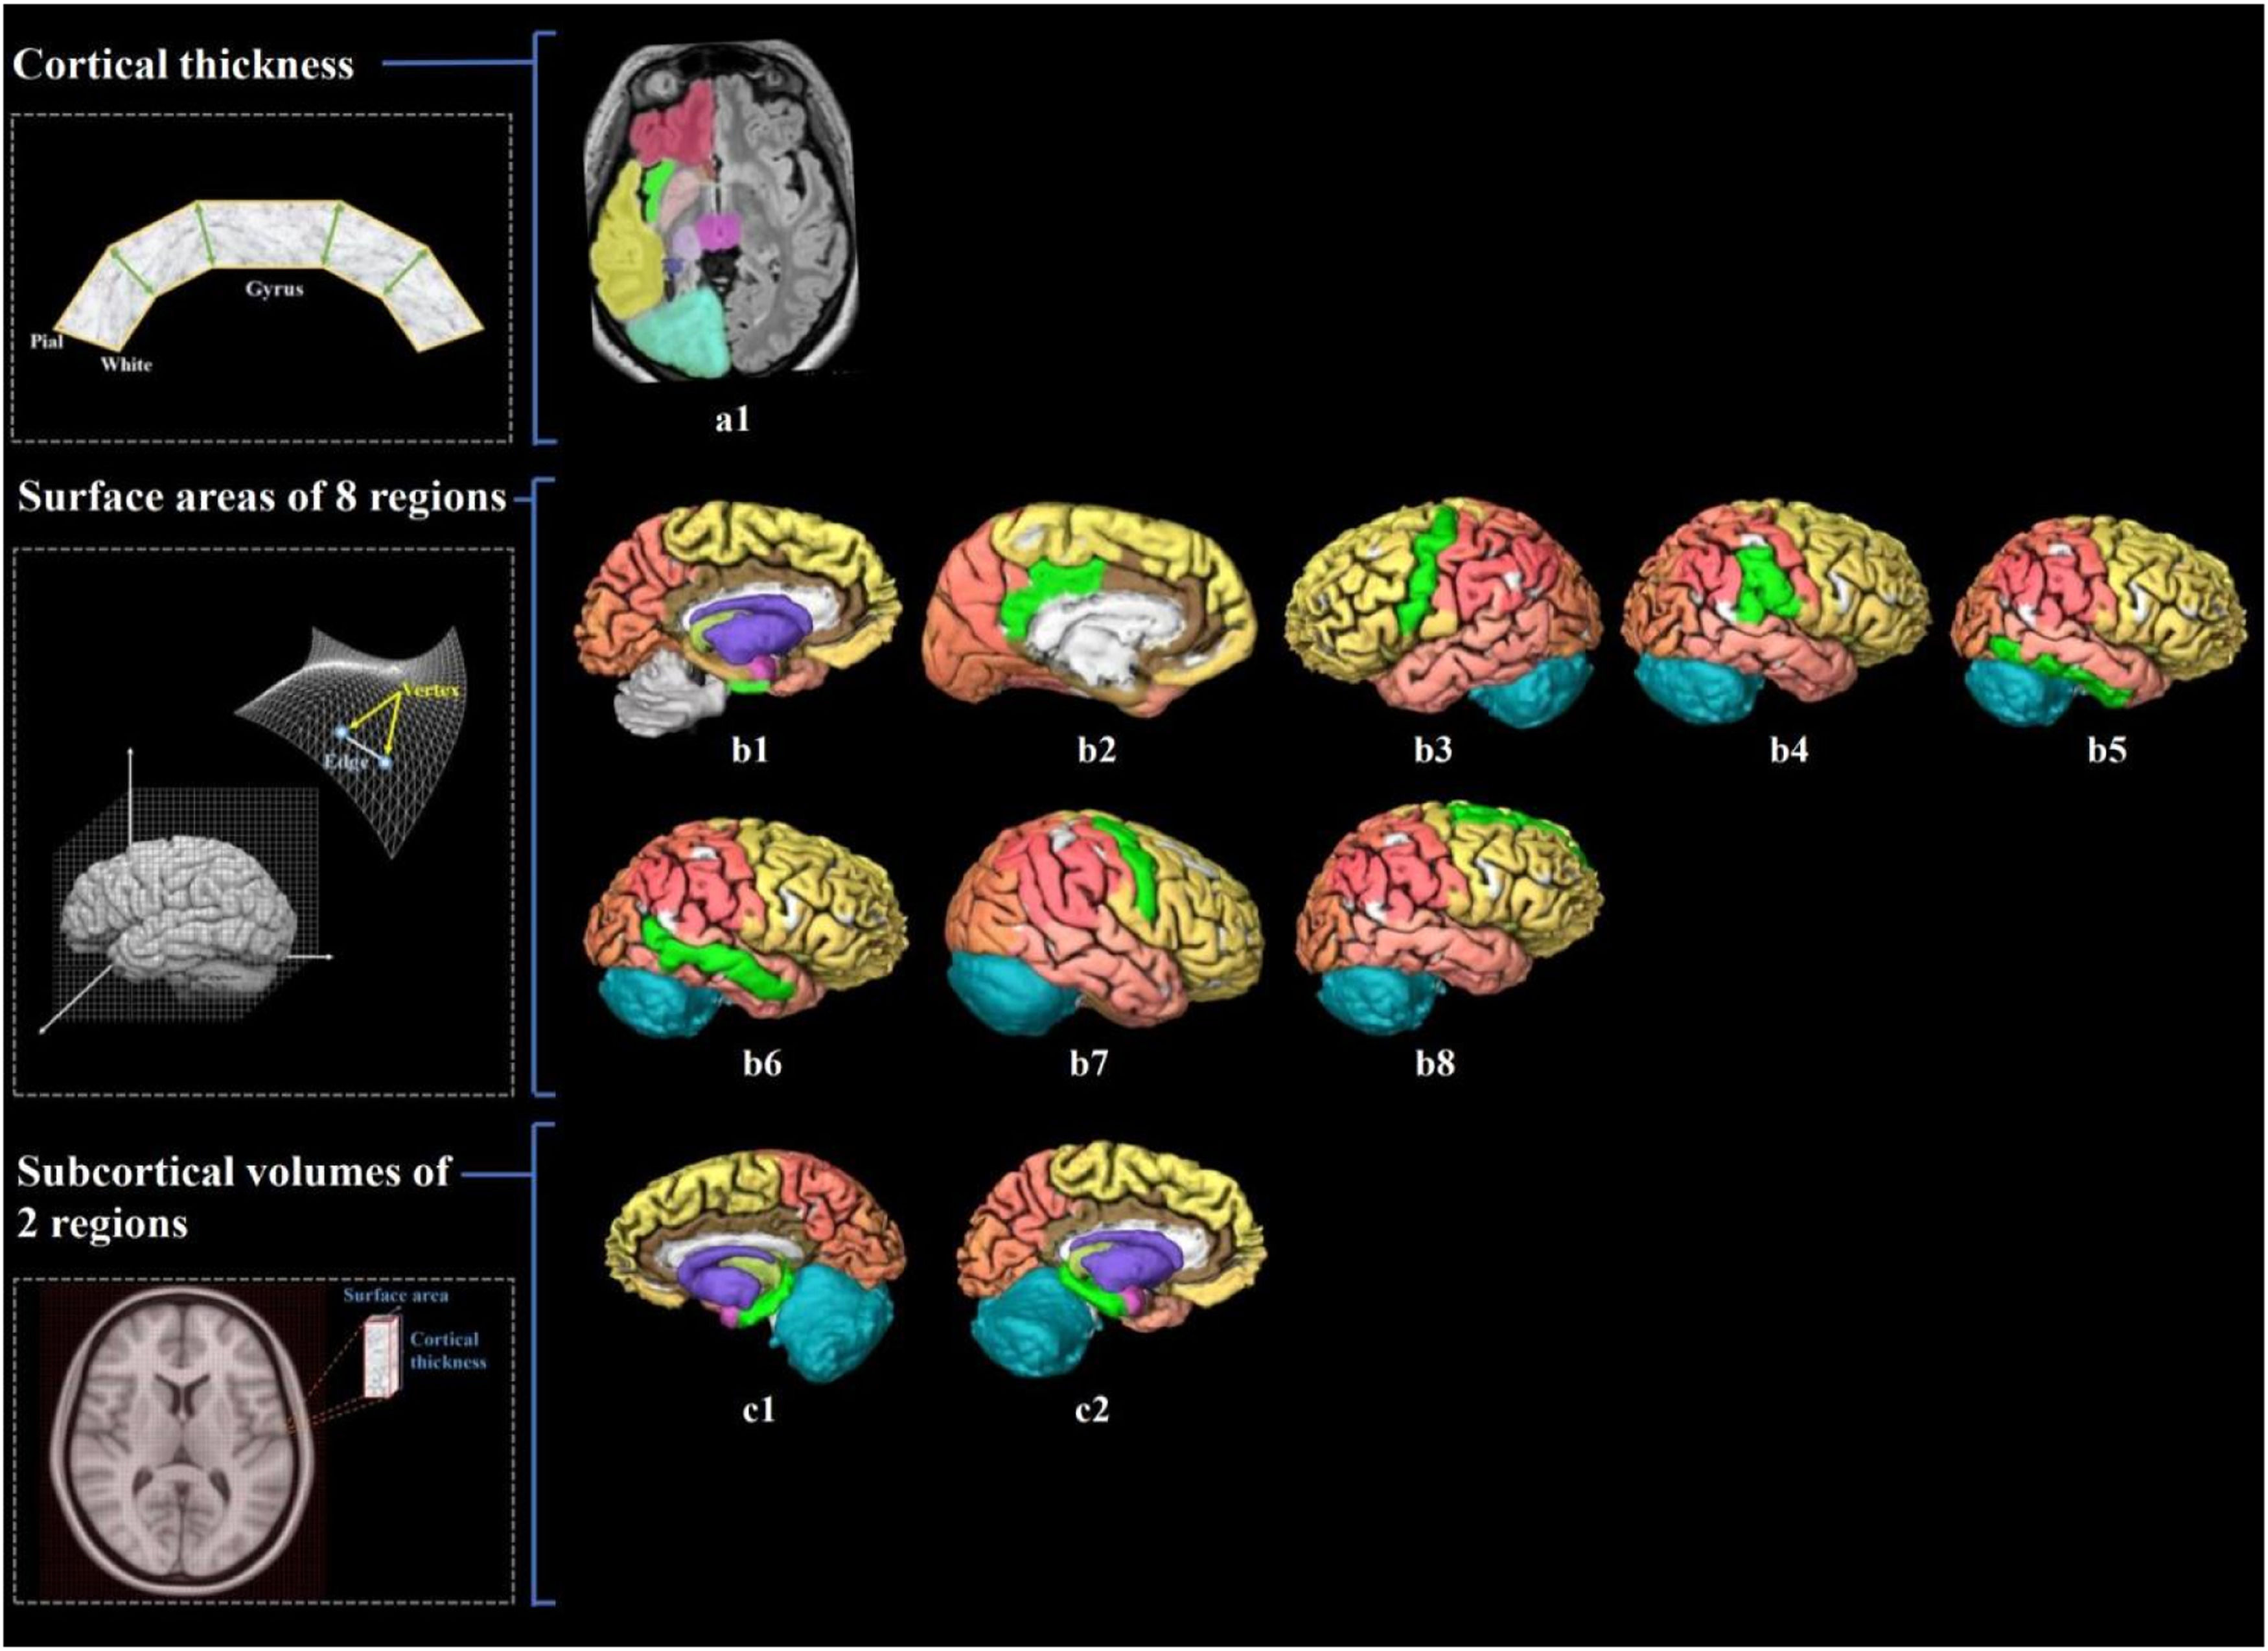
![Visualization of brain structure measures associated with cardiorespiratory fitness in young adults. Notes. Figure a1 shows the associated cerebral thickness of the left insula; Figure b1–8 shows the associated surface areas of 8 brain regions, including the left entorhinal, left posterior cingulate, left precentral, right inferior parietal, right inferior temporal, right middle temporal, right precentral, and right superior frontal gyri; Figure c1–2 shows the associated subcortical volumes of the left and right hippocampus. We also illustrate the calculation of brain structure measures: cortical thickness, the distance from the white surface vertex to the closest point on the pial surface; surface area, the sum of all mesh surfaces composed of vertex [intersection of the triangle] and edge [connection between vertices]; subcortical volume, an approximate estimate of the volume obtained by multiplying the area by thickness at each vertex. The regions associated with endurance are marked in bright green, while the other regions are shown in different colors corresponding to various brain lobes: yellow for the frontal lobe, red for the parietal lobe, pink for the temporal lobe, orange for the occipital lobe, brown for the limbic lobe, blue for the cerebellum, and purple for the cerebral nuclei.).](https://static.elsevier.es/multimedia/16972600/0000002400000003/v5_202411250749/S1697260024000632/v5_202411250749/en/main.assets/gr2.jpeg?xkr=ue/ImdikoIMrsJoerZ+w997EogCnBdOOD93cPFbanNensa1rW+zY7MJT+xyAusAd1eWSWVsld5nw/a67MxcQhCEMM2i1CV6qumZGJ0M7jjFysrLJ5QeiW7RzNNLWY0mpKgZ636k3fCq00dBkBbaOYyHBKyisBoN3MH+NDP6TEFdFt7Yv394AY7GHqsOnzrhH7XW2C9jQ02zLZE47Bn0gGAnSRBKoxA0oG4MrajvMyBzsuWBoysaZs1sSoWUIpWCHNxMDz0O3ua4LcFjl4uAoi7LmifeoCe9yvjpFAjJALHM= "Visualization of brain structure measures associated with cardiorespiratory fitness in young adults. Notes. Figure a1 shows the associated cerebral thickness of the left insula; Figure b1–8 shows the associated surface areas of 8 brain regions, including the left entorhinal, left posterior cingulate, left precentral, right inferior parietal, right inferior temporal, right middle temporal, right precentral, and right superior frontal gyri; Figure c1–2 shows the associated subcortical volumes of the left and right hippocampus. We also illustrate the calculation of brain structure measures: cortical thickness, the distance from the white surface vertex to the closest point on the pial surface; surface area, the sum of all mesh surfaces composed of vertex [intersection of the triangle] and edge [connection between vertices]; subcortical volume, an approximate estimate of the volume obtained by multiplying the area by thickness at each vertex. The regions associated with endurance are marked in bright green, while the other regions are shown in different colors corresponding to various brain lobes: yellow for the frontal lobe, red for the parietal lobe, pink for the temporal lobe, orange for the occipital lobe, brown for the limbic lobe, blue for the cerebellum, and purple for the cerebral nuclei.).")
Visualization of brain structure measures associated with cardiorespiratory fitness in young adults.
Notes. Figure a1 shows the associated cerebral thickness of the left insula; Figure b1–8 shows the associated surface areas of 8 brain regions, including the left entorhinal, left posterior cingulate, left precentral, right inferior parietal, right inferior temporal, right middle temporal, right precentral, and right superior frontal gyri; Figure c1–2 shows the associated subcortical volumes of the left and right hippocampus. We also illustrate the calculation of brain structure measures: cortical thickness, the distance from the white surface vertex to the closest point on the pial surface; surface area, the sum of all mesh surfaces composed of vertex [intersection of the triangle] and edge [connection between vertices]; subcortical volume, an approximate estimate of the volume obtained by multiplying the area by thickness at each vertex. The regions associated with endurance are marked in bright green, while the other regions are shown in different colors corresponding to various brain lobes: yellow for the frontal lobe, red for the parietal lobe, pink for the temporal lobe, orange for the occipital lobe, brown for the limbic lobe, blue for the cerebellum, and purple for the cerebral nuclei.).
.")
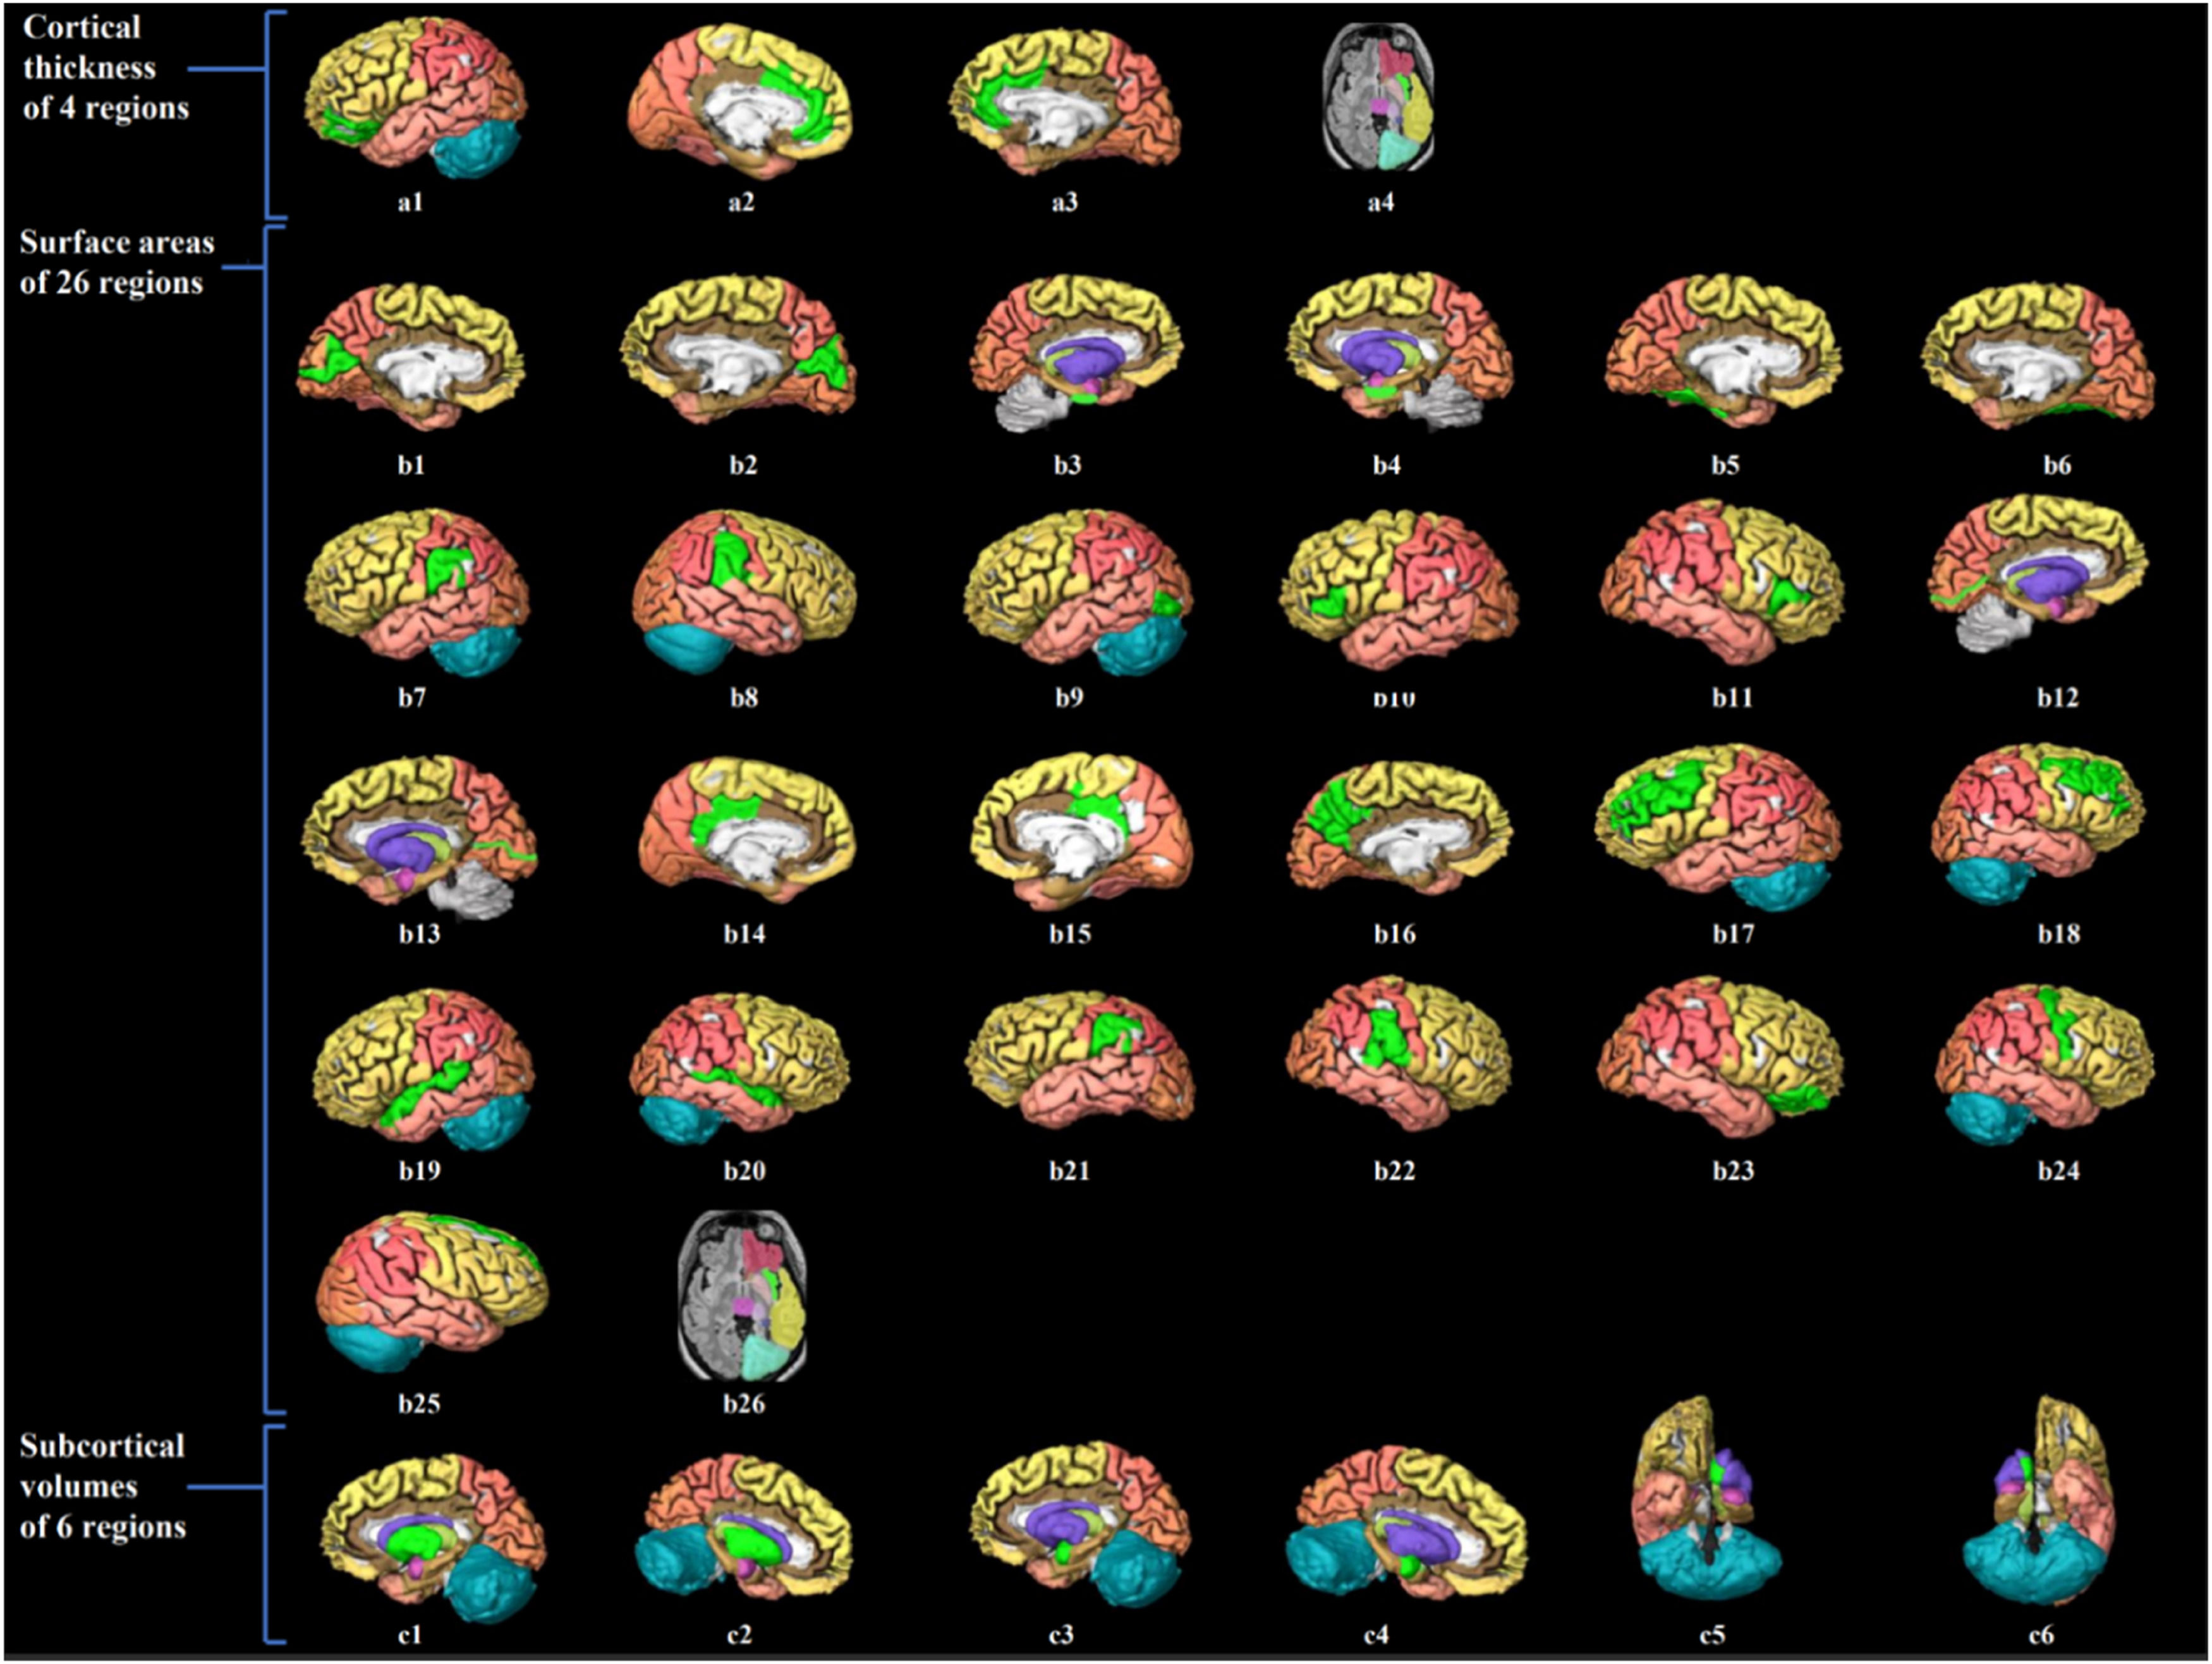
Visualization of brain structure measures associated with handgrip strength in young adults.
Notes. Figure a1–4 shows the associated cerebral thickness of 4 brain regions, including the left medial orbitofrontal, left and right rostral anterior cingulate, and right insula gyri; Figure b1–26 shows the associated surface areas of 26 brain regions, including the left and right cuneus, left and right entorhinal, left and right fusiform, left and right inferior parietal, left lateral occipital, left and right pars triangularis, left and right peri calcarine, left and right posterior cingulate, left precuneus, left and right rostral middle frontal, left and right superior temporal, left and right supramarginal, right pars orbitalis, right precentral, right superior frontal, and right insula gyri; Figure c1–6 shows the associated subcortical volumes of 6 brain regions including the left and right putamen, amygdala, and accumbens areas. The regions associated with grip strength are marked in bright green, while the other regions are shown in different colors corresponding to various brain lobes: yellow for the frontal lobe, red for the parietal lobe, pink for the temporal lobe, orange for the occipital lobe, brown for the limbic lobe, blue for the cerebellum, and purple for the cerebral nuclei.).
As shown in Table 1, the left caudal middle frontal average thickness mediated the relationship between cardiorespiratory fitness and the cognitive flexibility score (mediated proportion = 3.67 %, FDR corrected, p < 0.05). The association between cardiorespiratory fitness and working memory performance was mediated by the surface area of the right inferior parietal, middle temporal, and precentral gyri [mediated proportions = 23.63 %, 29.78 %, 27.81 %; FDR corrected, p < 0.05]). The relationship between cardiorespiratory fitness and spatial orientation (accuracy) was mediated by the surface areas of the left entorhinal, right middle, and inferior temporal gyri (mediated proportions = 21.74 %, 26.09, 21.74 %; FDR corrected, p < 0.05). The right middle temporal surface area mediated the relationship between cardiorespiratory fitness and impulsivity performance (FDR corrected, p < 0.05). Associations between cardiorespiratory fitness and reading decoding and comprehension were mediated by the surface areas of inferior and middle temporal, precentral, and entorhinal gyri (FDR corrected, p < 0.05]) and bilateral hippocampus volumes (FDR corrected, p < 0.05).
Mediation analysis.
| Independent Variable | Dependent Variable | Mediator | Path | Estimate | p-value | LLCI | ULCI | FDR Corrected p-value | |
|---|---|---|---|---|---|---|---|---|---|
| 1 | Cardiorespiratory Fitness | CardSort | FS_L_Caudalmiddlefrontal_Thck | Path A | −0.0070 | 0.0147 | −0.0012 | −0.0010 | 0.0155 |
| Path B | −155.5826 | 0.0008 | −245.9025 | −65.2627 | 0.0009 | ||||
| Path C ' | 2.7772 | 0.0000 | 2.0201 | 3.5344 | 0.0000 | ||||
| Path C | 2.8831 | 0.0000 | 2.1241 | 3.6421 | 0.0000 | ||||
| Path AB | 0.1059 | 0.0002 | 0.0181 | 0.2322 | 0.0002 | ||||
| 2 | Cardiorespiratory Fitness | ListSort | FS_R_Inferiorparietal_Area | Path A | 0.0115 | 0.0000 | 0.0084 | 0.0147 | 0.0000 |
| Path B | 2.4971 | 0.0001 | 1.2188 | 3.7753 | 0.0001 | ||||
| Path C ' | 0.0931 | 0.0039 | 0.0300 | 0.1562 | 0.0043 | ||||
| Path C | 0.1219 | 0.0001 | 0.0601 | 0.1837 | 0.0001 | ||||
| Path AB | 0.0288 | 0.0002 | 0.0134 | 0.0482 | 0.0002 | ||||
| 3 | Cardiorespiratory Fitness | ListSort | FS_R_Middletemporal_Area | Path A | 0.0870 | 0.0000 | 0.0645 | 0.1094 | 0.0000 |
| Path B | 0.4177 | 0.0000 | 0.2396 | 0.5958 | 0.0000 | ||||
| Path C ' | 0.0856 | 0.0079 | 0.0225 | 0.1486 | 0.0086 | ||||
| Path C | 0.1219 | 0.0001 | 0.0601 | 0.1837 | 0.0001 | ||||
| Path AB | 0.0363 | 0.0002 | 0.0203 | 0.0548 | 0.0002 | ||||
| 4 | Cardiorespiratory Fitness | ListSort | FS_R_Precentral_Area | Path A | 0.0020 | 0.0000 | 0.0015 | 0.0025 | 0.0000 |
| Path B | 16.8657 | 0.0000 | 9.2551 | 24.4762 | 0.0000 | ||||
| Path C ' | 0.0880 | 0.0063 | 0.0249 | 0.1511 | 0.0069 | ||||
| Path C | 0.1219 | 0.0001 | 0.0601 | 0.1837 | 0.0001 | ||||
| Path AB | 0.0339 | 0.0002 | 0.0183 | 0.0525 | 0.0002 | ||||
| 5 | Cardiorespiratory Fitness | VSPLOT_ACC | FS_L_Entorhinal_Area | Path A | 0.0001 | 0.0000 | 0.0001 | 0.0001 | 0.0000 |
| Path B | 4.4260 | 0.0000 | 3.0975 | 5.7545 | 0.0000 | ||||
| Path C ' | 0.0018 | 0.0000 | 0.0012 | 0.0023 | 0.0000 | ||||
| Path C | 0.0023 | 0.0000 | 0.0017 | 0.0028 | 0.0000 | ||||
| Path AB | 0.0005 | 0.0002 | 0.0003 | 0.0007 | 0.0002 | ||||
| 6 | Cardiorespiratory Fitness | VSPLOT_ACC | FS_R_Inferiortemporal_Area | Path A | 0.0165 | 0.0000 | 0.0121 | 0.0209 | 0.0000 |
| Path B | 0.0291 | 0.0000 | 0.0211 | 0.0370 | 0.0000 | ||||
| Path C ' | 0.0018 | 0.0000 | 0.0012 | 0.0023 | 0.0000 | ||||
| Path C | 0.0023 | 0.0000 | 0.0017 | 0.0028 | 0.0000 | ||||
| Path AB | 0.0005 | 0.0002 | 0.0003 | 0.0007 | 0.0002 | ||||
| 7 | Cardiorespiratory Fitness | VSPLOT_ACC | FS_R_Middletemporal_Area | Path A | 0.0870 | 0.0000 | 0.0645 | 0.1094 | 0.0000 |
| Path B | 0.0068 | 0.0000 | 0.0053 | 0.0083 | 0.0000 | ||||
| Path C ' | 0.0017 | 0.0000 | 0.0011 | 0.0022 | 0.0000 | ||||
| Path C | 0.0023 | 0.0000 | 0.0017 | 0.0186 | 0.0000 | ||||
| Path AB | 0.0006 | 0.0002 | 0.0004 | 0.0008 | 0.0002 | ||||
| 8 | Cardiorespiratory Fitness | DDisc_AUC_200 | FS_R_Middletemporal_Area | Path A | 0.0870 | 0.0000 | 0.0645 | 0.1094 | 0.0000 |
| Path B | 0.0098 | 0.0148 | 0.0019 | 0.0176 | 0.0155 | ||||
| Path C ' | 0.0069 | 0.0000 | 0.0041 | 0.0096 | 0.0000 | ||||
| Path C | 0.0077 | 0.0000 | 0.0050 | 0.0104 | 0.0000 | ||||
| Path AB | 0.0008 | 0.0002 | 0.0002 | 0.0016 | 0.0002 | ||||
| 9 | Cardiorespiratory Fitness | DDisc_AUC_40K | FS_R_Middletemporal_Area | Path A | 0.0870 | 0.0000 | 0.0645 | 0.1094 | 0.0000 |
| Path B | 0.0061 | 0.0111 | 0.0014 | 0.0108 | 0.0121 | ||||
| Path C ' | 0.0049 | 0.0000 | 0.0033 | 0.0066 | 0.0000 | ||||
| Path C | 0.0055 | 0.0000 | 0.0038 | 0.0071 | 0.0000 | ||||
| Path AB | 0.0005 | 0.0002 | 0.0001 | 0.0010 | 0.0002 | ||||
| 10 | Cardiorespiratory Fitness | ReadEng | FS_L_Caudalmiddlefrontal_Thck | Path A | −0.0007 | 0.0147 | −0.0012 | −0.0001 | 0.0155 |
| Path B | −527.6050 | 0.2100 | −1353.0989 | 297.8889 | 0.2110 | ||||
| Path C ' | 34.6756 | 0.0000 | 27.7555 | 41.5957 | 0.0000 | ||||
| Path C | 35.0346 | 0.0000 | 28.1352 | 41.9341 | 0.0000 | ||||
| Path AB | 0.3590 | 0.0600 | −0.1921 | 1.2089 | 0.0608 | ||||
| 11 | Cardiorespiratory Fitness | ReadEng | FS_L_Entorhinal_Area | Path A | 0.0001 | 0.0000 | 0.0001 | 0.0001 | 0.0000 |
| Path B | 34,583.8697 | 0.0001 | 17,703.9735 | 51,463.7659 | 0.0001 | ||||
| Path C ' | 31.4421 | 0.0000 | 24.3789 | 38.5054 | 0.0000 | ||||
| Path C | 35.0346 | 0.0000 | 28.1352 | 41.9341 | 0.0000 | ||||
| Path AB | 3.5925 | 0.0002 | 1.7345 | 5.7327 | 0.0002 | ||||
| 12 | Cardiorespiratory Fitness | ReadEng | FS_L_Posteriorcingulate_Area | Path A | 0.0002 | 0.0000 | 0.0001 | 0.0002 | 0.0000 |
| Path B | 14,638.3048 | 0.0002 | 6890.6128 | 22,385.9969 | 0.0002 | ||||
| Path C ' | 32.2231 | 0.0000 | 25.2122 | 39.2340 | 0.0000 | ||||
| Path C | 35.0346 | 0.0000 | 28.1352 | 41.9341 | 0.0000 | ||||
| Path AB | 2.8115 | 0.0002 | 1.3210 | 4.6973 | 0.0002 | ||||
| 13 | Cardiorespiratory Fitness | ReadEng | FS_L_Precentral_Area | Path A | 0.0002 | 0.0000 | 0.0001 | 0.0002 | 0.0000 |
| Path B | 28,735.0258 | 0.0000 | 17,037.5068 | 40,432.5448 | 0.0000 | ||||
| Path C ' | 30.5496 | 0.0000 | 23.4934 | 37.6057 | 0.0000 | ||||
| Path C | 35.0346 | 0.0000 | 28.1352 | 41.9341 | 0.0000 | ||||
| Path AB | 4.4851 | 0.0002 | 2.3261 | 6.8429 | 0.0002 | ||||
| 14 | Cardiorespiratory Fitness | ReadEng | FS_R_Inferiorparietal_Area | Path A | 0.0115 | 0.0000 | 0.0084 | 0.0147 | 0.0000 |
| Path B | 333.3046 | 0.0000 | 191.0708 | 475.5312 | 0.0000 | ||||
| Path C ' | 31.1936 | 0.0000 | 24.1760 | 38.2113 | 0.0000 | ||||
| Path C | 35.0346 | 0.0000 | 28.1352 | 41.9341 | 0.0000 | ||||
| Path AB | 3.8410 | 0.0002 | 1.9184 | 6.1039 | 0.0002 | ||||
| 15 | Cardiorespiratory Fitness | ReadEng | FS_R_Inferiortemporal_Area | Path A | 0.0165 | 0.0000 | 0.0121 | 0.0209 | 0.0000 |
| Path B | 240.8833 | 0.0000 | 140.0407 | 341.7259 | 0.0000 | ||||
| Path C ' | 31.0666 | 0.0000 | 24.0467 | 38.0865 | 0.0000 | ||||
| Path C | 35.0346 | 0.0000 | 28.1352 | 41.9341 | 0.0000 | ||||
| Path AB | 3.9680 | 0.0002 | 2.1397 | 6.3113 | 0.0002 | ||||
| 16 | Cardiorespiratory Fitness | ReadEng | FS_R_Middletemporal_Area | Path A | 0.0870 | 0.0000 | 0.0645 | 0.1094 | 0.0000 |
| Path B | 71.4987 | 0.0000 | 51.9326 | 91.0649 | 0.0000 | ||||
| Path C ' | 28.8165 | 0.0000 | 21.8901 | 35.7429 | 0.0000 | ||||
| Path C | 35.0346 | 0.0000 | 28.1352 | 41.9341 | 0.0000 | ||||
| Path AB | 6.2181 | 0.0002 | 3.9548 | 8.5871 | 0.0002 | ||||
| 17 | Cardiorespiratory Fitness | ReadEng | FS_R_Precentral_Area | Path A | 0.0020 | 0.0000 | 0.0015 | 0.0025 | 0.0000 |
| Path B | 2262.8529 | 0.0000 | 1417.0680 | 3108.6379 | 0.0000 | ||||
| Path C ' | 30.4842 | 0.0000 | 23.4748 | 37.4937 | 0.0000 | ||||
| Path C | 35.0346 | 0.0000 | 28.1352 | 41.9341 | 0.0000 | ||||
| Path AB | 4.5504 | 0.0002 | 2.6137 | 6.6321 | 0.0002 | ||||
| 18 | Cardiorespiratory Fitness | ReadEng | FS_L_Hippo_Vol | Path A | 6.0861 | 0.0000 | 4.3497 | 7.8225 | 0.0000 |
| Path B | 0.7000 | 0.0000 | 0.4441 | 0.9559 | 0.0000 | ||||
| Path C ' | 30.7742 | 0.0000 | 23.8028 | 37.7457 | 0.0000 | ||||
| Path C | 35.0346 | 0.0000 | 28.1352 | 41.9341 | 0.0000 | ||||
| Path AB | 4.2604 | 0.0001 | 2.3130 | 6.4168 | 0.0001 | ||||
| 19 | Cardiorespiratory Fitness | ReadEng | FS_R_Hippo_Vol | Path A | 7.9423 | 0.0000 | 5.8717 | 10.0130 | 0.0000 |
| Path B | 0.5193 | 0.0000 | 0.3040 | 0.7346 | 0.0000 | ||||
| Path C ' | 30.9103 | 0.0000 | 23.8801 | 37.9404 | 0.0000 | ||||
| Path C | 35.0346 | 0.0000 | 28.1352 | 41.9341 | 0.0000 | ||||
| Path AB | 4.1244 | 0.0002 | 2.2156 | 6.2508 | 0.0002 | ||||
| 20 | Cardiorespiratory Fitness | PicVocab | FS_L_Entorhinal_Area | Path A | 0.0001 | 0.0000 | 0.0001 | 0.0001 | 0.0000 |
| Path B | 430.5813 | 0.0000 | 259.6495 | 601.5130 | 0.0000 | ||||
| Path C ' | 0.2571 | 0.0000 | 0.1855 | 0.3286 | 0.0000 | ||||
| Path C | 0.3018 | 0.0000 | 0.2316 | 0.3720 | 0.0000 | ||||
| Path AB | 0.0447 | 0.0002 | 0.0245 | 0.0673 | 0.0002 | ||||
| 21 | Cardiorespiratory Fitness | PicVocab | FS_L_Precentral_Area | Path A | 0.0002 | 0.0000 | 0.0001 | 0.0002 | 0.0000 |
| Path B | 314.0892 | 0.0000 | 195.3403 | 432.8380 | 0.0000 | ||||
| Path C ' | 0.2528 | 0.0000 | 1.1811 | 0.3244 | 0.0000 | ||||
| Path C | 0.3018 | 0.0000 | 0.2316 | 0.3720 | 0.0000 | ||||
| Path AB | 0.0490 | 0.0002 | 0.0280 | 0.0706 | 0.0002 | ||||
| 22 | Cardiorespiratory Fitness | PicVocab | FS_R_Inferiortemporal_Area | Path A | 0.0165 | 0.0000 | 0.0121 | 0.0209 | 0.0000 |
| Path B | 2.8810 | 0.0000 | 1.8601 | 3.9020 | 0.0000 | ||||
| Path C ' | 0.2543 | 0.0000 | 0.1832 | 0.3254 | 0.0000 | ||||
| Path C | 0.3018 | 0.0000 | 0.2316 | 0.3720 | 0.0000 | ||||
| Path AB | 0.0475 | 0.0002 | 0.0286 | 0.0720 | 0.0002 | ||||
| 23 | Cardiorespiratory Fitness | PicVocab | FS_R_Middletemporal_Area | Path A | 0.0870 | 0.0000 | 0.0645 | 0.1094 | 0.0000 |
| Path B | 0.7437 | 0.0000 | 0.5450 | 0.9425 | 0.0000 | ||||
| Path C ' | 0.2371 | 0.0000 | 0.1667 | 0.3075 | 0.0000 | ||||
| Path C | 0.3018 | 0.0000 | 0.2316 | 0.3720 | 0.0000 | ||||
| Path AB | 0.0647 | 0.0002 | 0.0446 | 0.0893 | 0.0002 | ||||
| 24 | Cardiorespiratory Fitness | PicVocab | FS_R_Precentral_Area | Path A | 0.0020 | 0.0000 | 0.0015 | 0.0025 | 0.0000 |
| Path B | 26.3919 | 0.0000 | 17.8301 | 34.9536 | 0.0000 | ||||
| Path C ' | 0.2487 | 0.0000 | 0.1778 | 0.3197 | 0.0000 | ||||
| Path C | 0.3018 | 0.0000 | 0.2316 | 0.3720 | 0.0000 | ||||
| Path AB | 0.0531 | 0.0002 | 0.0323 | 0.0751 | 0.0002 | ||||
| 25 | Cardiorespiratory Fitness | PicVocab | FS_L_Hippo_Vol | Path A | 6.0861 | 0.0000 | 4.3497 | 7.8225 | 0.0000 |
| Path B | 0.0081 | 0.0000 | 0.0055 | 0.0107 | 0.0000 | ||||
| Path C ' | 0.2524 | 0.0000 | 0.1819 | 0.3230 | 0.0000 | ||||
| Path C | 0.3018 | 0.0000 | 0.2316 | 0.3720 | 0.0000 | ||||
| Path AB | 0.0493 | 0.0002 | 0.0304 | 0.0720 | 0.0002 | ||||
| 26 | Cardiorespiratory Fitness | PicVocab | FS_R_Hippo_Vol | Path A | 7.9423 | 0.0000 | 5.8717 | 10.0130 | 0.0000 |
| Path B | 0.0061 | 0.0000 | 0.0039 | 0.0082 | 0.0000 | ||||
| Path C ' | 0.2537 | 0.0000 | 0.1825 | 0.3250 | 0.0000 | ||||
| Path C | 0.3018 | 0.0000 | 0.2316 | 0.3720 | 0.0000 | ||||
| Path AB | 0.0481 | 0.0002 | 0.0291 | 0.0701 | 0.0002 | ||||
| 27 | Cardiorespiratory Fitness | CogFluidComp | FS_L_Caudalmiddlefrontal_Thck | Path A | −0.0007 | 0.0147 | −0.0012 | −0.0001 | 0.0155 |
| Path B | −4.1068 | 0.0130 | −7.3461 | −0.8675 | 0.0141 | ||||
| Path C ' | 0.1050 | 0.0000 | 0.0779 | 0.1322 | 0.0000 | ||||
| Path C | 0.1078 | 0.0000 | 0.0807 | 0.1349 | 0.0000 | ||||
| Path AB | 0.0028 | 0.0002 | 0.0002 | 0.0069 | 0.0002 | ||||
| 28 | Cardiorespiratory Fitness | CogCrystalComp | FS_L_Caudalmiddlefrontal_Thck | Path A | −0.0007 | 0.0147 | −0.0012 | −0.0001 | 0.0155 |
| Path B | −147.3573 | 0.2239 | −384.9629 | 90.2484 | 0.2239 | ||||
| Path C ' | 10.2054 | 0.0000 | 8.2135 | 12.1972 | 0.0000 | ||||
| Path C | 10.3057 | 0.0000 | 8.3198 | 12.2915 | 0.0000 | ||||
| Path AB | 0.1003 | 0.0550 | −0.0565 | 0.3219 | 0.0560 | ||||
| 29 | Cardiorespiratory Fitness | CogTotalComp | FS_L_Caudalmiddlefrontal_Thck | Path A | −0.0007 | 0.0147 | −0.0012 | −0.0001 | 0.0155 |
| Path B | −43.8991 | 0.0350 | −84.7124 | −3.0857 | 0.0358 | ||||
| Path C ' | 1.8710 | 0.0000 | 1.5288 | 2.2131 | 0.0000 | ||||
| Path C | 1.9008 | 0.0000 | 1.5592 | 2.2425 | 0.0000 | ||||
| Path AB | 0.0299 | 0.0002 | 0.0002 | 0.0762 | 0.0002 | ||||
| 30 | Cardiorespiratory Fitness | CogTotalComp | FS_L_Entorhinal_Area | Path A | 0.0001 | 0.0000 | 0.0001 | 0.0001 | 0.0000 |
| Path B | 2008.1690 | 0.0000 | 1175.0943 | 2841.2437 | 0.0000 | ||||
| Path C ' | 1.6922 | 0.0000 | 1.3436 | 2.0408 | 0.0000 | ||||
| Path C | 1.9008 | 0.0000 | 1.5592 | 2.2425 | 0.0000 | ||||
| Path AB | 0.2086 | 0.0002 | 0.1132 | 0.3221 | 0.0002 | ||||
| 31 | Cardiorespiratory Fitness | CogTotalComp | FS_L_Posteriorcingulate_Area | Path A | 0.0002 | 0.0000 | 0.0001 | 0.0002 | 0.0000 |
| Path B | 808.1861 | 0.0000 | 425.2322 | 1191.1400 | 0.0000 | ||||
| Path C ' | 1.7456 | 0.0000 | 1.3991 | 2.0921 | 0.0000 | ||||
| Path C | 1.9008 | 0.0000 | 1.5592 | 2.2425 | 0.0000 | ||||
| Path AB | 0.1552 | 0.0002 | 0.0782 | 0.2530 | 0.0002 | ||||
| 32 | Cardiorespiratory Fitness | CogTotalComp | FS_L_Precentral_Area | Path A | 0.0002 | 0.0000 | 0.0001 | 0.0002 | 0.0000 |
| Path B | 1492.2397 | 0.0000 | 913.7235 | 2070.7559 | 0.0000 | ||||
| Path C ' | 1.6679 | 0.0000 | 1.3189 | 2.0169 | 0.0000 | ||||
| Path C | 1.9008 | 0.0000 | 1.5592 | 2.2425 | 0.0000 | ||||
| Path AB | 0.2329 | 0.0002 | 0.1321 | 0.3447 | 0.0002 | ||||
| 33 | Cardiorespiratory Fitness | CogTotalComp | FS_R_Inferiortemporal_Area | Path A | 0.0165 | 0.0000 | 0.0121 | 0.0209 | 0.0000 |
| Path B | 13.7539 | 0.0000 | 8.7803 | 18.7275 | 0.0000 | ||||
| Path C ' | 1.6743 | 0.0000 | 1.3280 | 2.0205 | 0.0000 | ||||
| Path C | 1.9008 | 0.0000 | 1.5592 | 2.2425 | 0.0000 | ||||
| Path AB | 0.2266 | 0.0002 | 0.1342 | 0.3378 | 0.0002 | ||||
| 34 | Cardiorespiratory Fitness | CogTotalComp | FS_R_Middletemporal_Area | Path A | 0.0870 | 0.0000 | 0.0645 | 0.1094 | 0.0000 |
| Path B | 3.1842 | 0.0000 | 2.2100 | 4.1584 | 0.0000 | ||||
| Path C ' | 1.6239 | 0.0000 | 1.2790 | 1.9688 | 0.0000 | ||||
| Path C | 1.9008 | 0.0000 | 1.5592 | 2.2425 | 0.0000 | ||||
| Path AB | 0.2769 | 0.0002 | 0.1795 | 0.3899 | 0.0002 | ||||
| 35 | Cardiorespiratory Fitness | CogTotalComp | FS_R_Precentral_Area | Path A | 0.0020 | 0.0000 | 0.0015 | 0.0025 | 0.0000 |
| Path B | 127.4282 | 0.0000 | 85.7333 | 169.1230 | 0.0000 | ||||
| Path C ' | 1.6446 | 0.0000 | 1.2990 | 1.9901 | 0.0000 | ||||
| Path C | 1.9008 | 0.0000 | 1.5592 | 2.2425 | 0.0000 | ||||
| Path AB | 0.2562 | 0.0002 | 0.1568 | 0.3568 | 0.0002 | ||||
| 36 | Cardiorespiratory Fitness | CogTotalComp | FS_L_Hippo_Vol | Path A | 6.0861 | 0.0000 | 4.3497 | 7.8225 | 0.0000 |
| Path B | 0.0284 | 0.0000 | 0.0157 | 0.0411 | 0.0000 | ||||
| Path C ' | 1.7281 | 0.0000 | 1.3810 | 2.0751 | 0.0000 | ||||
| Path C | 1.9008 | 0.0000 | 1.5592 | 2.2425 | 0.0000 | ||||
| Path AB | 0.1728 | 0.0002 | 0.0844 | 0.2727 | 0.0002 | ||||
| 37 | Handgrip Strength | CardSort | FS_L_Pericalcarine_Area | Path A | 79.4936 | 0.0000 | 63.2377 | 95.7496 | 0.0000 |
| Path B | 0.0868 | 0.0003 | 0.0405 | 0.1332 | 0.0003 | ||||
| Path C ' | 15.3420 | 0.0131 | 3.2320 | 27.4520 | 0.0141 | ||||
| Path C | 22.2457 | 0.0002 | 10.6312 | 33.8601 | 0.0002 | ||||
| Path AB | 6.9037 | 0.0002 | 3.4276 | 11.1908 | 0.0002 | ||||
| 38 | Handgrip Strength | CardSort | FS_R_Pericalcarine_Area | Path A | 87.7677 | 0.0000 | 70.6487 | 104.8866 | 0.0000 |
| Path B | 0.0854 | 0.0002 | 0.0414 | 0.1294 | 0.0002 | ||||
| Path C ' | 14.7494 | 0.0175 | 2.5905 | 26.9084 | 0.0182 | ||||
| Path C | 22.2457 | 0.0002 | 10.6312 | 33.8601 | 0.0002 | ||||
| Path AB | 7.4962 | 0.0002 | 3.6249 | 11.7584 | 0.0002 | ||||
| 39 | Handgrip Strength | Flanker | FS_L_Pericalcarine_Area | Path A | 79.4936 | 0.0000 | 63.2377 | 95.7496 | 0.0000 |
| Path B | 0.6346 | 0.0000 | 0.3551 | 0.9141 | 0.0000 | ||||
| Path C ' | 85.6964 | 0.0214 | 12.7387 | 158.6542 | 0.0220 | ||||
| Path C | 136.1430 | 0.0002 | 65.9277 | 206.3584 | 0.0002 | ||||
| Path AB | 50.4466 | 0.0002 | 28.8841 | 76.2970 | 0.0002 | ||||
| 40 | Handgrip Strength | Flanker | FS_R_Pericalcarine_Area | Path A | 79.4936 | 0.0000 | 63.2377 | 95.7496 | 0.0000 |
| Path B | 0.6346 | 0.0000 | 0.3551 | 0.9141 | 0.0000 | ||||
| Path C ' | 85.6964 | 0.0214 | 12.7387 | 158.6542 | 0.0220 | ||||
| Path C | 136.1430 | 0.0002 | 65.9277 | 206.3584 | 0.0002 | ||||
| Path AB | 50.4466 | 0.0002 | 28.8841 | 76.2970 | 0.0002 | ||||
| 41 | Handgrip Strength | SCPT_SPEC | FS_R_Insula_Thck | Path A | 0.0893 | 0.0000 | 0.0606 | 0.1180 | 0.0000 |
| Path B | −0.0085 | 0.0011 | −0.0135 | −0.0034 | 0.0012 | ||||
| Path C ' | −0.0019 | 0.0978 | −0.0042 | 0.0004 | 0.0987 | ||||
| Path C | −0.0027 | 0.0193 | −0.0049 | −0.0004 | 0.0200 | ||||
| Path AB | −0.0008 | 0.0002 | −0.0013 | −0.0003 | 0.0002 | ||||
| 42 | Handgrip Strength | VSPLOT_ACC | FS_L_Entorhinal_Area | Path A | 0.0021 | 0.0000 | 0.0017 | 0.0025 | 0.0000 |
| Path B | 4.7600 | 0.0000 | 3.3736 | 6.1464 | 0.0000 | ||||
| Path C ' | 0.0138 | 0.0019 | 0.0051 | 0.0225 | 0.0021 | ||||
| Path C | 0.0236 | 0.0000 | 0.0153 | 0.0320 | 0.0000 | ||||
| Path AB | 0.0099 | 0.0002 | 0.0067 | 0.0134 | 0.0002 | ||||
| 43 | Handgrip Strength | VSPLOT_ACC | FS_R_Entorhinal_Area | Path A | 0.0315 | 0.0000 | 0.0242 | 0.0387 | 0.0000 |
| Path B | 0.1919 | 0.0000 | 0.1173 | 0.2665 | 0.0000 | ||||
| Path C ' | 0.0176 | 0.0001 | 0.0090 | 0.0262 | 0.0001 | ||||
| Path C | 0.0236 | 0.0000 | 0.0153 | 0.0320 | 0.0000 | ||||
| Path AB | 0.0060 | 0.0001 | 0.0034 | 0.0088 | 0.0001 | ||||
| 44 | Handgrip Strength | VSPLOT_ACC | FS_R_Putamen_Vol | Path A | 240.8800 | 0.0000 | 200.2828 | 281.4771 | 0.0000 |
| Path B | <0.0001 | 0.0000 | 0.0000 | 0.0001 | 0.0000 | ||||
| Path C ' | 0.0141 | 0.0018 | 0.0053 | 0.0230 | 0.0020 | ||||
| Path C | 0.0236 | 0.0000 | 0.0153 | 0.0320 | 0.0000 | ||||
| Path AB | 0.0095 | 0.0002 | 0.0060 | 0.0133 | 0.0002 |
Notes. Cardiorespiratory fitness was assessed using the NIH Toolbox 2-minute Walk Endurance Test. Handgrip strength was assessed using the NIH Toolbox Grip Strength Test. Path A, the direct relationship between the predictor variable and the mediator variable; Path B, the direct relationship between the mediator variable and the outcome variable; Path C’, the direct effect of the predictor variable on the outcome variable in the presence of the effects of mediator; Path AB, the indirect effect of a predictor variable on the outcome variable via the mediator; Path C, the total effect of a predictor variable on the outcome variable, including both direct and indirect effects.).
Abbreviations. CardSort, NIH Toolbox Dimensional Change Card Sort Test; ListSort, NIH Toolbox List Sorting Working Memory Test; VSPLOT_ACC, Variable Short Penn Line Orientation: Accuracy; DDisc_AUC_200, Delay Discounting: Area Under the Curve for Discounting of $200; DDisc_AUC_40 K, Delay Discounting: Area Under the Curve for Discounting of $40,000; ReadEng, NIH Toolbox Oral Reading Recognition Test; PicVocab, NIH Toolbox Picture Vocabulary Test; CogFluidComp, NIH Toolbox Cognition Fluid Composite; Flanker, NIH Toolbox Flanker Inhibitory Control and Attention Test; SCPT_SPEC, Short Penn Continuous Performance Test: Specificity; FS_L_Caudalmiddlefrontal_Thck, left caudal middle frontal average thickness; FS_R_Insula_Thck, right insula average thickness; FS_L_Entorhinal_Area, left the entorhinal surface area; FS_L_Posteriorcingulate_Area, left posterior cingulate surface area; FS_L_Precentral_Area, left precentral surface area; FS_L_Pericalcarine_Area, left peri calcarine surface area; FS_R_Inferiorparietal_Area, right inferior parietal surface area; FS_R_Middletemporal_Area, right middle temporal surface area; FS_R_Precentral_Area, right precentral surface area; FS_R_Inferiortemporal_Area, right inferior temporal surface area; FS_R_Pericalcarine_Area, right peri calcarine surface area; FS_R_Entorhinal_Area, right entorhinal surface area; FS_L_Hippo_Vol, left hippocampus volume; FS_R_Hippo_Vol, right hippocampus volume; FS_R_Putamen_Vol, right putamen volume; LLCI, lower limit of 95 % confidence interval; ULCI, upper limit of 95 % confidence interval.).
Our mediation analyses also revealed statistically significant indirect effects of brain structure measures in the associations between handgrip strength and four cognitive measures (Table 1). The left and right peri calcarine surface areas mediated the relationship between handgrip strength and cognitive flexibility and between handgrip strength and inhibitory control (mediated proportions = 31.03 %, 33.70 %, 37.05 %, 37.05 %; FDR corrected, p < 0.05). The right insula average thickness mediated the association between handgrip strength and sustained attention performance (specificity) (mediated proportion = 29.63 %; FDR corrected, p < 0.05). The relationship between handgrip strength and spatial orientation (accuracy) was mediated by the bilateral entorhinal surface areas and the right putamen volume (mediated proportions = 41.95 %, 25.42 %, 40.25 %; FDR corrected, p < 0.05).
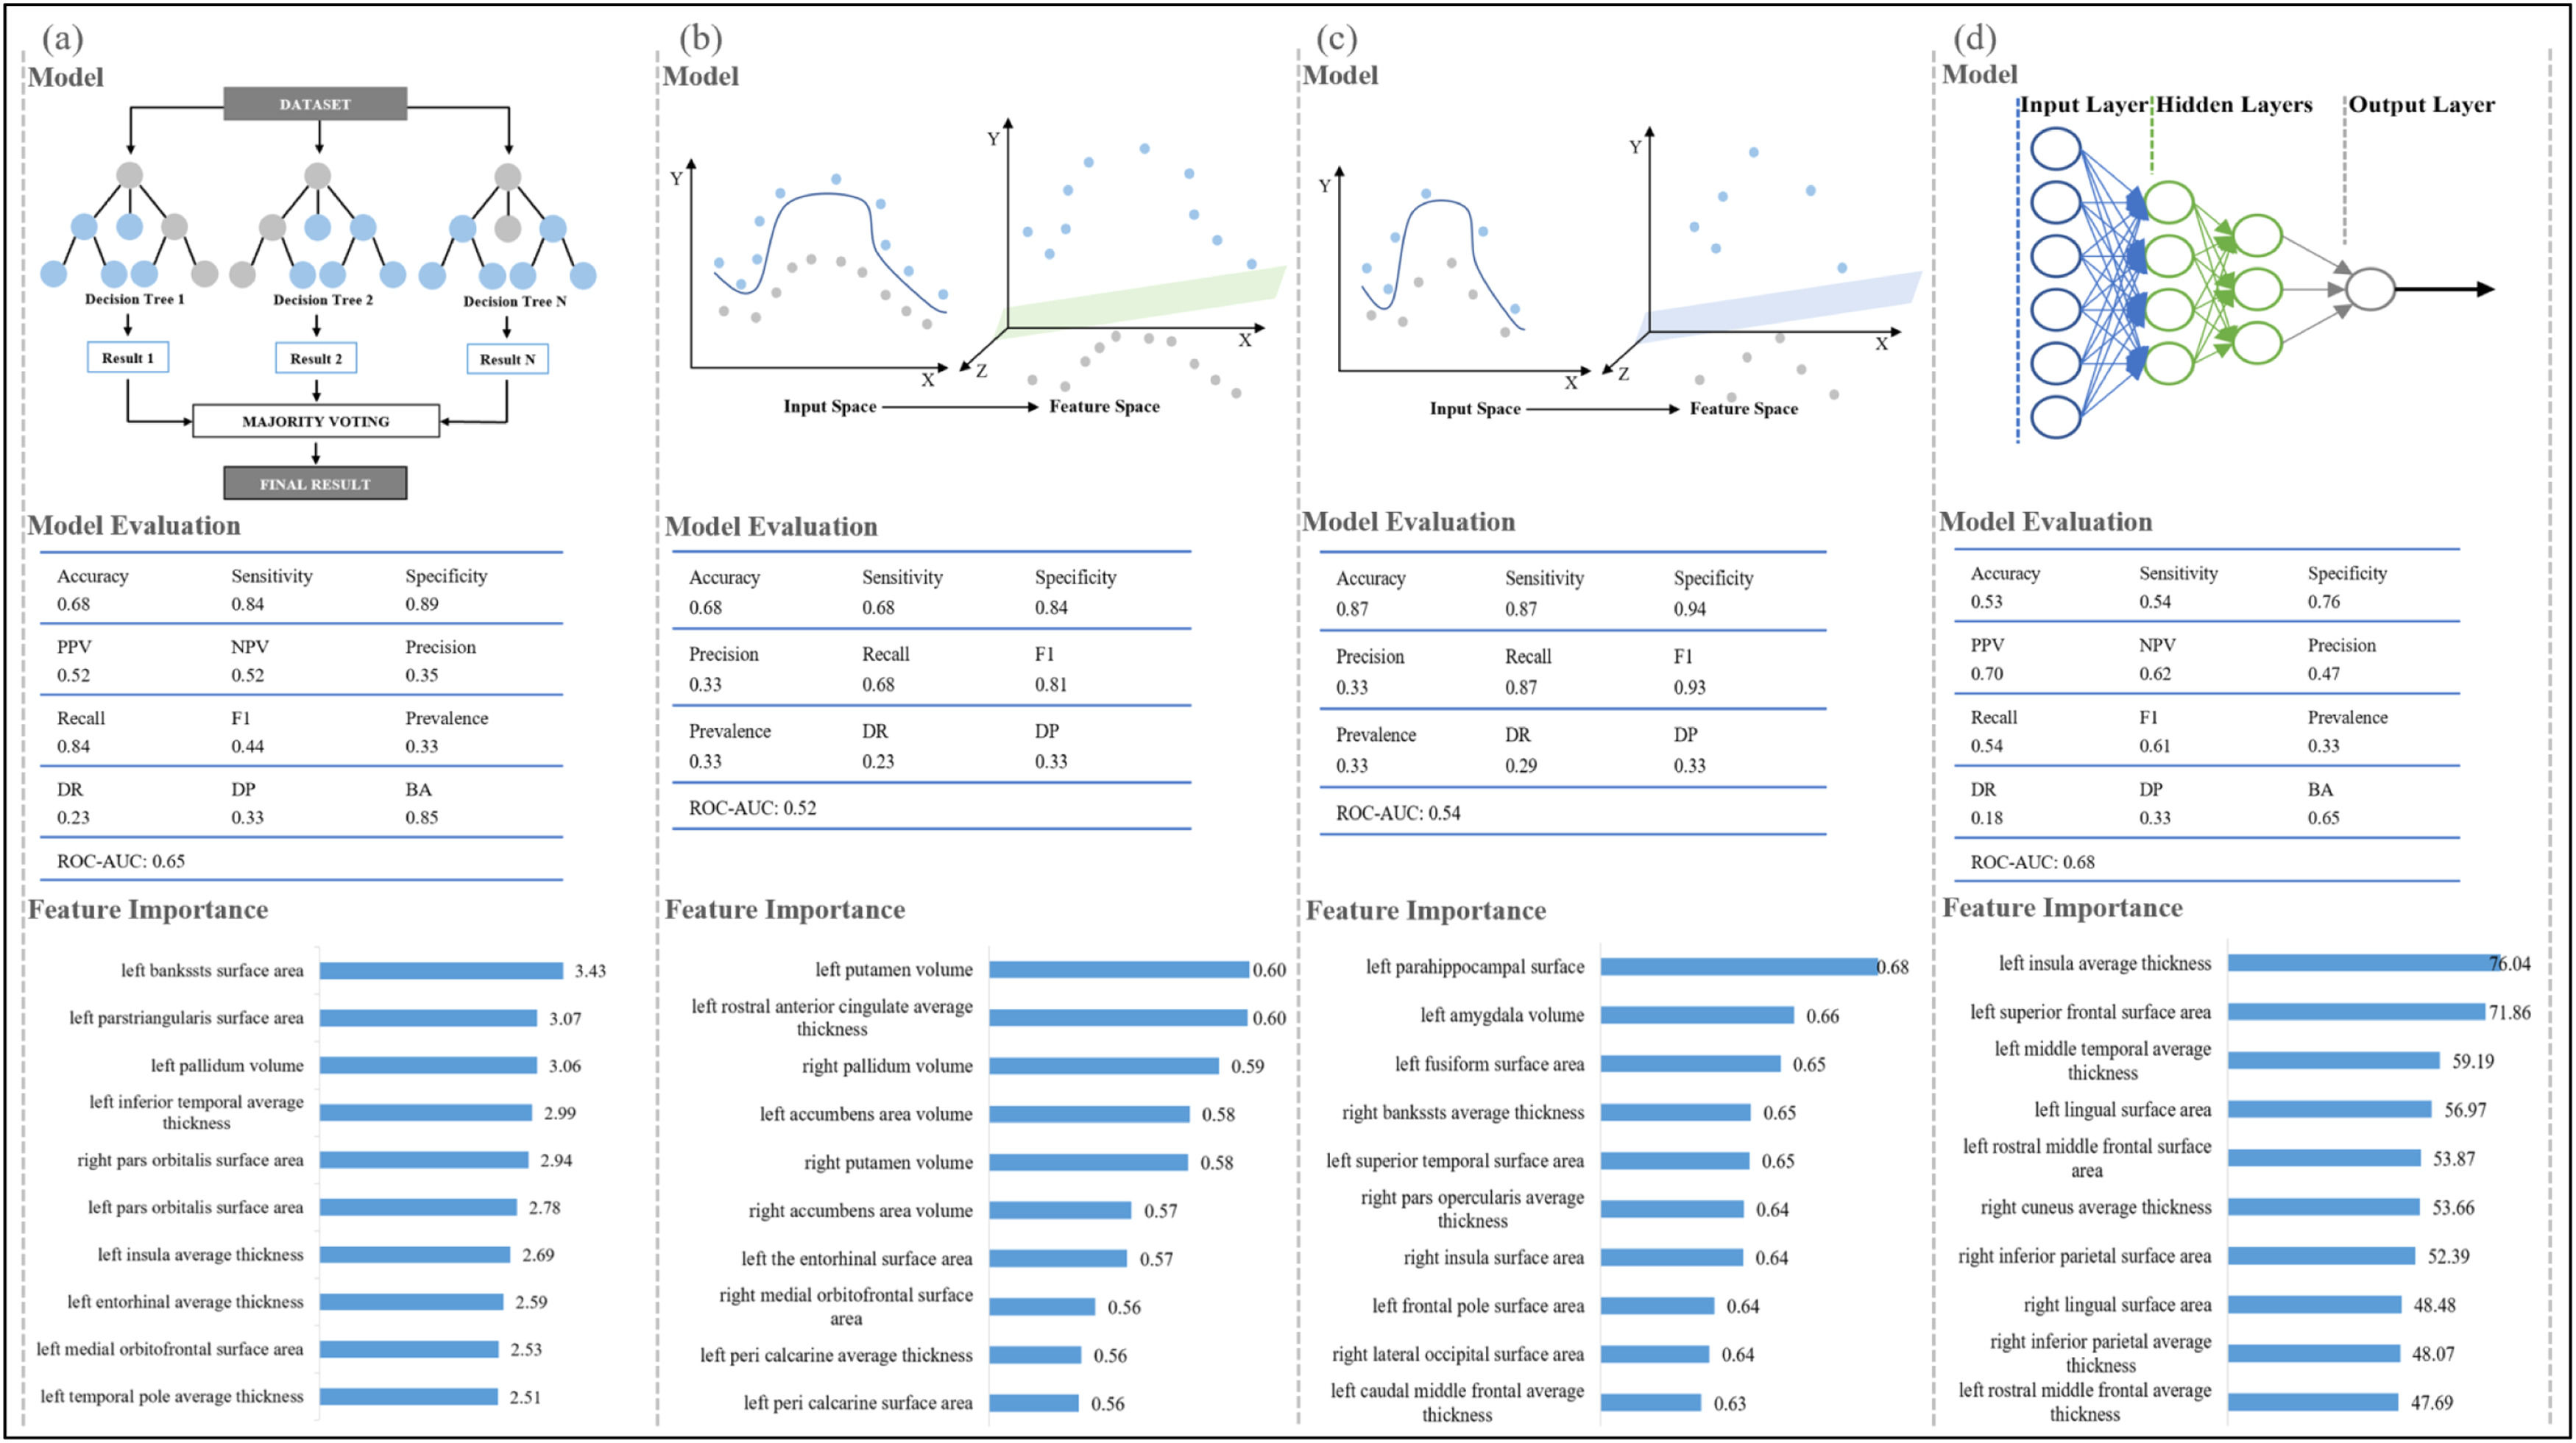
Machine-learning algorithms in distinguishing samples at different levels of motor functionsIn this study, we compared three widely used machine-learning classifiers to identify the optimal one, and the classifier with the best performance was illustrated for each motor function in Fig. 4. For cardiorespiratory fitness, 49 participants were below the national average level, 609 participants were at the national intermediate level, and 252 participants were above the national average level, included in our random forest model analysis (accuracy, 0.68; sensitivity, 0.84; specificity, 0.89) (Fig. 4 and Appendix H). The SVM with radial kernel model performed best among all the tested models for gait speed (148, 621, and 141 participants below/at/above the national average; accuracy, 0.68; sensitivity, 0.68; specificity, 0.84) and hand dexterity (60, 791, and 59 participants below/at/above the national average; accuracy, 0.87; sensitivity, 0.87; specificity, 0.94). The artificial neural network model indicated an excellent ability to discriminate handgrip strength of different levels among the tested models (215, 376, and 319 participants below/at/above the national average; accuracy, 0.53; sensitivity, 0.54; specificity, 0.76). To further estimate the contribution of the features in each model, the importance of brain structure measures was ranked as shown in Fig. 4 and Appendix H. Differences in the characteristics of the populations at three levels of each motor function are shown in Appendix I and the details for all other tested classifiers are provided in Appendix H.
![Machine-learning classifiers for motor functions. Note 1. Figure a-d show the recommended classifier, model evaluation, and feature importance of brain structure measures for each motor function. Figure a, random forest model for cardiorespiratory fitness; Figure b, support vector machine with radial kernel for gait speed; Figure c, support vector machine with radial kernel for hand dexterity; Figure d, artificial neural network model for handgrip strength.) Note 2. for machine learning classifiers. Random forest classifier, a meta-estimator that fits multiple decision tree classifiers on subsamples from the dataset and uses averaging; Support vector machine with radial kernel classifier, a classifier that does nonlinear transformations according to the features and maps data from original space to a higher-dimensional space; Artificial neural network classifier, a classifier works based on artificial neural structure and is composed of three layers including input layer, hidden layer, and output layer.) Note 3. for model evaluation. Accuracy, the number of correct classifications divided by all types of classifications; Sensitivity, the true positive rate; Specificity, the proportion of correct identification of actual negatives; Positive predictive value, Negative predictive value, Precision, the proportion of correct positive classification; Recall, the proportion of correct positives; F1, the harmonic mean of precision and recall; Prevalence, the number of positives divided by the number of positives and negatives; Detection rate, the proportion of correct detections; Detection prevalence, the number of positive detections divided by the number of positive and negative detections; Balance accuracy, the arithmetic mean of sensitivity and specificity; Area under the receiver operating characteristic curve, the entire two-dimensional area underneath the receiver operating characteristic curve, which probably measures the performance across all classification thresholds. It is worth noting that the metrics of model evaluation [except accuracy] represent the average performance of three groups.) Note 4 for feature importance. The feature importance represents the contribution of each brain structure measure in the classification, with a higher value indicating a more significant contribution.) Abbreviations. PPV, positive predictive value; NPV, negative predictive value; DR, detection rate; DP, detection prevalence; BA, balanced accuracy; ROC-AUC, the area under the receiver operating characteristic curve.).](https://static.elsevier.es/multimedia/16972600/0000002400000003/v5_202411250749/S1697260024000632/v5_202411250749/en/main.assets/gr4.jpeg?xkr=ue/ImdikoIMrsJoerZ+w997EogCnBdOOD93cPFbanNensa1rW+zY7MJT+xyAusAd1eWSWVsld5nw/a67MxcQhCEMM2i1CV6qumZGJ0M7jjFysrLJ5QeiW7RzNNLWY0mpKgZ636k3fCq00dBkBbaOYyHBKyisBoN3MH+NDP6TEFdFt7Yv394AY7GHqsOnzrhH7XW2C9jQ02zLZE47Bn0gGAnSRBKoxA0oG4MrajvMyBzsuWBoysaZs1sSoWUIpWCHNxMDz0O3ua4LcFjl4uAoi7LmifeoCe9yvjpFAjJALHM= "Machine-learning classifiers for motor functions. Note 1. Figure a-d show the recommended classifier, model evaluation, and feature importance of brain structure measures for each motor function. Figure a, random forest model for cardiorespiratory fitness; Figure b, support vector machine with radial kernel for gait speed; Figure c, support vector machine with radial kernel for hand dexterity; Figure d, artificial neural network model for handgrip strength.) Note 2. for machine learning classifiers. Random forest classifier, a meta-estimator that fits multiple decision tree classifiers on subsamples from the dataset and uses averaging; Support vector machine with radial kernel classifier, a classifier that does nonlinear transformations according to the features and maps data from original space to a higher-dimensional space; Artificial neural network classifier, a classifier works based on artificial neural structure and is composed of three layers including input layer, hidden layer, and output layer.) Note 3. for model evaluation. Accuracy, the number of correct classifications divided by all types of classifications; Sensitivity, the true positive rate; Specificity, the proportion of correct identification of actual negatives; Positive predictive value, Negative predictive value, Precision, the proportion of correct positive classification; Recall, the proportion of correct positives; F1, the harmonic mean of precision and recall; Prevalence, the number of positives divided by the number of positives and negatives; Detection rate, the proportion of correct detections; Detection prevalence, the number of positive detections divided by the number of positive and negative detections; Balance accuracy, the arithmetic mean of sensitivity and specificity; Area under the receiver operating characteristic curve, the entire two-dimensional area underneath the receiver operating characteristic curve, which probably measures the performance across all classification thresholds. It is worth noting that the metrics of model evaluation [except accuracy] represent the average performance of three groups.) Note 4 for feature importance. The feature importance represents the contribution of each brain structure measure in the classification, with a higher value indicating a more significant contribution.) Abbreviations. PPV, positive predictive value; NPV, negative predictive value; DR, detection rate; DP, detection prevalence; BA, balanced accuracy; ROC-AUC, the area under the receiver operating characteristic curve.).")
Machine-learning classifiers for motor functions.
Note 1. Figure a-d show the recommended classifier, model evaluation, and feature importance of brain structure measures for each motor function. Figure a, random forest model for cardiorespiratory fitness; Figure b, support vector machine with radial kernel for gait speed; Figure c, support vector machine with radial kernel for hand dexterity; Figure d, artificial neural network model for handgrip strength.)
Note 2. for machine learning classifiers. Random forest classifier, a meta-estimator that fits multiple decision tree classifiers on subsamples from the dataset and uses averaging; Support vector machine with radial kernel classifier, a classifier that does nonlinear transformations according to the features and maps data from original space to a higher-dimensional space; Artificial neural network classifier, a classifier works based on artificial neural structure and is composed of three layers including input layer, hidden layer, and output layer.)
Note 3. for model evaluation. Accuracy, the number of correct classifications divided by all types of classifications; Sensitivity, the true positive rate; Specificity, the proportion of correct identification of actual negatives; Positive predictive value, Negative predictive value, Precision, the proportion of correct positive classification; Recall, the proportion of correct positives; F1, the harmonic mean of precision and recall; Prevalence, the number of positives divided by the number of positives and negatives; Detection rate, the proportion of correct detections; Detection prevalence, the number of positive detections divided by the number of positive and negative detections; Balance accuracy, the arithmetic mean of sensitivity and specificity; Area under the receiver operating characteristic curve, the entire two-dimensional area underneath the receiver operating characteristic curve, which probably measures the performance across all classification thresholds. It is worth noting that the metrics of model evaluation [except accuracy] represent the average performance of three groups.)
Note 4 for feature importance. The feature importance represents the contribution of each brain structure measure in the classification, with a higher value indicating a more significant contribution.)
Abbreviations. PPV, positive predictive value; NPV, negative predictive value; DR, detection rate; DP, detection prevalence; BA, balanced accuracy; ROC-AUC, the area under the receiver operating characteristic curve.).
Using the data from the WU-Minn HCP Data Release, our study investigated in an explorative manner the associations between four dimensions of motor function (i.e., cardiorespiratory fitness, locomotion [gait speed], hand dexterity, handgrip strength), twenty measures of cognitive function (i.e., utilized to determine fluid and crystallized intelligence), and three measures of brain structure (i.e., cortical thickness, surface area, and subcortical volume) in a large cohort of younger adults. In particular, we investigated whether the associations between motor functions, brain structure, and cognitive functions previously observed in older adults also extended to younger adults. In this context, we found preliminary evidence that the surface area and volume differences in specific brain regions can mediate the associations between motor and cognitive functions in our sample of younger adults. In addition, this study utilized different machine-learning classifiers on an explorative basis and found brain regions with high feature importance for each motor function, which could be helpful in identifying younger adults with below-average motor and cognitive functions.
More specifically, in our sample of young adults, cardiorespiratory fitness and hand dexterity were positively associated with fluid and crystallized intelligence, whereas gait speed and handgrip strength were correlated with specific measures of fluid intelligence. While a higher maximal handgrip strength was associated with better performance on cognitive flexibility, inhibitory control, sustained attention, and spatial orientation, a higher gait speed might be associated only with better inhibitory control. These findings are partly consistent with observations in aging populations, in which higher cardiorespiratory fitness, hand dexterity, and gait speed were strongly associated with better executive function (Kobayashi-Cuya et al., 2018; ten Brinke et al., 2015; Toots et al., 2019), and greater handgrip strength was associated with better cognitive functions (e.g., prospective, explicit and numeric memory, and fluid intelligence), reduced depression and anxiety symptoms, and higher life satisfaction (Rongtao Jiang et al., 2022). The positive associations between motor and cognitive functions might be related to several factors, including but not limited to: (1) regular physical exercise involving motor function training can increase important processes that contribute to cognitive health such as blood flow to the brain, or release of neurotrophic factors (Kramer & Colcombe, 2018); (2) motor learning and physical exercise can stimulate specific processes of brain plasticity, which, in turn, may improve cognitive function (Draganski et al., 2006); (3) the brain regions engaged in motor control are also involved in cognitive processes (i.e., also referred to as shared neural correlates), and such neurobiological links might facilitate essential functions (e.g., timing and planning) for both motor and cognitive tasks (Diamond, 2000); and (4) the cross-modal integration and coordination required in motor skills training might enhance cognitive processing (Weller et al., 2022). Moreover, cardiorespiratory fitness in younger adults may be positively associated with the subcortical volumes of the bilateral hippocampus and surface areas of entorhinal, cingulate, inferior parietal, inferior and middle temporal, and precentral gyri, which mirrors findings of previous studies in younger adults that higher cardiorespiratory fitness was associated with increased midfrontal (Liu et al., 2022), hippocampal (Aghjayan, Jakicic et al., 2021), and entorhinal (Whiteman et al., 2016) volumes and increased parietal surface area (Wade et al., 2020). Regarding handgrip strength, the subcortical volume of putamen showed a high positive correlation in both younger and older adults, according to findings of current and previous research (Rongtao Jiang et al., 2022). Furthermore, the findings of the present study suggest that the maximal handgrip strength of younger adults may be associated with brain regions involved in the interceptive network (e.g., cingulate, orbitofrontal, and insula gyri), which participates in basic physiological processes (e.g., respiration, and metabolism) and sensory-motor circuits (Chen et al., 2021).
Partially consistent with previous findings of older adults (Hayes et al., 2013; Verstynen et al., 2012; Voss et al., 2010), the results of the current study also suggested that brain structures mediating associations between motor (i.e., cardiorespiratory fitness and handgrip strength) and cognitive functions could be involved in the sensorimotor, default mode, salience, and limbic networks among the younger adults, which is in line with previous findings regarding the operation of brain networks (Bauer et al., 2020; Chen et al., 2021; Cheng et al., 2021; Critchley & Harrison, 2013; Dick et al., 2019; Dum et al., 2009; McCairn et al., 2016; Menon & Uddin, 2010; Paulus et al., 2019; Seidler et al., 2015; Wu et al., 2020). Specifically, the sensorimotor (e.g., precentral gyrus) and limbic (e.g., entorhinal and hippocampus gyri) networks separately contributed to somatosensory inputs (Seidler et al., 2015) and learning (McCairn et al., 2016) in the process of motor preparation. The salience network's anterior insula and cingulate cortex were responsible for multimodal sensory input and motor output (Menon & Uddin, 2010). Besides, the interoceptive networks integrated with exteroceptive sensorimotor and proprioceptive information (Dum et al., 2009), involved in emotional and cognitive processes through paralimbic cortical regions (e.g., the orbitofrontal cortex and the anterior cingulate cortex) (Critchley & Harrison, 2013), and participated in the arousal-based affective experience with the ventral salience network (Chen et al., 2021). The synchrony between the default mode networks and other networks also facilitated cognitive and motor functions (Wu et al., 2020). Notably, although previous studies in older adults observed that brain structures mediated the association between hand dexterity and gait speed and certain cognitive functions (Ljubisavljevic et al., 2019; Nadkarni et al., 2014), we did not find evidence for such a phenomenon in our sample of younger adults. The absence of such associations between these two motor functions and cognition in younger adults may be related to the fact that in younger ages other pathways might mediate such an association (e.g., cerebral vasoreactivity (Chung et al., 2018), neural connectivity (Mirelman et al., 2019), and network topology and activation patterns (Ishihara et al., 2020; Mirelman et al., 2019)), which were not assessed in the current study.
Individual-level classification in neuroimaging has extensively used supervised machine-learning algorithms, which can identify data trends and patterns, handle multi-dimensional and multi-variant data, and continuously improve the accuracy and efficiency of classification issues (Badillo et al., 2020; Uddin et al., 2019). Our study initially explored the construction of four machine-learning classifiers to discriminate young adults at different levels of cardiorespiratory fitness (random forest), gait speed (SVM with the radial kernel), hand dexterity (SVM with the radial kernel), and handgrip strength (artificial neural network). Each classifier demonstrated its superior ability on the corresponding data: the random forest did an excellent job of fitting the unbalanced and high-dimensional data with low overfitting and bias; SVM with radial kernel non-linearly mapped data from the original space to a higher-dimensional space, and the artificial neural network showed a good ability for fault tolerance and generalization (Kotsiantis et al., 2007; Osisanwo et al., 2017). The excellent performances of the machine-learning classifiers suggested that applying them has some potential to aid in the assessment of motor function and indirectly predict cognitive status in young adults. Each model's rank of feature importance provided the probability of exploring neural biomarkers to build further predictive models of motor function, serving as a step toward precision medicine. Further investigations are needed to study the relationships between brain regions with high feature importance (e.g., bankssts, pallidum, insula, entorhinal, and medial orbitofrontal gyri), motor, and cognitive functions in more depth.
This study has several practical implications that are worth highlighting. First, the current study investigated the potential associations between motor functions (i.e., cardiorespiratory fitness and hand dexterity) and general cognitive functions, between gait speed and inhibitory control, and between handgrip strength and cognitive flexibility, inhibitory control, sustained attention, and spatial orientation. The findings may underscore the importance of considering motor functions as a potential predictor of cognitive status in younger adults. Applying such an approach in practice might facilitate an earlier start of physical exercise interventions which ultimately contribute to superior long-term cognitive health and well-being of younger adults with inferior motor and cognitive functions. Second, the findings of the current study suggested that even in younger adults, specific brain structures may potentially mediate the associations between motor functions, including cardiorespiratory fitness (e.g., regions related to default mode, sensorimotor, and limbic networks) and handgrip strength (e.g., regions associated with the salience and limbic networks), and general cognitive functions. This observation may trigger further investigations of potential shared neural circuits and pathways between motor and cognitive functions. Third, through multidimensional data analysis, this study examined three different machine-learning models for classifying the level of motor functions and offered comprehensive metrics for model evaluation. The excellent performance of the machine-learning classifiers observed in the current study demonstrated their potential as intelligent classification tools to help practitioners to make more objective and efficient decisions when aiming to identify individuals with below-average motor and cognitive functions to offer them tailored interventions (e.g., physical exercises). Brain regions with high feature importance for each motor function may be neural biomarkers for predicting motor and cognitive functions, although this assumption needs to be verified by future studies.
Some limitations of the current study should also be acknowledged. First, the results of this cross-sectional study suggest that specific motor functions are associated with specific aspects of cognitive function. However, due to the unavailability of longitudinal data in the present study, we were not able to investigate the temporal characteristics of these relationships or potential neurobiological mechanisms driving our observations. Thus, future studies with larger sample sizes should be conducted including both cross-sectional and longitudinal data assessments (i) to verify and extend our findings, (ii) to investigate whether potential associations between motor functions, brain structure (and also pattern of functional connectivity), and cognitive functions change as a function of time, and (iii) to elucidate the neurobiological mechanisms that drive the positive associations between motor function and cognitive functions. Second, this study examined and compared three common machine-learning algorithms (e.g., random forest, SVM, and artificial neural network) to identify appropriate classifiers for differentiating populations at different levels of each motor function (i.e., cardiorespiratory fitness, locomotion [gait speed], hand dexterity, and handgrip strength). With the development of artificial intelligence and machine-learning algorithms, there may be models with better characteristics and performance, so advanced techniques should be used in future studies to achieve better predictions. Third, the associations, patterns of statistical mediation, and machine-learning classifiers obtained in the current study were derived from HCP data and were not further validated in other datasets, which may limit the generalizability and applicability of the research findings to different cohorts. For further generalization and application, the characteristics of the participants in this study have been provided according to their corresponding levels of each motor function (Appendix I). Fourth, due to the limited information provided by the HCP database, the influences of socio-cultural factors (i.e., religion, beliefs, values, social classes, and attitudes) (Hatano & Wertsch, 2001) and personality (Smith et al., 2017) on the research results were not fully controlled, which should be considered in future studies. Fifth, Although the NIH Toolbox 2-Minute Walk Endurance Test is a widely used tool for assessing cardiorespiratory fitness, it is acknowledged as a relatively imprecise measure. More comprehensive evaluations may provide a more accurate and nuanced assessment of fitness levels. Sixth, eye-based measures constituting an economically assessable proxy of specific neurobiological processes may offer a unique alternative for studying the associations between motor and cognitive function in settings with fewer resources (Zou et al., 2023). Thus, assessing structural neuroimaging data in conjunction with eye-based metrics such as saccades, spontaneous eye blinks, pupil size, and retinal vessel diameters should be considered in future studies.
ConclusionsIn summary, this study provides initial evidence for associations between specific dimensions of motor function (i.e., cardiorespiratory fitness, locomotion [gait speed], hand dexterity, and handgrip strength) and several cognitive functions (e.g., measures of fluid and crystallized intelligence) in younger adults that needs to be substantiated by future research. Moreover, statistically significant associations were observed between measures of motor functions, including cardiorespiratory fitness and handgrip strength, and measures of brain structure involved in the default mode, sensorimotor, salience, lateral visual, interoceptive, and limbic networks. Brain structures involved in the default mode, sensorimotor, and limbic networks can mediate the positive associations between cardiorespiratory fitness and domains of cognitive function (e.g., flexibility, working memory, spatial orientation, impulsivity, reading decoding, and vocabulary comprehension). Brain structures related to salience and limbic networks can mediate the positive associations between handgrip strength and four measures of cognitive functions (e.g., flexibility, inhibition, attention, and spatial orientation). Furthermore, the applying machine-learning classifiers seems to be promising to differentiate younger adults at different levels of each motor function. The feature importance of brain regions has been preliminarily ranked for each motor function, which may help to select regions of interest and build predictive models in further research of motor and cognitive function.
CRediT authorship contribution statementQian Yu: Methodology, Data curation, Formal analysis, Visualization, Writing – original draft. Zhaowei Kong: Conceptualization, Methodology, Funding acquisition, Project administration, Supervision, Resources. Liye Zou: Conceptualization, Methodology, Funding acquisition, Project administration, Supervision, Resources. Fabian Herold: Methodology, Writing – original draft. Sebastian Ludyga: Methodology, Writing – original draft. Zhihao Zhang: Formal analysis. Meijun Hou: Formal analysis. Arthur F. Kramer: Writing – review & editing. Kirk I. Erickson: Writing – review & editing. Marco Taubert: Writing – review & editing. Charles H. Hillman: Writing – review & editing. Sean P. Mullen: Writing – review & editing. Markus Gerber: Writing – review & editing. Notger G. Müller: Writing – review & editing. Keita Kamijo: Writing – review & editing. Toru Ishihara: Writing – review & editing. Robert Schinke: Writing – review & editing. Boris Cheval: Writing – review & editing. Terry McMorris: Writing – review & editing. Ka Kit Wong: Formal analysis. Qingde Shi: Supervision, Writing – review & editing. Jinlei Nie: Supervision, Writing – review & editing.
