


This study investigates the use of synthesized mesoporous carbon in the fixed bed adsorption, as a promising process, to eliminate tetracycline from wastewater. In order to study the adsorptive capability of adsorbent, particles were embedded in a laboratory-scale Pyrex glass tube. An increase in initial concentration and decrease in bed height and flow rate led to the higher adsorption capacity. The highest bed capacity of 76.97mgg−1 was obtained using 4cm bed depth, 4mLmin−1 and 50mgL−1 influent concentration. The initial part of breakthrough curve perfectly matched the Adams–Bohart model at all experimental conditions. However, it was anticipated that Yoon–Nelson model could predict the whole curve acceptably, the results showed an inaccurate fitting. Therefore, the adaptive neuro-fuzzy inference system (ANFIS) was used to predict the breakthrough curve using data series of adsorption experiments. This model indicated a good statistical prediction in terms of relative errors.

Only three percent of the water found on the earth's surface is freshwater and a large amount of that is locked up in glaciers, ice caps and permanent snow. The remaining freshwater is in groundwater, lakes and rivers which is used for agriculture, industry and so on. But regrettably, such activities can contaminate freshwater by a large variety of potentially perilous substances. The most important risk from the presence of these pollutants in surface water is the long-term harmful consequences on various ecosystems, including acute and chronic toxicity (González-Pleiter et al., 2013). In spite of successful effect of antibiotics in veterinary and human medicine treating bacterial and protozoan infections and as additives in animal foodstuffs, their residues in the water can cause antimicrobial resistance genes (ARGs), even at relatively low concentrations (Xu et al., 2016). The transformation and migration of these ARGs in the ecosystem is potentially more harmful than the antibiotic residues in the environment (Chen, Zheng, Zhou, & Zhao, 2017). According to the WHO projection, they will cause dying of 10 million people annually by 2050; consequently this threatening pollutant is considered as one of the most important health concerns of the current century (He et al., 2016). The concentrations for antibiotic residue in the hospital and pharmaceutical manufacturing wastewater have been reported usually up to 100 to 500mgL−1 (Larsson, de Pedro, & Paxeus, 2007).
Adsorption by porous materials has been widely considered to be the most promising and robust method in eliminating antibiotics from wastewater due to its low cost, simplicity, fastness, high efficiency as well as environmental friendliness (Marzbali, Mir, Pazoki, Pourjamshidian, & Tabeshnia, 2017). Furthermore, producing low-cost adsorbent by agricultural waste as a raw material, makes adsorption an operational process (Martins et al., 2015). The continuous fixed bed mode peruses the practical application of the adsorption process. Moreover, several advantages like simple operation, high yield and easy scale up from a laboratory-scale distinguish this process from batch mode adsorption (Oguz, 2013).
Common methods in chemical processes usually have limitations of complexity and nonlinearity in their systems. Among different techniques proposed to these processes, adaptive neuro-fuzzy inference system (ANFIS) is highly recommended; this is not only because it does not need governing chemical and physical laws of processes, but also due to this fact that once it is developed and trained, ANFIS model can easily predict the output of system for further designation of chemical processes (Cole, Powell, & Edgar, 2012; Pirdashti, Curteanu, Kamangar, Hassim, & Khatami, 2013; Shacham & Brauner, 2008). The neuro-fuzzy approach has recently been developed to predict Pb(II) adsorption by ostrich bone (Amiri, Abedi-Koupai, Eslamian, Mousavi, & Hasheminejad, 2013), methane adsorption on zeolites (Rezaei, Rahmati, & Modarress, 2015) and Cu(II) removal from Leachate (Turan & Ozgonenel, 2013).
Consequently, this work aims to study tetracycline removal from aqueous solution by synthesized apricot shell-activated carbon in a continuous adsorption system. We have investigated the effects of flow rate, influent concentration and bed depth on tetracycline uptake by the produced adsorbent in a laboratory scale fixed-bed column. In addition, a model based on ANFIS system has been designed to predict tetracycline adsorption as a function of empirical parameters.
2Experimental2.1MaterialsPhosphoric acid with a purity of 85% was purchased from the Merck Company. The precursor, apricot nut shell from Iranian local fruit, was chosen as a raw material for production of adsorbent. Initially the shells were cleaned and washed with hot distilled water in order to remove dust-like impurities and then were dried in air oven at 80°C for 24h. Subsequently, the shells were ground in a mill and sieved to the desired particle size (≈ 500μm). The sample kept in a closed bottle for further experiments. Hydrochloride salt of tetracycline (>97%) used in this study was purchased from Sinadaro Pharmaceutical Company (Tehran, Iran) and was used without further purification. The properties of tetracycline hydrochloride are listed in Table 1. All drug stock solutions were prepared by dissolving accurately weighed drug in high-purity water for needed concentrations.
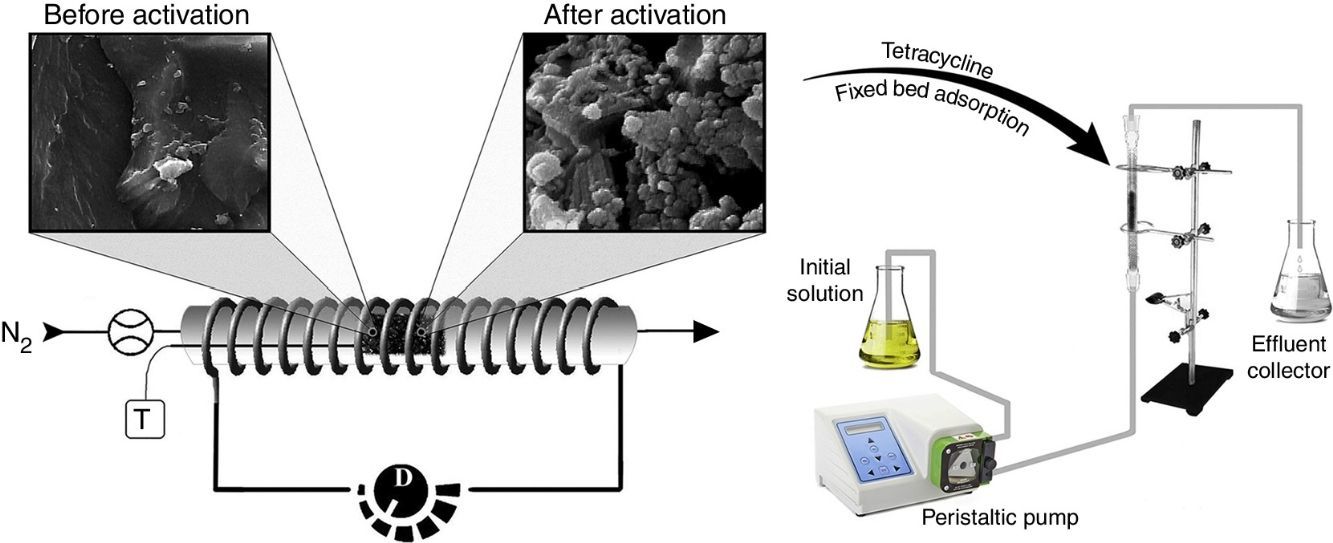
2.2Adsorbent preparation and characterizationThe nanoporous activated carbon was prepared from the carbonaceous material as follows: Firstly, the raw material (5g) was immersed into the prepared phosphoric acid at a 1:1 impregnation weight ratio under magnetic stirring for 24h, and then the mixture was dried in oven at 100°C for 2h. The dried mixture was placed in an electrical furnace with a length of 25cm and a diameter of 3cm, which was heated at the rate of 7°Cmin−1 until it reached 400°C, and then maintained for 90min under nitrogen flow of 200mLmin−1. After the activation, the sample was cooled down to room temperature and was washed several times with hot distilled water until the filtrated solution reached pH 6.5. This was done to remove the remaining phosphoric acid and also other inorganic species that might be formed during the process (Martins et al., 2015). Finally, the sample was placed in an air oven (at 80°C for 24h) for complete drying. The comprehensive description of production stages was presented in our previous study (Marzbali, Esmaieli, Abolghasemi, & Marzbali, 2016). The activated carbon yield was calculated based on following equation:
where WAC (g) is the dry weight of final activated carbon and WAS (g) is the dry weight of apricot stone.
The produced adsorbent was characterized by several analyzes. The Brunauer–Emmett–Teller (BET) method was applied to study the surface area and porosity of activated carbon. This analysis was carried out by N2 adsorption–desorption isotherms at 77K using Quadra Chrome adsorption instrument. The surface area was calculated by linear part of BET plot in the relative pressure ranged between 0.05 and 0.25. Moreover, the microscopic features of the raw material and derived adsorbent were studied by the Field Emission Scanning Electron Microscopy (FE-SEM).
2.3Fixed bed column experimentsThe fixed-bed mode is more similar to practical wastewater treatment and presents useful adsorption properties of a newly developed adsorbent. The fixed bed adsorption experiments were carried out in a laboratory-scale glass column with an inner diameter of 5mm and 20cm of length. The prepared adsorbent was packed in the column, with glass wool layer at both ends of the bed to ensure a good liquid distribution. It should be noted that tetracycline adsorption by glass wool is inconsiderable. The drug stock solution was pumped into the bed in an upward direction using a peristaltic pump (Fig. 1). The experiments were done at different bed heights (2–6cm), influent tetracycline concentrations (20–80mgL−1) and influent flow rates (4–8mLmin−1). The pH of inlet solution was set at 5, as an optimum value, which was obtained in our previous study (Marzbali et al., 2016). After beginning the process, the effluent sample was collected at regular time intervals, centrifuged at 3000rpm for 1h and then analyzed to obtain effluent concentration. For analysis, several specified concentrations of tetracycline were placed in the UV–vis spectrophotometer and their relevant percentage of light absorbance were determined at wavelength (ymax) of 274nm. Afterwards, an accurate calibration curve was obtained. The unknown tetracycline solution was placed in UV–vis spectrophotometer and its light absorbance was read. Finally, its concentration was easily calculated using calibration curve.
2.4Column data analysis
The laboratory scale column was used to measure the parameters before applying the process to an industrial column. The experimental results were analyzed and then breakthrough curves were drawn. These curves indicate the loading behavior of tetracycline to be removed from solution in a fixed bed column (Nazari, Abolghasemi, Esmaieli, & Pouya, 2016). The area under the breakthrough curve was obtained by integrating the plot of adsorbed concentration (Cad;mgL−1) versus t (min). This can be used to calculate the quantity of tetracycline qtotal(mg) retained in the column for a given inlet concentration and flow rate (Eq. (2)).
where C0 and Ct are influent and effluent antibiotic concentrations (mgL−1) respectively. Equilibrium adsorption capacity, qeq(mgg−1), is defined by Eq. (3) as the total amount of adsorbed (qtotal) per dry weight of adsorbent in the column (w) at the end of process (Luo, Deng, Lin, & Zhang, 2011):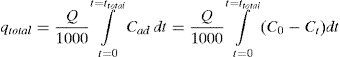

The total amount of tetracycline (mtotal) pumped into the column is obtained as following:

And finally, the removal percentage of tetracycline from aqueous solution can be calculated as
2.5Kinetic models of fixed bed column adsorption
In this study, data collected during laboratory tests were used as the basis for industrial applications. The rate of adsorption was studied by employing Adams–Bohart and Yoon–Nelson models to predict the dynamic behavior of fixed-bed column.
2.5.1Adams–Bohart modelAdams–Bohart model is based on the surface reaction theory and describes the initial part of the breakthrough curve (Chu, 2010). The model equation is the following:
where C0 and Ct (mgL−1) are the inlet and effluent tetracycline concentrations, kAB (Lmg−1min−1) is the mass transfer coefficient, t (min) is the service time, N0 (mgL−1) is the saturation concentration, U0 (cmmin−1) is the linear velocity calculated by dividing the flow rate by the column cross-sectional area, and Z (cm) is the bed depth.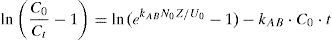
Because of much larger value of exponential term, this term can be simplified as:

And also the concentration ratio is considered to be low (Ct≪0.1C0):

Therefore the ultimate equation of Adams–Bohart model becomes (Trgo, Medvidovic, & Peric, 2011):

The model parameters are obtained from the intercept and slope of a linear plot of ln(Ct/C0) against t.
2.5.2Yoon–Nelson modelYoon and Nelson developed a relatively simple theoretical model. Theory of this model is: the rate of probability decrease in adsorption for each adsorbate molecule is proportional to the probability of the adsorbate adsorption and the probability of adsorbate breakthrough on the adsorbent (Yoon & Nelson, 1984). With considering A and P as the fractions of adsorbed solute in the bed, and the fraction of remained drug in the effluent respectively, the model equation for a single component system can be written as follows:
where kYN (min−1) is the rate velocity constant, and τ (min) is the time required for 50% adsorbate breakthrough (i.e. Ct/C0≈0.5). With replacing P=1−A and considering A=0.5 at time τ as the initial condition, integration of Eq. (10) gives the final form of Yoon–Nelson model:From the linear dependence of ln[Ct/(C0−Ct)] versus t, the model parameters can be determined.3Results and discussion3.1Characterization of adsorbent

The yield of activated carbon was calculated and the value obtained was 26.16%. The experimental data of N2 adsorption–desorption were plotted based on P/Va(P0−P) versus P/P0 (Fig. 2), which shows a linear part in the initial region. The specific surface area can be calculated using slope and intercept of BET equation in the relative pressure range of 0.05≤P/P0≤0.25, which is extensively reported in literature (Xu, Cheng, Cao, & Yu, 2015; Yu, Wang, Low, & Xiao, 2013); this range is used because of its closeness to completed monolayers. In other words, the most accurate measurement of specific surface area happens when only one layer of N2 molecules occupy the interior pores of material. Therefore, this range was chosen because of providing high probability of monolayer adsorption in the lower relative pressures. Furthermore, the selection of the relative pressure range should fulfill two different criteria: first, the linear portion should have a positive intercept value; otherwise the obtained parameters would be meaningless. Second, the term Vm(P0−P) has to constantly increase by increasing P/P0. However these criteria limit the whole relative pressure range to the mentioned range (0.05≤P/P0≤0.25) and seems logical and consistent, it cannot be claimed that it is able to calculate the actual specific surface area (Rouquerol, Llewellyn, & Rouquerol, 2007).

Consequently, after obtaining the slope (s) and intercept (i) of the linear part in the mentioned range, monolayer volume (vm) and constant (C) are determined. Afterwards, the specific surface area is calculated as follows: SBET=(vm/V)NA⋅Ax/w=307.603 m2 g−1; Where vm is the monolayer volume, V is the molar volume of nitrogen (34.65cm3mol−1), NA is the Avogadro's number (6.022×10²³), Ax is the cross-sectional area of liquid nitrogen at 77K (0.162nm2) and w is the sample weight. Total pore volume, as the volume of adsorbed liquid nitrogen at P/P0=0.95, was obtained 0.443cm3g−1, consisted of 61% mesopores, and 39% micropores. The average pore diameter of prepared activated carbon was calculated 1.957nm by BJH equation. According to International Union of Pure and Applied Chemistry (IUPAC) classification, the shape of N2 adsorption–desorption isotherms demonstrated type II, which is known as having high percentage of mesopores; this is in agreement with the data mentioned above. The nanoporous materials are categorized into three types: micropores (<2nm diameter), mesopores (2–50nm diameter) and macropores (>50nm diameter).
FE-SEM micrographs in Figure 3 show the surface morphology of the precursor and derived activated carbon. Large and well-developed pores on the surface of the activated carbon reveals the dehydrating action of the activation agent which resulted in more adsorption. In other words, phosphoric acid created a well-connected network of pores in the adsorbent particles during activation process, and tremendously increased the number of active site for adsorbing tetracycline molecules. It is worth mentioning that every adsorption process involves three main steps: First, migration of solute molecules from the solution to the boundary layer of adsorbent particle (known as external mass transfer). Second, diffusion of adsorbate molecules to the surface and interior pores of adsorbent particles (intra-particle diffusion). Third, physical or chemical attachment of these penetrated molecules to the active sites (adsorption). Accordingly, the more adsorption sites, the higher adsorption capacity.
3.2Effect of bed height precursor and (b) derived adsorbent.")
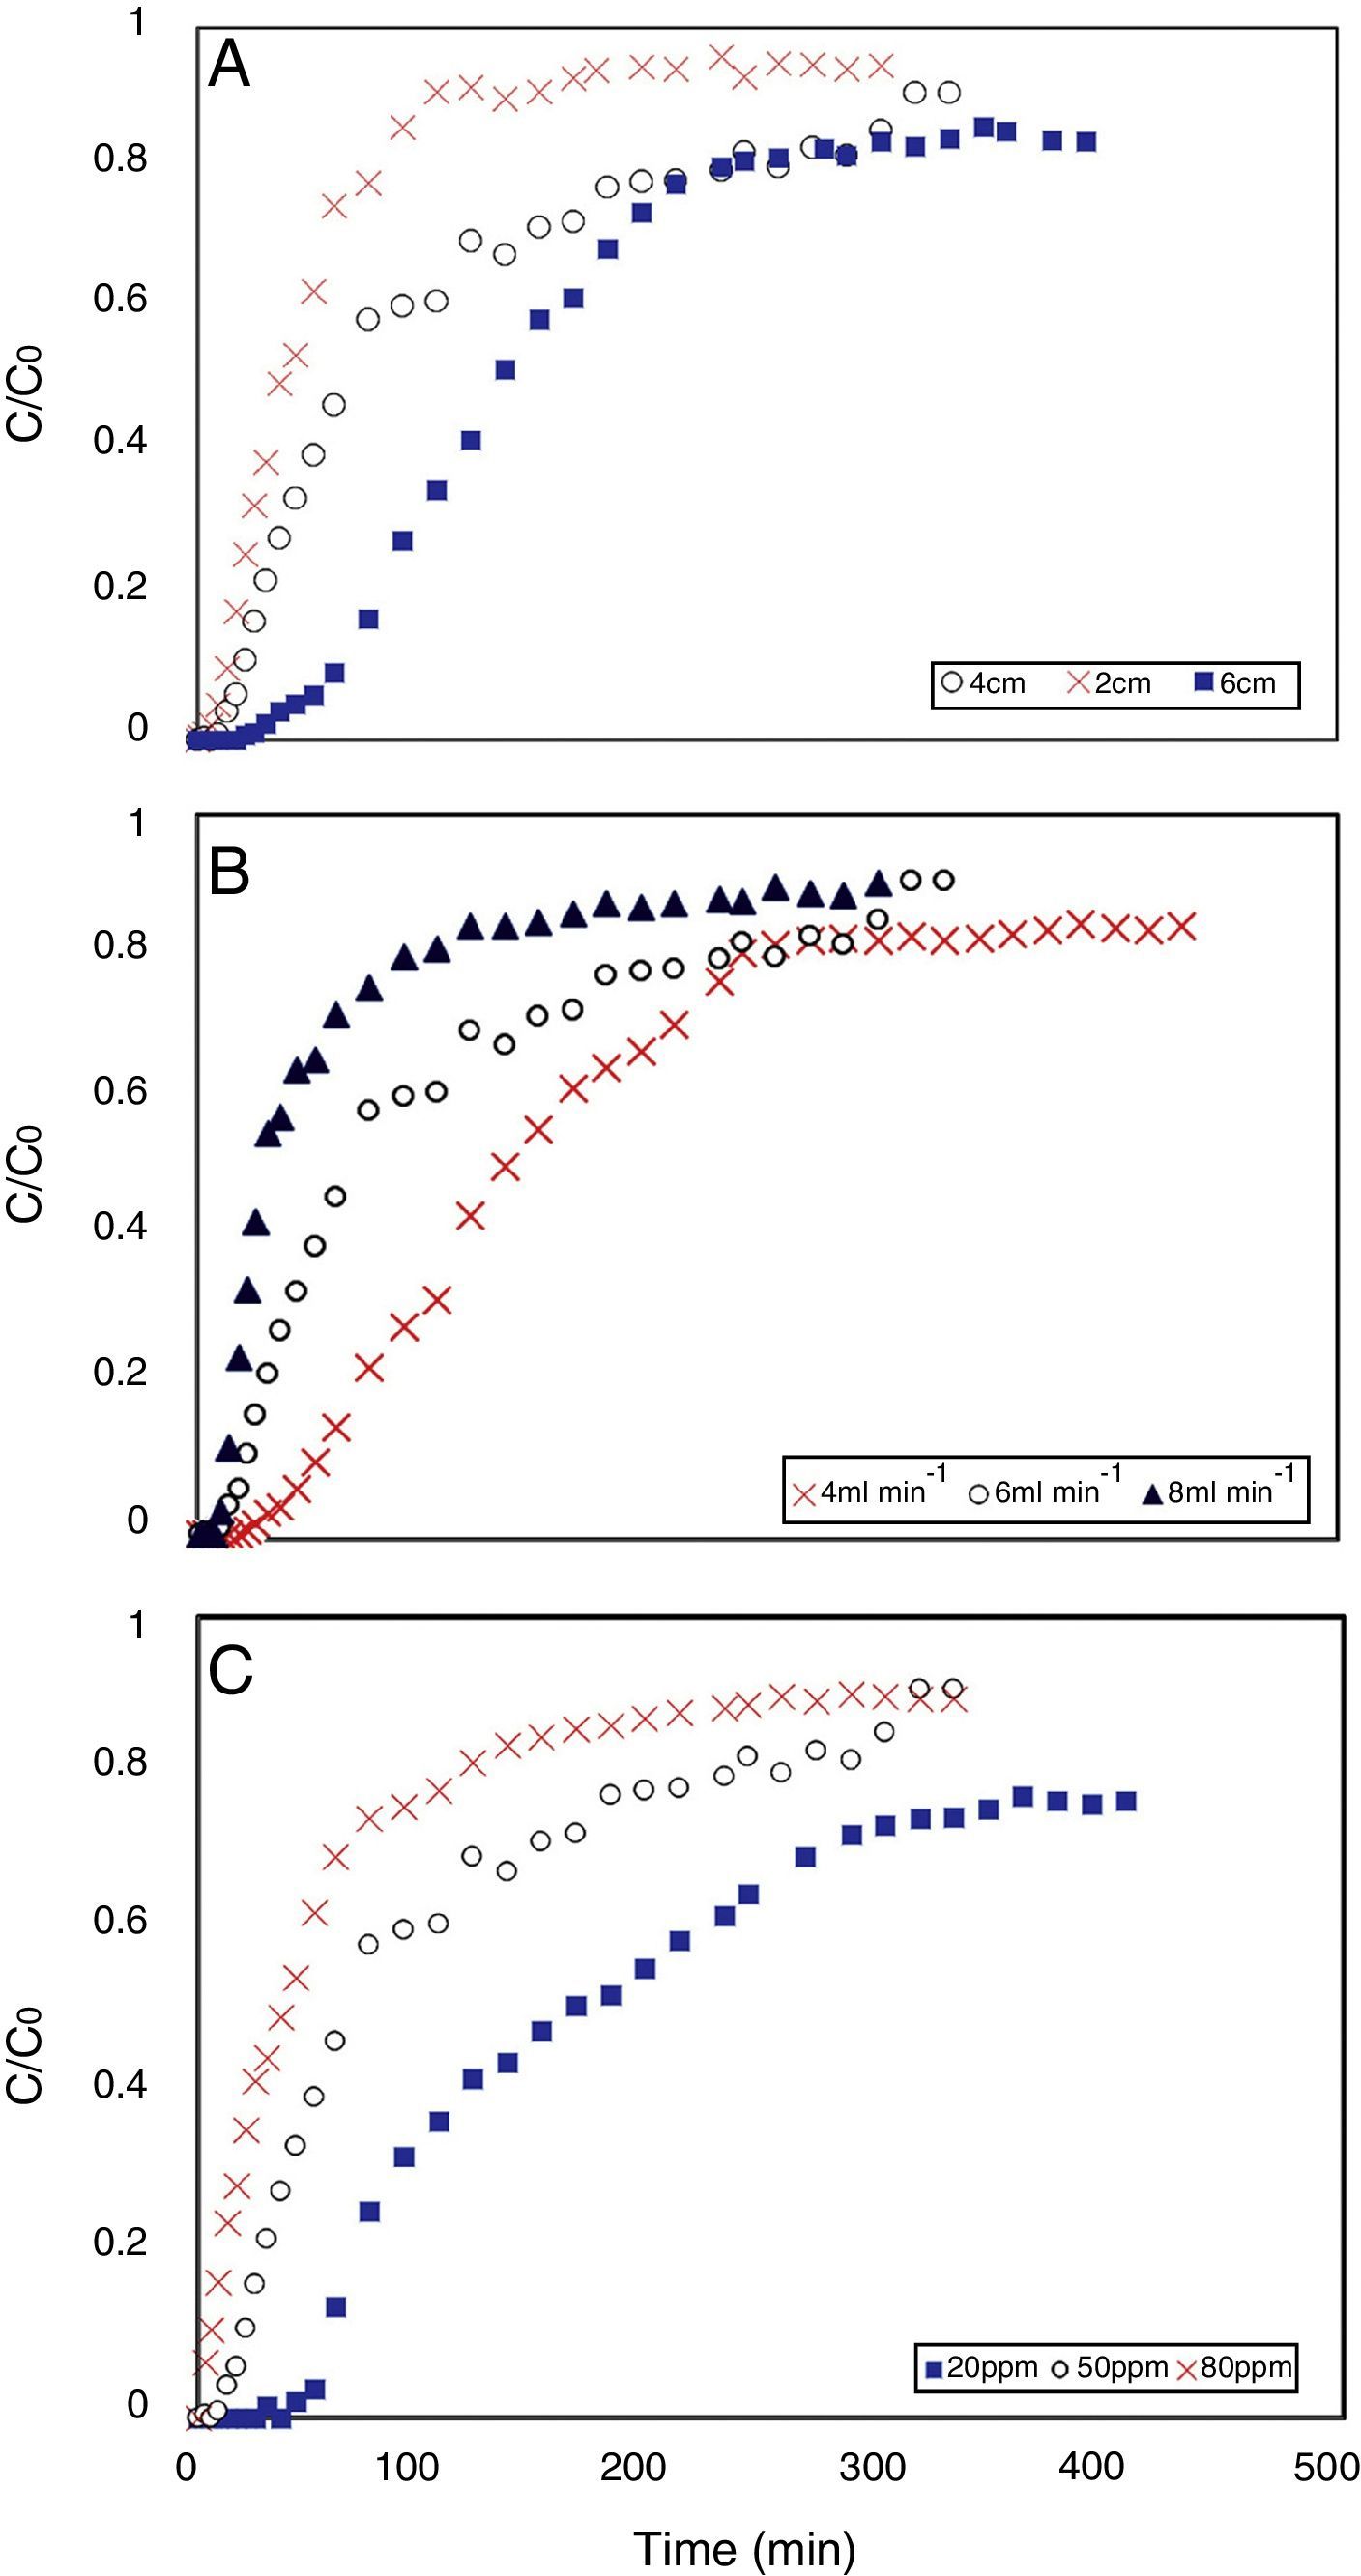
Figure 4(a) shows a typical S-shape graph, known as breakthrough curve, obtained for adsorption of tetracycline on the activated carbon for different bed heights of 2, 4 and 6cm (corresponding to 0.238, 0.477 and 0.715g of adsorbent), at a constant flow rate of 6mLmin−1 and inlet concentration of 50mgL−1. The parameters in fixed bed column for tetracycline adsorption by produced adsorbent are listed in Table 2. From Figure 4(a), both breakthrough time (the time that Ct/C0=0.05) and effluent volume increased with raising the bed depth. There is a term in continuous adsorption experiment so-called “exhaust time”, which is a time that adsorbent can no longer remove solute molecules, and the influent solution leaves the experimental column without any considerable treatment. This criterion is considered Ct/C0=0.9 in this study. According to the Figure 4(a), the exhaust time of 2, 4 and 6cm bed depth was 100, 320 and 520min (not shown in Fig. 4(a)), respectively. It increased with increasing bed height; because the higher bed depth means more adsorbent particles, or in other words more active sites for adsorption. With respect to the identical influent concentration and feed flow rate, When the bed depth increases, the adsorbate molecules have more time to diffuse into the pores of the adsorbent particles which led to increase in the number of tetracycline molecules adsorbed by the adsorbent (Taty-Costodes, Fauduet, Porte, & Ho, 2005). Accordingly, effluent volume (Veff=Q·texh.) is increased by increasing exhaust time, as a consequence of higher bed depth.
 bed height, (b) flow rate, and (c) influent concentration on the breakthrough curve of tetracycline adsorption in the column. The process conditions were: T=298K and pH=5.")
Process conditions and results for the fixed bed experiments (T=298K and pH=5).
| No. | Z (cm) | Q (mLmin−1) | C0 (mgL−1) | tb (min) | mtotal (mg) | qtotal (mg) | qeq (mgg−1) | Y (%) |
|---|---|---|---|---|---|---|---|---|
| 1 | 2 | 6 | 50 | 9 | 90 | 17.57 | 73.72 | 19.53 |
| 2 | 4 | 6 | 50 | 15 | 99 | 34.33 | 71.99 | 34.68 |
| 3 | 6 | 6 | 50 | 43 | 117 | 49.96 | 69.83 | 42.70 |
| 4 | 4 | 4 | 50 | 39 | 96 | 36.70 | 76.97 | 38.23 |
| 5 | 4 | 8 | 50 | 9 | 120 | 20.84 | 43.72 | 17.37 |
| 6 | 4 | 6 | 20 | 55 | 48.6 | 23.84 | 50.00 | 49.05 |
| 7 | 4 | 6 | 80 | 2 | 144 | 35.94 | 75.37 | 24.95 |
Interestingly, the adsorption capacity of tetracycline decreased with increasing the bed height, as it can be seen in Table 2 (rows: 1, 2 and 3). Although higher bed height provides more total surface area of adsorbent, the adsorption capacity (qeq) of tetracycline decreases; the decrease of adsorption capacity can be simply justified by two main reasons: First, all binding sites were not accessible to adsorbate molecules in higher bed height (due to overlap of active sites), and as a result, some of these particle were not effectively used (Wang, Yu, Pan, & Xing, 2009). Second, due to the channeling effect, the solution usually finds its way to crawl near the column wall, which there is more voidage, even though glass wool layer was used for liquid distribution. It is worthwhile to mention that the entire capability of adsorbent should be utilized so that it could be applied for industrial applications (the significance of adsorption capacity concept). Therefore, lower bed depth was favorable to tetracycline adsorption capacity, which was in agreement with those referred by other authors (Chen et al., 2012; Luo et al., 2011).
3.3Effect of flow rateThe effect of flow rate on the tetracycline adsorption in the column was investigated at bed height of 4cm and inlet concentration of 50mgL−1. The adsorption breakthrough curves obtained at different flow rates are shown in Figure 4(b). It was observed that an increase in flow rate significantly reduced the breakthrough time and adsorption capacity. This could be explained by the fact that at higher flow rate, tetracycline molecule had less time to diffuse into the adsorbent pores (Ahmad & Hameed, 2010). In other words, the residence time of the adsorbate in the column was not long enough to reach adsorption equilibrium at the given flow rate, and as a result, tetracycline molecules left the column without having the chance to reach the active sites of adsorbent particles. Furthermore, it is highly probable that high flow rate might desorb some of adsorbed tetracycline molecules with reversible and loose bond to the adsorbent surface. Therefore the tetracycline concentration in the effluent increased rapidly and resulted an earlier breakthrough time (Chen et al., 2012). Accordingly, the low flow rate was beneficial to tetracycline adsorption in the fixed bed, because of its higher adsorption capacity. These results were in agreement with those reported in previous studies (Han et al., 2009; Lignin et al., 2012). Bed capacity, breakthrough time and other parameters at different flow rates are presented in Table 2 (rows: 2, 4 and 5). The highest bed capacity of the prepared carbon in the present study is compared with similar works, which used activated carbon in eliminating tetracycline and other emerging pollutants. However there are a few works on continuous adsorption of tetracycline, Table 3 demonstrates that the tetracycline adsorption capacity in the present study is much higher than the capacity of other fixed bed adsorption processes in the literature.
Comparison of the highest bed capacity of the prepared activated carbon with similar works in the literature.
| Adsorbent | Adsorbate | Z (cm) | Q (mLmin−1) | C0 (mgL−1) | qe,max (mgg−1) | Reference |
|---|---|---|---|---|---|---|
| Apricot shell | Tetracycline | 4 | 4 | 50 | 76.97 | Present work |
| Oil palm shell | Methylene blue | 6 | 20 | 100 | 40.86 | Tan, Ahmad, & Hameed (2008) |
| Bamboo | Disperse orange 30 | 8 | 10 | 100 | 39.97 | Ahmad, Idris, & Hameed (2014) |
| Bamboo waste | Reactive black 5 | 8 | 10 | 100 | 39.02 | Ahmad and Hameed (2010) |
| Rice husk | Cu (II) | 8 | 10 | 10 | 34.56 | Yahaya, Abustan, Latiff, Bello, & Ahmad (2011) |
| Bamboo-charcoal | Tetracycline | 2 | 6.6 | 50 | 23.50 | Liao et al. (2013) |
The effect of different influent tetracycline concentration from 20 to 80mgL−1 at constant adsorbent bed height of 4cm and solution flow rate of 6mLmin−1 is illustrated in Figure 4(c). As expected, in higher influent concentration the adsorption process reached saturation faster and the breakthrough time was found to decrease from 55 to 2min (Table 2, rows: 2, 6 and 7). This suggests that the change of concentration affects the saturation rate and breakthrough curve. This can be due to the fact that the greater concentration gradient causes a higher driving force for the mass transfer of tetracycline molecules, and consequently the adsorption sites will be covered more quickly (Liao et al., 2013). The driving force in adsorption process is the concentration difference between the antibiotics in the solution and the antibiotics on the surface of adsorbent (Aksu & Gönen, 2004). Therefore the high driving force due to the high tetracycline concentration led to a better column performance. Also, it was observed that the adsorption capacity was not proportionally increased with increasing influent concentration. As a result, adsorption capacity of tetracycline was higher when inlet concentration increased.
3.5Evaluation of applied kinetic modelsThe empirical models by Adams–Bohart and Yoon–Nelson were utilized for mathematical simulation of experimental data in a continuous adsorption process. Adams–Bohart model was first used for gaseous application and recently has been employed to apply for liquid involved processes. With respect to Eq. (9), obtained in low concentration range, parameters of this model should be assigned to the initial part of breakthrough curve. The results for Adams–Bohart model parameters and related coefficients of correlation, R2, values are shown in Table 4. High R2 values show a good fitting of the model to the experimental data. The initial part of process is dominantly controlled by intra-particle diffusion mechanism. This is because of extremely high concentration driving force in liquid–solid mass transfer, which provides relatively high external mass transfer; therefore, intra-particle diffusion mechanism would control the process at initial part, due to its lower rate. It is already pointed out in (Bohart & Adams, 1920), a good fitting of Adams–Bohart model to the adsorbate transport in the fixed bed column indicates that the surface diffusion was the rate-limiting step in the adsorption process. The saturation concentration, N0, defined as the final effluent concentration predicted by this model, decreased with increasing bed height, but increased with increasing influent concentration and flow rate. At the identical process time, most of the tetracycline molecules were adsorbed in higher bed depth, and as a result would show much lower effluent concentration. Higher flow rate results in a higher effluent concentration; this is because a large number of molecules leave the column without treatment. According to the limited active sites of adsorbent particles, they are unable to embed all TC molecules in their pores at high concentrations, and therefore causes a higher N0 in higher C0. Despite the well-fitting of this model, it can be only used for the initial region of curve (Ct/C0 less than 0.1).
Parameters of kinetic models using linear regression analysis.
| Z (cm) | Q (mLmin−1) | C0 (mgL−1) | Adams–Bohart | Yoon–Nelson | ||||
|---|---|---|---|---|---|---|---|---|
| kBA (Lmg−1min−1) | N0 (mgL−1) | R2 | kYN (min−1) | τ (min) | R2 | |||
| 2 | 6 | 50 | 0.1107 | 38.710 | 0.9953 | 0.0209 | 81.88 | 0.6765 |
| 4 | 6 | 50 | 0.1316 | 13.908 | 0.9239 | 0.0170 | 143.73 | 0.6844 |
| 6 | 6 | 50 | 0.1660 | 4.606 | 0.9946 | 0.0162 | 195.13 | 0.8006 |
| 4 | 4 | 50 | 0.1659 | 4.937 | 0.9917 | 0.0114 | 213.45 | 0.7341 |
| 4 | 8 | 50 | 0.1248 | 25.879 | 0.9999 | 0.0117 | 45.72 | 0.6275 |
| 4 | 6 | 20 | 0.2447 | 0.712 | 0.9999 | 0.0122 | 224.61 | 0.7391 |
| 4 | 6 | 80 | 0.0387 | 29.203 | 0.9999 | 0.0114 | 57.88 | 0.7401 |
The parameters of Yoon–Nelson model for investigation of breakthrough curve are shown in Table 4. The 50% breakthrough time, τ, significantly increased as bed height increased, which may be due to increased adsorbent surface area and more binding sites for adsorption (Kumar & Chakraborty, 2009). With the increase in flow rate, the values of τ decreased, which can be attributed to the rapid saturation of bed in higher flow rates. As can be seen in Table 4, higher inlet concentrations led to lower τ, which is due to the fact that higher driving force led to the faster occupation of active sites and therefore, a decrease in breakthrough time. However, these results seem reasonable and are totally in agreement with the changes in experimental data of tb. and texh., it should be noted again that because of low R2 values, this model is not reliable.
Accordingly, in order to model the transient stage or working stage of the breakthrough curve another model should be applied. Similar procedure was followed in a study about adsorption of methylene blue on phoenix tree leaf powder (Han et al., 2009).
3.6Application of adaptive neuro-fuzzy inference systemFuzzy systems can qualitatively express uncertainty and at the same time can have an exact performance, which is so-called computing with words in scientific literature. Furthermore, these systems can use human knowledge in their structures, which is expressed in the form of if−then rules (Mandal, Sahu, Giri, & Patel, 2014). Therefore the experience of professionals is used in various applications to create and design fuzzy systems. This specific feature of these systems is unique for fuzzy logics and artificial neural networks do not have it. The learning capabilities of neural network (followed the patterns of available data) can be combined to the fuzzy system (expressed qualitatively) so that a new hybrid intelligent system, called neuro-fuzzy system could be developed. The most known model proposed in this field is Adaptive Neuro-Fuzzy Inference System or ANFIS (Roohian, Abbasi, Hosseini, & Jahanmiri, 2014). Figure 5 shows a typical ANFIS structure which consists of five distinct layers.

A fuzzy model named first-order Takagi–Sugeno is considered with two inputs x and y and one output f. Typical fuzzy rules are the following:
where Ai and Bi are the fuzzy sets, and pi, qi and ri are the design parameters that are determined during the training process. The total output is the weighted average of outputs. The Oji represents the output of ith node in layer j (Mandal, Mahapatra, & Patel, 2015).
First layer (fuzzy layer): every single node in this layer generates a fuzzy membership grade.
where μAi(x) and μBi(y) can adopt any fuzzy membership function. x (or y) is the input of node and Ai (or Bi) is the related fuzzy set. The Gaussian membership functions would be:where ci and ai are the parameters that change the center and width of the membership function, respectively. In general, the output of this layer is the shape of membership function.


Second layer (product layer): the input membership grades analyze the firing strength of each rule via multiplication:
where wi is the firing strength of each rule.
Third layer (normalized layer): a normalization function is applied to obtain outputs as:
where w¯i is called normalized firing strength.
Forth layer (defuzzy layer): every node has the following function:

Finally, the fifth layer (total output layer): the overall output is computed by the aggregation of all incoming signals, i.e.

In the present study, a classical fuzzy model on the basis of the subtractive clustering algorithm was developed to predict the behavior of breakthrough curve. All subsequent processing and modeling were carried out using Matlab software and associated tools. Accordingly, 216 experimental data sets with 5 characteristics (4 inputs and 1 output) were used in this model: time, bed height, flow rate and initial concentration were considered as input attributes and concentration ratio (Ct/C0) as target parameter. 90% of data sets were arbitrarily selected for training stage, and another subset consisted of 10% of data sets left for validation step.
Takagi–Sugeno fuzzy structure was used based on Subtractive Clustering method with a radius of 0.6 for each cluster, and finally 21 fuzzy rules were obtained. Gaussian type membership functions were selected by the minimum and maximum values of 0 and 1, respectively. The back-propagation learning rule applied in this model is the same method which is used in common feed-forward neural networks. Figure 6 shows the training error versus number of epochs. As can be seen in this figure, overtraining occurred after stage 28 which means further training was ineffectual; nevertheless the number of stages was considered 50 to ensure of sufficient training.

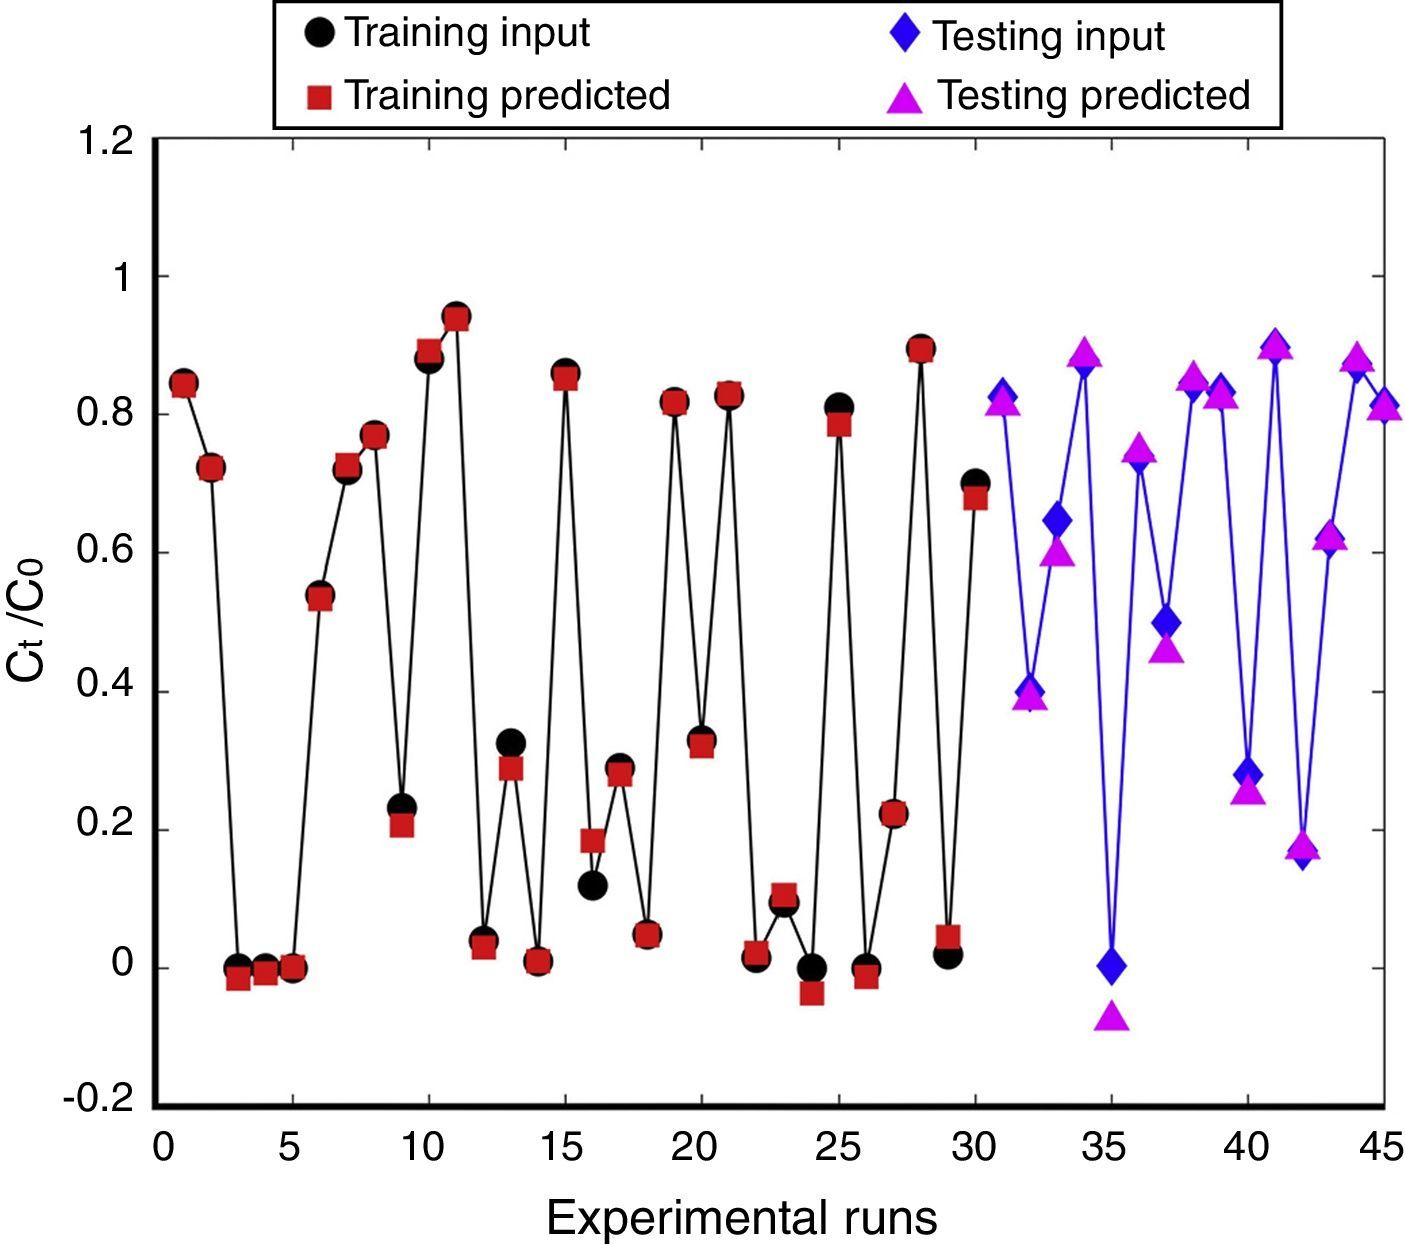
Initially, the chosen training data were used to design a model for 50 stages. Afterwards in order to evaluate the prediction accuracy, the training and testing data were subjected to the model separately and their error graphs were determined, which can be seen in Figure 7(a) and (b) respectively. The perfect fit between the predicted output and experimental data sets introduces a promising method for modeling of continuous adsorption processes. Subsequently in order to validate the proposed model, some of the ANFIS predicted values and related experimental data sets were compared in Figure 8. The prediction accuracy was about 84% which presents excellent correlation between the experimental and predicted values. The variation pattern in training and testing phase is also presented in Figure 9. In this graph, the black dots represent experimental data and red dots indicate predicted values. According to the axis of this graph, all points should be placed on the line y=x in the case of perfect prediction. Any Deviations from the line y=x indicate modeling errors. To sum it up, the presented results confirm the well prediction of fixed-bed adsorption data by ANFIS model.
4Conclusion training data and (b) testing data.")


This study presented a granular nanoporous activated carbon prepared from apricot shell by chemical activation using phosphoric acid, which was a promising adsorbent for an efficient removal of tetracycline in a fixed-bed adsorption column. The adsorption capacity of tetracycline was found to increase with increase in influent concentration but decrease with increasing bed height and feed flow rate. Three different models were used to describe the breakthrough curve: Yoon–Nelson equation was poorly fitted to the experimental data. Adams–Bohart model could satisfactorily describe only the initial section of breakthrough curve (Ct≪0.1C0) at all experimental conditions. The proposed ANFIS model could perfectly predict the behavior of the curve at both parts, including the initial part and transient region. In conclusion, the obtained results of modeling confirm that presented ANFIS system can be taken into account for accurate modeling of continuous processes.
Conflict of interestThe authors have no conflicts of interest to declare.
The authors would like to thank Dr. Hossein Abolghasemi and anonymous reviewers for their valuable comments. The ceaseless supports of Mr. Seyed Mohammad Anvari and Mr. Seyed Hooman Anvari are also greatly appreciated.
Peer Review under the responsibility of Universidad Nacional Autónoma de México.