


Poor adherence to oral antidiabetic drugs (Adh-OAD) is a risk factor for poor control of type 2 diabetes mellitus (T2DM). Therefore, it is necessary to quantify the Adh-OAD. This quantification is possible through electronic dispensing records from the community pharmacy.
The objective was to evaluate the influence of the Adh-OAD on the control of T2DM and the percentage of glycosylated hemoglobin (%HbA1c) in the patient.
Materials and methodsA cross-sectional descriptive observational study was conducted in 8 community pharmacies in Granada (Spain). Patients older than 18 years with T2DM and on oral antidiabetic drugs (OADs) for at least 6 months were included. The main study variables were the control of T2DM, %HbA1c, and the Adh-OAD considering three cut-off points (≥80%, ≥70%, ≥60%). This relationship was studied using multivariate binary logistic regression and multivariate linear regression, respectively.
ResultsA total of 107 patients were included. The mean age was 70.5 years (SD: 9.7), and 54.2% were men. Eighty-five patients (79.4%) had well-controlled T2DM (mean %HbA1c: 6.5%; SD=0.6). Considering Adh-OAD≥80%, 13.1% (n=14) had a poor adherence and was related to the %HbA1c (β=0.742; p=0.007) and the control of T2DM (OR: 7.327; 95% CI: 1.302–41.241). Poor adherence was found in 9.3% (n=10) considering Adh-OAD≥70% and in 3.7% (n=4) considering Adh-OAD≥60%. In both cases, a statistically significant relationship was found between Adh-OAD and the %HbA1c and between Adh-OAD and the control of T2DM.
ConclusionsAdh-OAD influenced the %HbA1c in patients with T2DM and the control of their disease.
La falta de adherencia al tratamiento antidiabético oral (Adh-ADO) es factor de riesgo de la falta de control de la diabetes mellitus 2 (DM2). Por tanto, es necesario cuantificar la Adh-ADO. Desde la farmacia comunitaria esto es posible mediante los registros electrónicos de dispensación.
El objetivo fue evaluar la influencia de la Adh-ADO sobre el control de la DM2 y sobre el porcentaje de hemoglobina glicosilada (%HbA1c) del paciente.
Materiales y métodosEstudio observacional descriptivo transversal realizado en ocho farmacias comunitarias de Granada (España). Se incluyeron pacientes mayores de 18 años con DM2 y en tratamiento con antidiabéticos orales durante mínimo seis meses. Las variables principales fueron el control de DM2, %HbA1c y Adh-ADO teniendo en cuenta tres puntos de corte (≥ 80%, ≥ 70%, ≥ 60%). Esta relación se estudió mediante regresión logística binaria multivariante y regresión lineal multivariante respectivamente.
ResultadosSe incluyeron 107 pacientes. La edad media fue 70,5 (DE = 9,7) años y el 54,2% fueron hombres; 85 pacientes (79,4%) tuvieron controlada la DM2 (%HbA1c medio 6,5%; DE=0,6). Considerando Adh-ADO ≥ 80%, el 13,1% (n=14) tuvo falta de adherencia y se relacionó con %HbA1c (β = 0,742; p=0,007) y con el control de la DM2 (OR = 7,327; IC 95%: 1,302-41,241). El 9,3% (n=10) tuvo falta de adherencia considerando Adh-ADO ≥ 70% y el 3,7% (n=4) considerando Adh-ADO ≥ 60. En ambos casos hubo relación estadísticamente significativa con %HbA1c y con el control de la DM2.
ConclusionesLa Adh-ADO influyó sobre el %HbA1c en los pacientes con DM2 y sobre el control de su enfermedad.
Type 2 diabetes mellitus (T2DM) accounts for 90–95% of all cases of diabetes mellitus (DM) in the world.1 According to the latest report of the International Diabetes Federation (IDF), the 537 million people with DM in 2021 will grow to 783.2 million by 2045. The prevalence of DM was estimated at 10.5%, and it was estimated to reach 12.2% in 2045.2
T2DM is an important public health problem due to its associated high morbidity and mortality. Deaths attributed to T2DM and its complications account for 12% of all-cause deaths globally in the 20–79-year-old group. In addition, it is associated with both direct economic costs (pharmacological treatments, hospital admissions, etc.) and indirect costs (loss of productivity) for public administrations. In 2021, it was estimated that the economic expenditure related to DM in Europe was 189 billion dollars, representing 19.6% of the total expenditure on health costs.2
Maintaining the percentage of glycosylated hemoglobin (%HbA1c) within limits provided by the clinical guidelines was reported to decrease the risk of complications associated with T2DM,3,4 improve the quality of life of the patient, and decrease health expenditure.5 For this reason, the European Association for the Study of Diabetes (EASD) and the American Diabetes Association (ADA) recommend that %HbA1c be set according to the characteristics of each patient.6 According to the Panorama study, in Europe, 37.5% of patients with T2DM did not have %HbA1c within the recommended limits, and therefore, the authors concluded that there was no adequate control of the disease.7
Poor adherence to oral antidiabetic treatment (Adh-OAD) is one of the main risk factors preventing the achievement of therapeutic objectives. The meta-analysis published by Iglay et al. showed that the number of patients with Adh-OAD only reached 67.9%.8 Several studies show that pharmacist intervention in patients with T2DM has a positive impact and may improve this percentage.9–11 Given the importance of Adh-OAD on T2DM control, it is necessary to have valid and reliable measurement methods to determine how patients behave regarding their treatment. Classically, several methods have been used (tablet count, questionnaires, etc.). Recently, a new method based on the dispensation records resulting from electronic prescriptions has also been used.12 This method is accessible and easy to use for all healthcare professionals in the health system and has the advantage of observing the patient's behavior about collecting their medications over long periods (as opposed to those with questionnaires).13 However, it has the disadvantage that it should be assumed that the patient consumes 100% of the collected medication.
In Spain, the Electronic Prescription System (EPS) has been implemented for more than a decade and is available in all primary care centers, public hospitals, and community pharmacies.14 Therefore, taking advantage of the availability of the EPS to measure the Adh-OAD in patients with T2DM, the objective of the study was to assess the poor Adh-OAD in patients with T2DM using the EPS dispensation records. We also aimed to assess the relationship between this adherence and the %HbA1c and control of T2DM.
Materials and methodsStudy design and data collectionA cross-sectional descriptive observational study was conducted in 8 community pharmacies in Granada (Spain) between September 2020 and October 2022. Community pharmacies were selected by convenience.
The selection of the sample was conducted by consecutive sampling. Some prescriptions are refilled every 60 days. Therefore, three months were estimated enough in each pharmacy so that all patients with T2DM who would collect their medication could be invited to participate in the study. The sample size was calculated based on the estimated prevalence of patients with uncontrolled T2DM (37.5%), with a confidence interval of 95% (95% CI) and with an error of the estimate of 10%. Therefore, 109 patients were needed.
ParticipantsThe inclusion criteria of the study were: (1) patients over 30 years of age with a diagnosis of T2DM; (2) undergoing treatment with oral antidiabetic drugs (OAD) for at least 6 months and; (3) who collect their medication through the EPS of the Andalusian Health System (SAS). We excluded patients who could not communicate in Spanish, had any injectable medication to treat T2DM, needed help taking the medication (caregiver or care worker who prepared their personalized dosing systems), or had cognitive or mental impairments that would hinder the interview.
All patients were informed about the objectives, study methods, and their rights verbally and in writing (patient information sheet). After agreeing to participate in the study, each patient signed the informed consent form. This study has been approved by the Andalusian Biomedical Research Ethics Committee (0057-N-15).
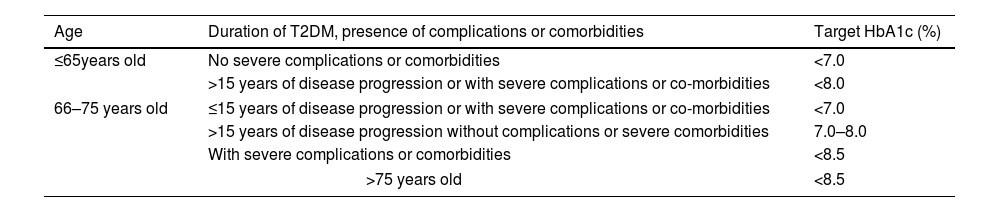
Main measurements%HbA1c: The A1c Now+® device was used.15 A drop of blood was obtained by a capillary puncture on the patient's index finger, and the %HbA1c was obtained after 5min. The patient was considered to have good control when this value was within the limits recommended by the “Type 2 Diabetes Guidelines for Clinicians: RedGDPS recommendations” based on ADA and EASD recommendations16 (Table 1).
Recommendations for the classification of patients with type 2 diabetes mellitus (T2DM) as controlled or uncontrolled.
| Age | Duration of T2DM, presence of complications or comorbidities | Target HbA1c (%) |
|---|---|---|
| ≤65years old | No severe complications or comorbidities | <7.0 |
| >15 years of disease progression or with severe complications or co-morbidities | <8.0 | |
| 66–75 years old | ≤15 years of disease progression or with severe complications or co-morbidities | <7.0 |
| >15 years of disease progression without complications or severe comorbidities | 7.0–8.0 | |
| With severe complications or comorbidities | <8.5 | |
| >75 years old | <8.5 | |
Percentage of adherence to OAD (%Adh-OAD). The adherence was measured using the dispensation records found in the EPS of the SAS. The data of all OAD collected by each patient from the date the patients were included in the study up to a maximum of one year before that date were used for the assessment. The “Proportion of Days Covered” (PDC) method was used to calculate the %Adh-OAD. The PDC is defined as the ratio of tablets collected (TC) by the patient from the pharmacy to the number of tablets needed (TN) to comply with the therapy prescribed by the physician for a certain time.
where the number of tablets needed (TN) is the number of tablets prescribed for the patient for one day (TC) multiplied by the number of days of the dispensing interval. The dispensing interval (DI) is the number of days between two consecutive drug collections (TN=TD×DI in days).
Patients were classified as “adherent to their OAD” when they collected at least 80% of each prescribed OAD. If the percentage was lower for any of their OAD, the patients would be considered “non-adherent to their OAD”. The %Adh-OAD was also studied considering the 70% and 60% OAD collection rates.
In addition, during the interview with the patient, sociodemographic data (age, sex, educational level, family history, alcohol consumption and smoking habit), medication-related data (total number of drugs prescribed and number of OAD), anthropometric variables (weight, height, waist and hip circumferences), and data on comorbidities and complications associated with T2DM were collected.
The physical activity performed by patients was also measured using the Spanish version of the “International Physical Activity Questionnaire” (IPAQ), which included 7 questions about the frequency, duration, and intensity of physical activity (PA) performed in the last 7 days.17
Statistical methodsFor the characterization of the sample, measures of central tendency (mean) and dispersion (standard deviation) were used for the quantitative variables, and a frequency analysis was performed for the qualitative variables. The differences in each variable between patients with controlled and uncontrolled T2DM were studied using Chi-square tests or Fisher's test (for qualitative variables) and Student's t-test for independent samples (for quantitative variables).
The relationship of %Adh-OAD with T2DM control was studied by multivariate binary logistic regression analysis. The Hosmer–Lemeshow test (calibration) was performed to check the goodness-of-fit of the model. A multivariate linear regression analysis was performed to elucidate the relationship between %Adh-OAD and %HbA1c. The same variables were used, even if they were not statistically significant, to facilitate the comparison of the models according to the %Adh-OAD studied (80%, 70% or 60%). The assumptions of collinearity, homoscedasticity and independence of errors (Durbin-Watson test) were assessed to study the diagnosis of the obtained model. Independent variables not meeting the assumptions of linearity were categorized.
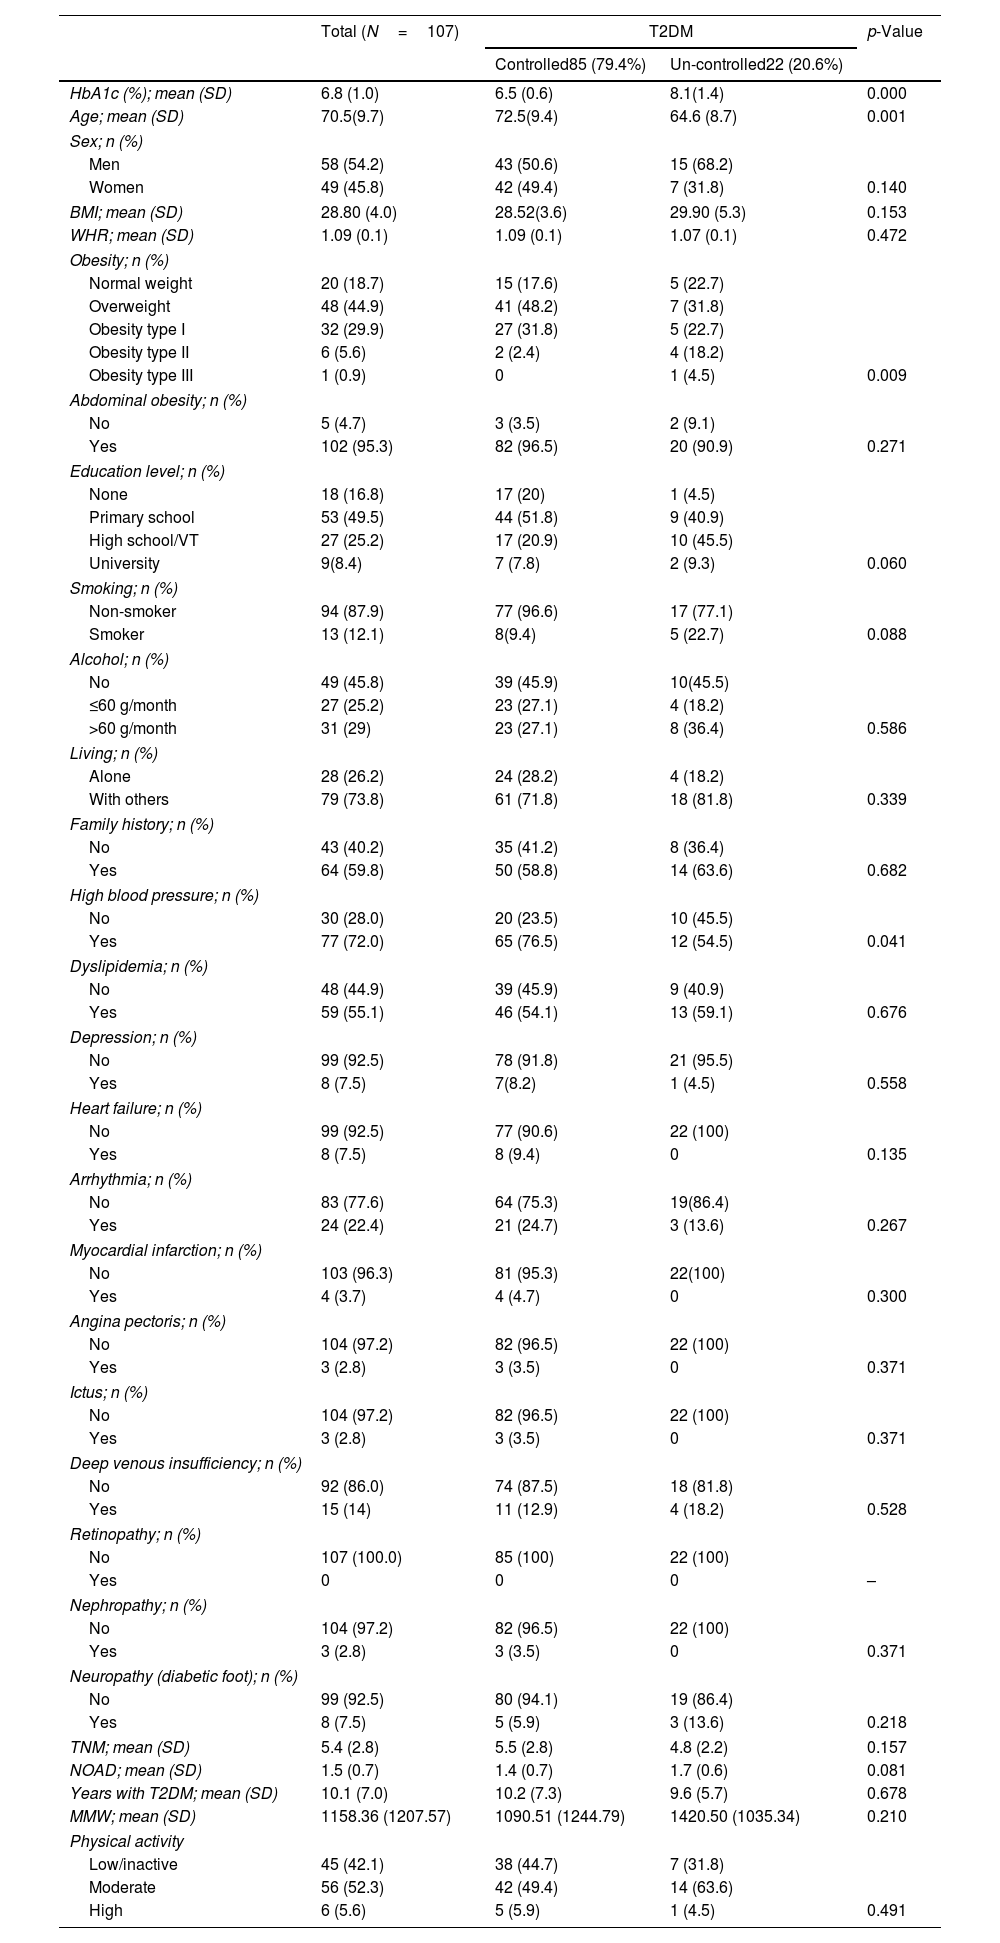
ResultsA total of 107 patients were included in the study. The mean age was 70.5 years (SD: 9.7), and 54.2% (n=58) were men. The mean number of years since the patients were diagnosed with T2DM was 10 (SD: 7.0). Eighty-five patients (79.4%) had a controlled T2DM with a mean %HbA1c of 6.5% (SD=0.6). The rest of the patients, 20.6% (n=22), had uncontrolled of T2DM and had a mean %HbA1c of 8.1 (SD=1.4%).
Regardless of the cut-off point used (80%, 70% or 60%), the percentage of non-adherence was higher in the group of patients with uncontrolled T2DM than in the group with controlled T2DM. These groups of patients differed also in age (p=0.001), obesity (p=0.009) and hypertension (p=0.041) (Table 2).
Characterization of the study sample.
| Total (N=107) | T2DM | p-Value | ||
|---|---|---|---|---|
| Controlled85 (79.4%) | Un-controlled22 (20.6%) | |||
| HbA1c (%); mean (SD) | 6.8 (1.0) | 6.5 (0.6) | 8.1(1.4) | 0.000 |
| Age; mean (SD) | 70.5(9.7) | 72.5(9.4) | 64.6 (8.7) | 0.001 |
| Sex; n (%) | ||||
| Men | 58 (54.2) | 43 (50.6) | 15 (68.2) | |
| Women | 49 (45.8) | 42 (49.4) | 7 (31.8) | 0.140 |
| BMI; mean (SD) | 28.80 (4.0) | 28.52(3.6) | 29.90 (5.3) | 0.153 |
| WHR; mean (SD) | 1.09 (0.1) | 1.09 (0.1) | 1.07 (0.1) | 0.472 |
| Obesity; n (%) | ||||
| Normal weight | 20 (18.7) | 15 (17.6) | 5 (22.7) | |
| Overweight | 48 (44.9) | 41 (48.2) | 7 (31.8) | |
| Obesity type I | 32 (29.9) | 27 (31.8) | 5 (22.7) | |
| Obesity type II | 6 (5.6) | 2 (2.4) | 4 (18.2) | |
| Obesity type III | 1 (0.9) | 0 | 1 (4.5) | 0.009 |
| Abdominal obesity; n (%) | ||||
| No | 5 (4.7) | 3 (3.5) | 2 (9.1) | |
| Yes | 102 (95.3) | 82 (96.5) | 20 (90.9) | 0.271 |
| Education level; n (%) | ||||
| None | 18 (16.8) | 17 (20) | 1 (4.5) | |
| Primary school | 53 (49.5) | 44 (51.8) | 9 (40.9) | |
| High school/VT | 27 (25.2) | 17 (20.9) | 10 (45.5) | |
| University | 9(8.4) | 7 (7.8) | 2 (9.3) | 0.060 |
| Smoking; n (%) | ||||
| Non-smoker | 94 (87.9) | 77 (96.6) | 17 (77.1) | |
| Smoker | 13 (12.1) | 8(9.4) | 5 (22.7) | 0.088 |
| Alcohol; n (%) | ||||
| No | 49 (45.8) | 39 (45.9) | 10(45.5) | |
| ≤60 g/month | 27 (25.2) | 23 (27.1) | 4 (18.2) | |
| >60 g/month | 31 (29) | 23 (27.1) | 8 (36.4) | 0.586 |
| Living; n (%) | ||||
| Alone | 28 (26.2) | 24 (28.2) | 4 (18.2) | |
| With others | 79 (73.8) | 61 (71.8) | 18 (81.8) | 0.339 |
| Family history; n (%) | ||||
| No | 43 (40.2) | 35 (41.2) | 8 (36.4) | |
| Yes | 64 (59.8) | 50 (58.8) | 14 (63.6) | 0.682 |
| High blood pressure; n (%) | ||||
| No | 30 (28.0) | 20 (23.5) | 10 (45.5) | |
| Yes | 77 (72.0) | 65 (76.5) | 12 (54.5) | 0.041 |
| Dyslipidemia; n (%) | ||||
| No | 48 (44.9) | 39 (45.9) | 9 (40.9) | |
| Yes | 59 (55.1) | 46 (54.1) | 13 (59.1) | 0.676 |
| Depression; n (%) | ||||
| No | 99 (92.5) | 78 (91.8) | 21 (95.5) | |
| Yes | 8 (7.5) | 7(8.2) | 1 (4.5) | 0.558 |
| Heart failure; n (%) | ||||
| No | 99 (92.5) | 77 (90.6) | 22 (100) | |
| Yes | 8 (7.5) | 8 (9.4) | 0 | 0.135 |
| Arrhythmia; n (%) | ||||
| No | 83 (77.6) | 64 (75.3) | 19(86.4) | |
| Yes | 24 (22.4) | 21 (24.7) | 3 (13.6) | 0.267 |
| Myocardial infarction; n (%) | ||||
| No | 103 (96.3) | 81 (95.3) | 22(100) | |
| Yes | 4 (3.7) | 4 (4.7) | 0 | 0.300 |
| Angina pectoris; n (%) | ||||
| No | 104 (97.2) | 82 (96.5) | 22 (100) | |
| Yes | 3 (2.8) | 3 (3.5) | 0 | 0.371 |
| Ictus; n (%) | ||||
| No | 104 (97.2) | 82 (96.5) | 22 (100) | |
| Yes | 3 (2.8) | 3 (3.5) | 0 | 0.371 |
| Deep venous insufficiency; n (%) | ||||
| No | 92 (86.0) | 74 (87.5) | 18 (81.8) | |
| Yes | 15 (14) | 11 (12.9) | 4 (18.2) | 0.528 |
| Retinopathy; n (%) | ||||
| No | 107 (100.0) | 85 (100) | 22 (100) | |
| Yes | 0 | 0 | 0 | – |
| Nephropathy; n (%) | ||||
| No | 104 (97.2) | 82 (96.5) | 22 (100) | |
| Yes | 3 (2.8) | 3 (3.5) | 0 | 0.371 |
| Neuropathy (diabetic foot); n (%) | ||||
| No | 99 (92.5) | 80 (94.1) | 19 (86.4) | |
| Yes | 8 (7.5) | 5 (5.9) | 3 (13.6) | 0.218 |
| TNM; mean (SD) | 5.4 (2.8) | 5.5 (2.8) | 4.8 (2.2) | 0.157 |
| NOAD; mean (SD) | 1.5 (0.7) | 1.4 (0.7) | 1.7 (0.6) | 0.081 |
| Years with T2DM; mean (SD) | 10.1 (7.0) | 10.2 (7.3) | 9.6 (5.7) | 0.678 |
| MMW; mean (SD) | 1158.36 (1207.57) | 1090.51 (1244.79) | 1420.50 (1035.34) | 0.210 |
| Physical activity | ||||
| Low/inactive | 45 (42.1) | 38 (44.7) | 7 (31.8) | |
| Moderate | 56 (52.3) | 42 (49.4) | 14 (63.6) | |
| High | 6 (5.6) | 5 (5.9) | 1 (4.5) | 0.491 |
T2DM: type 2 diabetes mellitus; BMI: body mass index; WHR: waist–hip ratio; VT: vocational training; TNM: total number of medications; NOAD: number of oral antidiabetic drugs; MMW: Metabolic Equivalent Task (MET) per minute per week; SD: standard deviation.
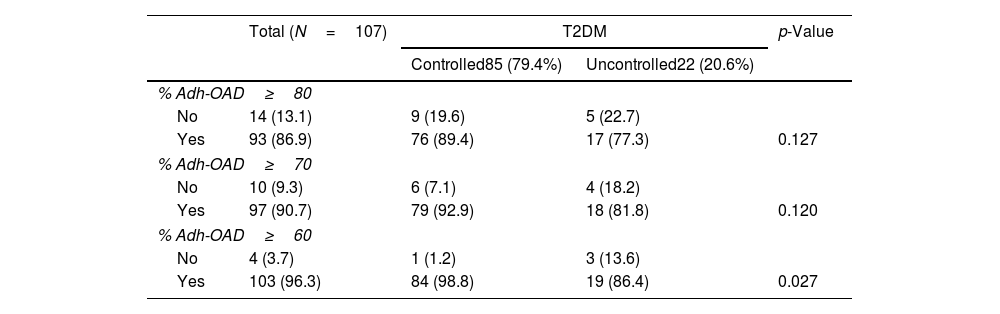
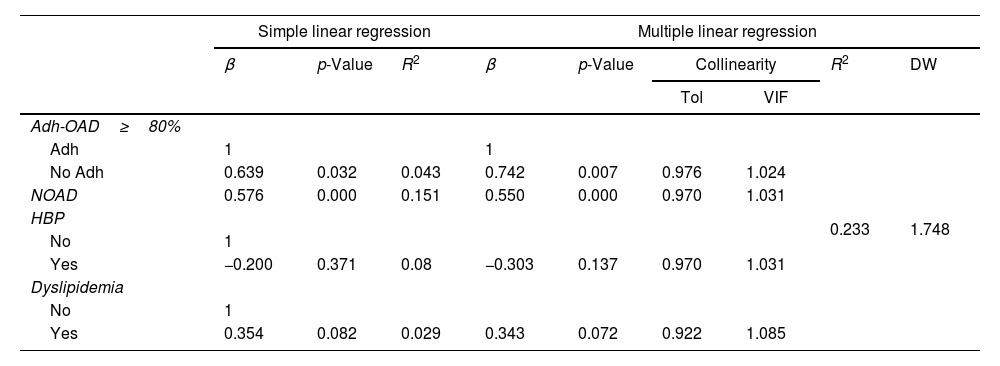
Regarding Adh-OAD, 13.1% (n=14) of patients showed a poor of Adh-OAD when %Adh-OAD≥80% was considered, 9.3% (n=10) with %Adh-OAD≥70%, and 3.7% (n=4) when %Adh-OAD≥60% (Table 3). Poor Adh-OAD was related to %HbA1c, regardless of the cut-off point used, %Adh-OAD≥80% (β=0.742; p=0.007), %Adh-OAD≥70% (β=0.929; p=0.003), and %Adh-OAD≥60% (β=1.592; p=0.001) (Table 4).
Relationship between type 2 diabetes mellitus (T2DM) control and the different cut-off points for adherence to oral antidiabetic drugs (OAD) obtained from dispensing records.
| Total (N=107) | T2DM | p-Value | ||
|---|---|---|---|---|
| Controlled85 (79.4%) | Uncontrolled22 (20.6%) | |||
| % Adh-OAD≥80 | ||||
| No | 14 (13.1) | 9 (19.6) | 5 (22.7) | |
| Yes | 93 (86.9) | 76 (89.4) | 17 (77.3) | 0.127 |
| % Adh-OAD≥70 | ||||
| No | 10 (9.3) | 6 (7.1) | 4 (18.2) | |
| Yes | 97 (90.7) | 79 (92.9) | 18 (81.8) | 0.120 |
| % Adh-OAD≥60 | ||||
| No | 4 (3.7) | 1 (1.2) | 3 (13.6) | |
| Yes | 103 (96.3) | 84 (98.8) | 19 (86.4) | 0.027 |
%Adh-OAD≥80: adherence rate when at least 80% of the OAD medication is collected; %Adh-OAD≥70 at least 70% of the OAD medication is collected and %Adh-OAD≥60: when at least 60% of the OAD medication is collected.
Relationship between glycated hemoglobin HbA1c and poor adherence at different cut-off points (multiple binary linear regression analysis).
| Simple linear regression | Multiple linear regression | ||||||||
|---|---|---|---|---|---|---|---|---|---|
| β | p-Value | R2 | β | p-Value | Collinearity | R2 | DW | ||
| Tol | VIF | ||||||||
| Adh-OAD≥80% | 0.233 | 1.748 | |||||||
| Adh | 1 | 1 | |||||||
| No Adh | 0.639 | 0.032 | 0.043 | 0.742 | 0.007 | 0.976 | 1.024 | ||
| NOAD | 0.576 | 0.000 | 0.151 | 0.550 | 0.000 | 0.970 | 1.031 | ||
| HBP | |||||||||
| No | 1 | ||||||||
| Yes | −0.200 | 0.371 | 0.08 | −0.303 | 0.137 | 0.970 | 1.031 | ||
| Dyslipidemia | |||||||||
| No | 1 | ||||||||
| Yes | 0.354 | 0.082 | 0.029 | 0.343 | 0.072 | 0.922 | 1.085 | ||
| Simple linear regression | Multiple linear regression | ||||||||
|---|---|---|---|---|---|---|---|---|---|
| β | p-Value | R2 | β | p-Value | Collinearity | R2 | DW | ||
| Tol | VIF | ||||||||
| Adh-OAD≥70% | 0.243 | 1.691 | |||||||
| Adh | 1 | ||||||||
| No Adh | 0.898 | 0.009 | 0.063 | 0.929 | 0.003 | 0.989 | 1.011 | ||
| NOAD | 0.539 | 0.000 | 0.969 | 1.032 | |||||
| HBP | |||||||||
| No | -0.292 | 0.148 | 0.971 | 1.030 | |||||
| Yes | |||||||||
| Dyslipidemia | |||||||||
| No | 0.321 | 0.060 | 0.931 | 1.075 | |||||
| Yes | |||||||||
| Simple linear regression | Multiple linear regression | ||||||||
|---|---|---|---|---|---|---|---|---|---|
| β | p-Value | R2 | β | p-Value | Collinearity | R2 | DW | ||
| Tol | VIF | ||||||||
| Adh-OAD≥60% | 0.259 | 1.735 | |||||||
| Adh | 1 | ||||||||
| No Adh | 1.490 | 0.005 | 0.074 | 1.592 | 0.001 | 0.983 | 1.017 | ||
| NOAD | 0.539 | 0.000 | 0.969 | 1.032 | |||||
| HBP | |||||||||
| No | |||||||||
| Yes | -0.312 | 0.119 | 0.970 | 1.031 | |||||
| Dyslipidemia | |||||||||
| No | |||||||||
| Yes | 0.344 | 0.066 | 0.929 | 1.077 | |||||
Adh-OAD: adherence to oral antidiabetic drugs; Tol: tolerance; VIF: variance inflation factor; β linear regression coefficient R2 coefficient of determination: DW: Durbin–Watson Test; NOAD: number of OAD; HBP: high blood pressure.
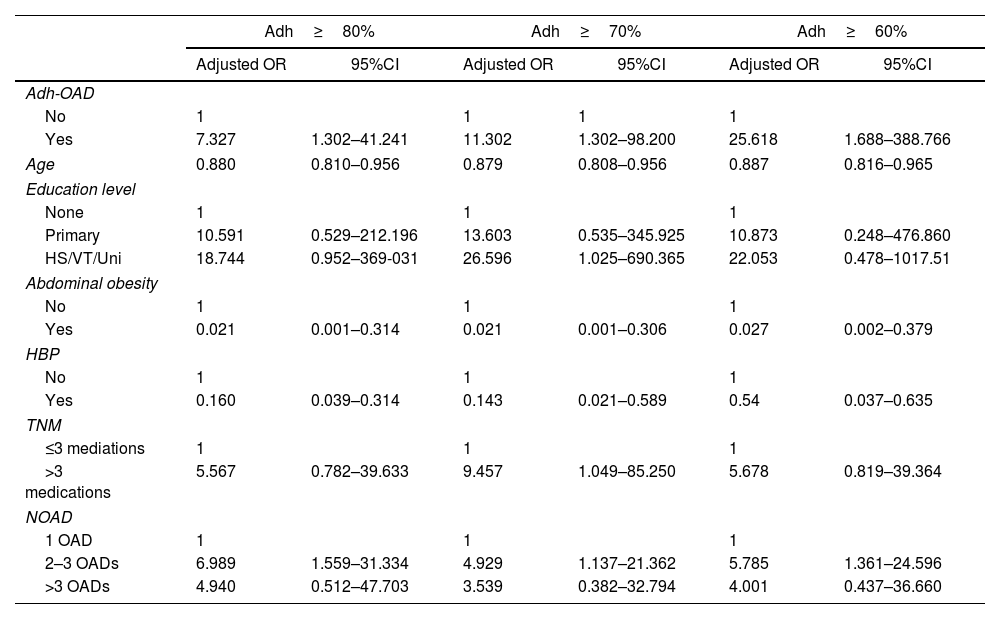
Regarding the control of T2DM, a statistically significant relationship with %Adh-OAD was found in the 3 cut-off points: %Adh-OAD≥80% (OR: 7.327; 95% CI: 1.302–41.241), %Adh-OAD≥70% (OR: 11.302; 95%CI: 1.301–98.20) and %Adh-OAD≥60% (OR: 25.618; 95%CI: 1.688–388.766) (Table 5).
Risk of uncontrolled type 2 diabetes mellitus (T2DM) based on the adherence cut-off point (multivariate binary logistic regression analysis).
| Adh≥80% | Adh≥70% | Adh≥60% | ||||
|---|---|---|---|---|---|---|
| Adjusted OR | 95%CI | Adjusted OR | 95%CI | Adjusted OR | 95%CI | |
| Adh-OAD | ||||||
| No | 1 | 1 | 1 | 1 | ||
| Yes | 7.327 | 1.302–41.241 | 11.302 | 1.302–98.200 | 25.618 | 1.688–388.766 |
| Age | 0.880 | 0.810–0.956 | 0.879 | 0.808–0.956 | 0.887 | 0.816–0.965 |
| Education level | ||||||
| None | 1 | 1 | 1 | |||
| Primary | 10.591 | 0.529–212.196 | 13.603 | 0.535–345.925 | 10.873 | 0.248–476.860 |
| HS/VT/Uni | 18.744 | 0.952–369-031 | 26.596 | 1.025–690.365 | 22.053 | 0.478–1017.51 |
| Abdominal obesity | ||||||
| No | 1 | 1 | 1 | |||
| Yes | 0.021 | 0.001–0.314 | 0.021 | 0.001–0.306 | 0.027 | 0.002–0.379 |
| HBP | ||||||
| No | 1 | 1 | 1 | |||
| Yes | 0.160 | 0.039–0.314 | 0.143 | 0.021–0.589 | 0.54 | 0.037–0.635 |
| TNM | ||||||
| ≤3 mediations | 1 | 1 | 1 | |||
| >3 medications | 5.567 | 0.782–39.633 | 9.457 | 1.049–85.250 | 5.678 | 0.819–39.364 |
| NOAD | ||||||
| 1 OAD | 1 | 1 | 1 | |||
| 2–3 OADs | 6.989 | 1.559–31.334 | 4.929 | 1.137–21.362 | 5.785 | 1.361–24.596 |
| >3 OADs | 4.940 | 0.512–47.703 | 3.539 | 0.382–32.794 | 4.001 | 0.437–36.660 |
Adh-OAD: adherence to oral antidiabetic drugs; OR: odds ratio; CI: confidence interval; HS/VT/Uni: High school/vocational training/University; HBP: high blood pressure; TNM: total number of medications; NOAD: number of OAD; Hosmer–Lemeshow test: %Adh≥80%: 1.097 (p=0.998); %Adh≥70%: 2.261 (p=0.972); %Adh≥60%: 3.217 (p=0.920).
R2 de Cox and Snell: %Adh>80%=0.285; %Adh>70%=0.285; %Adh>60%=0.295.
R2 de Nagelkerke: %Adh>80%=0.447; %Adh>70%=0.446; %Adh>60%=0.462.
The results obtained in the present study showed that 20.6% of study patients had uncontrolled T2DM. This percentage is better than that obtained in the PANORAMA study (37.5%)7; however, there is still much room for improvement. We also found that the percentage of patients with poor Adh-OAD reached 13.1%, almost a third of the prevalence estimated for Europe (32.9%)8 and nearly half of that reported for Spain by Moreno Juste et al. (27.6%)18 and Orozco-Beltrán et al. (29.8%).19 Furthermore, poor Adh-OAD was found to influence the control of T2DM in study patients.
The poor adherence has been defined in several ways depending on the measurement method used. One of the most frequent definitions considers that patients are “adherent” if they have an average PDC≥80%.12,19,20 In other cases, patients were “adherent” if they had a PDC≥80% on at least one of their prescribed medications, and in others, they were defined as “adherent” if they had a PDC≥80% on each of their medications.21 This difference could explain the inconsistent results of the %Adh-OAD found between studies conducted on this topic, and sometimes, these studies have been challenging to compare. In 2009, Choudhry et al. studied the influence of the definition used and concluded that the %Adh-OAD varied between 35% and 95% depending on which of the three definitions was chosen.21
In the present study, patients were Adh-OAD if they obtained a PDC≥80% on each of the OAD drugs. This was because the authors understood that “adherence to treatment” referred to the complete therapeutic strategy prescribed by the physician (all OAD drugs) and not to each drug separately.
Using the proposed method, in this study, the poor Adh-OAD was related to the %HbA1c of the patients regardless of the cut-off point considered. When a patient was considered adherent with a %Adh-OAD≥60%, their HbA1c increased on average by 1.592% (p=0.001); when it was a %Adh-OAD≥70%, the mean increase was 0.929% (p=0.003), and when it was a %Adh-OAD≥80% the mean increase was 0.742% (p=0.007). These results justify using high cut-off points in %Adh-OAD to classify the patient as “adherent”. Thus, if a patient ceased to be adherent for a while, the change in their %HbA1c would be less clinically important than if low cut-off points in %Adh-OAD were considered. However, other cut-off points in %Adh-OAD could be considered if the patient has %HbA1c below the recommended values. No ideal cut-off point for the %Adh-OAD has been set to date.22,23
Some studies have used the value of %HbA1c<7% to determine if a patient had a controller or uncontrolled T2DM without taking into account any other characteristics of the patient.24 In contrast, in the present study, to establish the cut-off point of %HbA1c that defines the patient with “adequate control” of the disease, other variables such as age, years of disease progression, comorbidities and complications associated with the T2DM have been considered.16
Thus, the prevalence of uncontrolled T2DM in our sample (20.6%) was lower than in other countries.7,25 In Spain, several studies have been performed in which the percentage of patients with uncontrolled T2DM was higher than that obtained in this study when %HbA1c<7% was used as a cut-off point, without considering other variables. This is the case of the studies conducted by Peral Martinez et al.26 (40.9%) and Gomez Garcia et al.27 (58.0%). Furthermore, when the same criteria were used as those used in the present study,16 the percentages of patients with uncontrolled T2DM were: (a) Higher than those obtained in the present study in the case of Escribano Serrano et al.28 (31.1%); (b) lower in the case of Orozco Beltran et al.19 (14.7%) and Gomez Garcia et al.27 (12.2%); and (c) similar in the case of the studies conducted by Peral Martinez et al.26 (20.1%) and Cuevas Fernandez et al.29 (23.7%). These results suggest that using only the %HbA1c to determine whether a patient has “controlled” or “uncontrolled” T2DM results in an overestimation of the prevalence of patients with “uncontrolled” disease. Therefore, defining patients with controlled T2DM according to %HbA1c and considering their characteristics and comorbidities is very important. A clear and unified definition would allow for a better comparison between studies performed in this field.
When the poor control of the disease was only addressed by looking at the %Adh-OAD, we found that, regardless of the cut-off point considered (%Adh-OAD≥80%, 70% or 60%), most patients were adherent (77.3%, 81.8% and 86.4%, respectively) (Table 3). This result could suggest that the prescribed therapeutic strategy is not effective enough, given that the patients included in the study had been receiving OADs for at least 6 months, which is sufficient time to achieve the therapeutic objectives and, therefore, their medication should be reviewed. In addition, patients with uncontrolled T2DM had a higher number of prescribed OADs, and it turned out that taking 2–3 OADs increased the risk of not reaching therapeutic goals by 6.98% (95%CI:1.559–31.33) compared to those taking only one OAD.
It was also found that patients with a poor Adh-OAD had a higher risk of having uncontrolled T2DM, which increased as the cut-off point decreased: %Adh≥80% (OR: 7.327; 95%CI: 1.302–41.241); %Adh≥70% (OR: 11.302; 95%CI: 1.301–98.20); and %Adh≥60% (OR: 25.618; 95%CI: 1.688–388.766). This relationship between poor Adh-OAD treatment and uncontrolled T2DM has also been found in other studies.29
Moreover, it was found that some of the variables used to adjust the data were related to the control of the T2DM. These variables were age, abdominal obesity and hypertension, in consistency with other studies included in the systematic review conducted by Bin Rakhis et al.24
The results found in this study should be interpreted with caution due to certain limitations. First, although the justified sample size was adequate, a larger sample size would have been desirable for more accurate confidence intervals. However, recruiting patients was difficult due to time constraints because it was conducted while performing their daily tasks as community pharmacists. Secondly, there may be a selection bias because the participating pharmacies do not have to be representative of the population of Granada (Spain). In addition, a small percentage of patients were not invited to enter the study because they were not registered in the SAS. Furthermore, the method of measurement based on dispensation records assumes that the patients take all medications they have collected. Therefore, adherence could be overestimated. Finally, since it is a cross-sectional study, it is not possible to affirm the causality between the variables; we can only estimate if there is an association between them. For this reason, it would be advisable to design studies that can establish causal relationships.
ConclusionFollowing these findings, it can be concluded that poor Adh-OAD influenced the %HbA1c in patients with T2DM, regardless of the cut-off point of %Adh-OAD chosen (80%, 70% or 60%). The higher the cut-off point, the smaller the increase in %HbA1c when the patient went from adherent to non-adherent. In addition, poor Adh-OAD was also associated with the control of T2DM, so that when a patient had poor adherence, it increased the risk of having an uncontrolled T2DM.
In this study, 20% of patients had poor control of their disease, so efforts must be made from all healthcare settings to ensure that the patient with T2DM can maintain glycemia and %HbA1c within the recommendations of the clinical guidelines. This would decrease the mortality rate in these patients, and they could have a higher health-related quality of life.
FundingThis research did not receive any specific grant from funding agencies in the public, commercial, or not-for-profit sectors.
Conflicts of interestNone.
The authors thank the community pharmacies participating in the study for their dedication and effort. These results are part of the doctoral thesis of Esquivel-Prados Elisabet, a student of the Doctoral School of Health Sciences, University of Granada (Spain).
