


Investors are looking for objects in which they invest their funds successfully, evaluating the effectiveness of alternative markets and their instruments. Historically, cash flow indicators most effectively reflected the mood of the masses in relation to any financial asset, both in the short-and long-term. This article examines in detail the queue of already completed, but not confirmed transactions in the bitcoin network. The mempool is able to timely display the growth in the number of transactions awaiting confirmation, which makes it a leading indicator of future cash flows that could affect the trading volumes and market prices of bitcoin. This study evaluates bitcoin mempool priorities and two different analyses have been conducted for this purpose. Firstly, the mempool periods are examined through a statistical analysis. Secondly, the performance determinants of mempool are assessed with q-ROF Multi-SWARA. In addition to q-ROF sets, weights are computed with IFS and PFS. Demonstrated here is that the results of all fuzzy sets are identical. This outcome explains the reliability of the findings and they indicate that a transaction is the most important determinant of the bitcoin mempool. It emerged that the adjusted mempool data (+16.7%) for 7-day and 30-day moving averages was able, with a time lag of 24–48 h, to indicate significant volatility of future bitcoin trading volumes (+1.6%) on average. The obtained values confirm the empirical conclusion reached here that the mempool growth leads to cash flow growth. An increase in future cash flows results in a substantial rise in future trading volumes. The key takeaway from the analysis is that mempool is able to effectively predict future increases in trading volumes based on the prior cash flow growth projected into mempool growth. However, as a price indicator, mempool does show mixed results with mostly uncertainty in the direction of price movement.
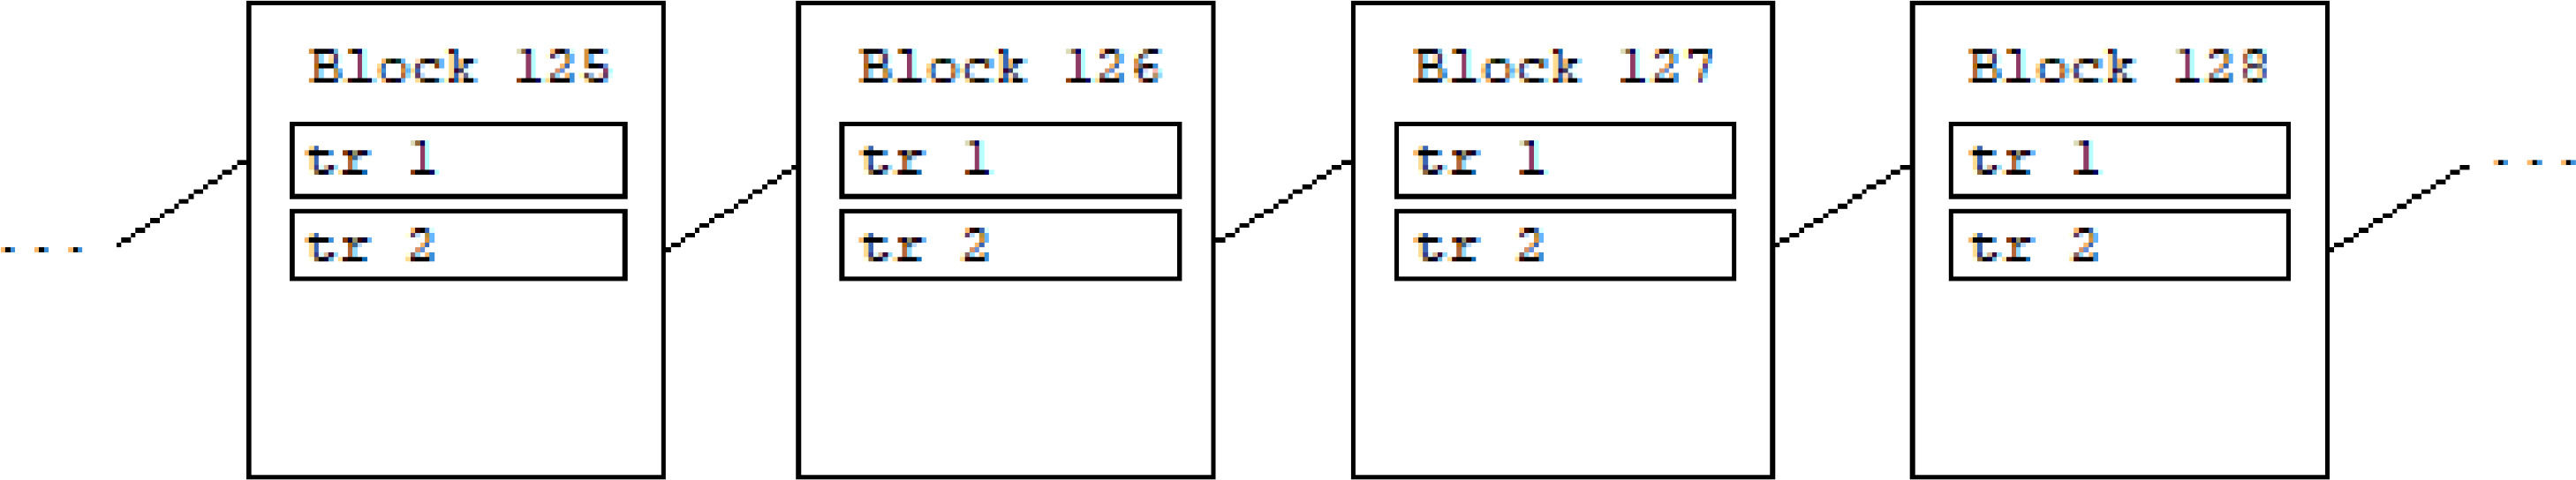
Since its inception, bitcoin is now regarded as the ancestor of a large number of cryptocurrencies, and its blockchain technology has become the standard for decentralized finance (Zetzsche et al., 2020). Blockchain is a continuous sequence of blocks built according to certain rules, containing information about transactions made within the network (Fig. 1).
.")
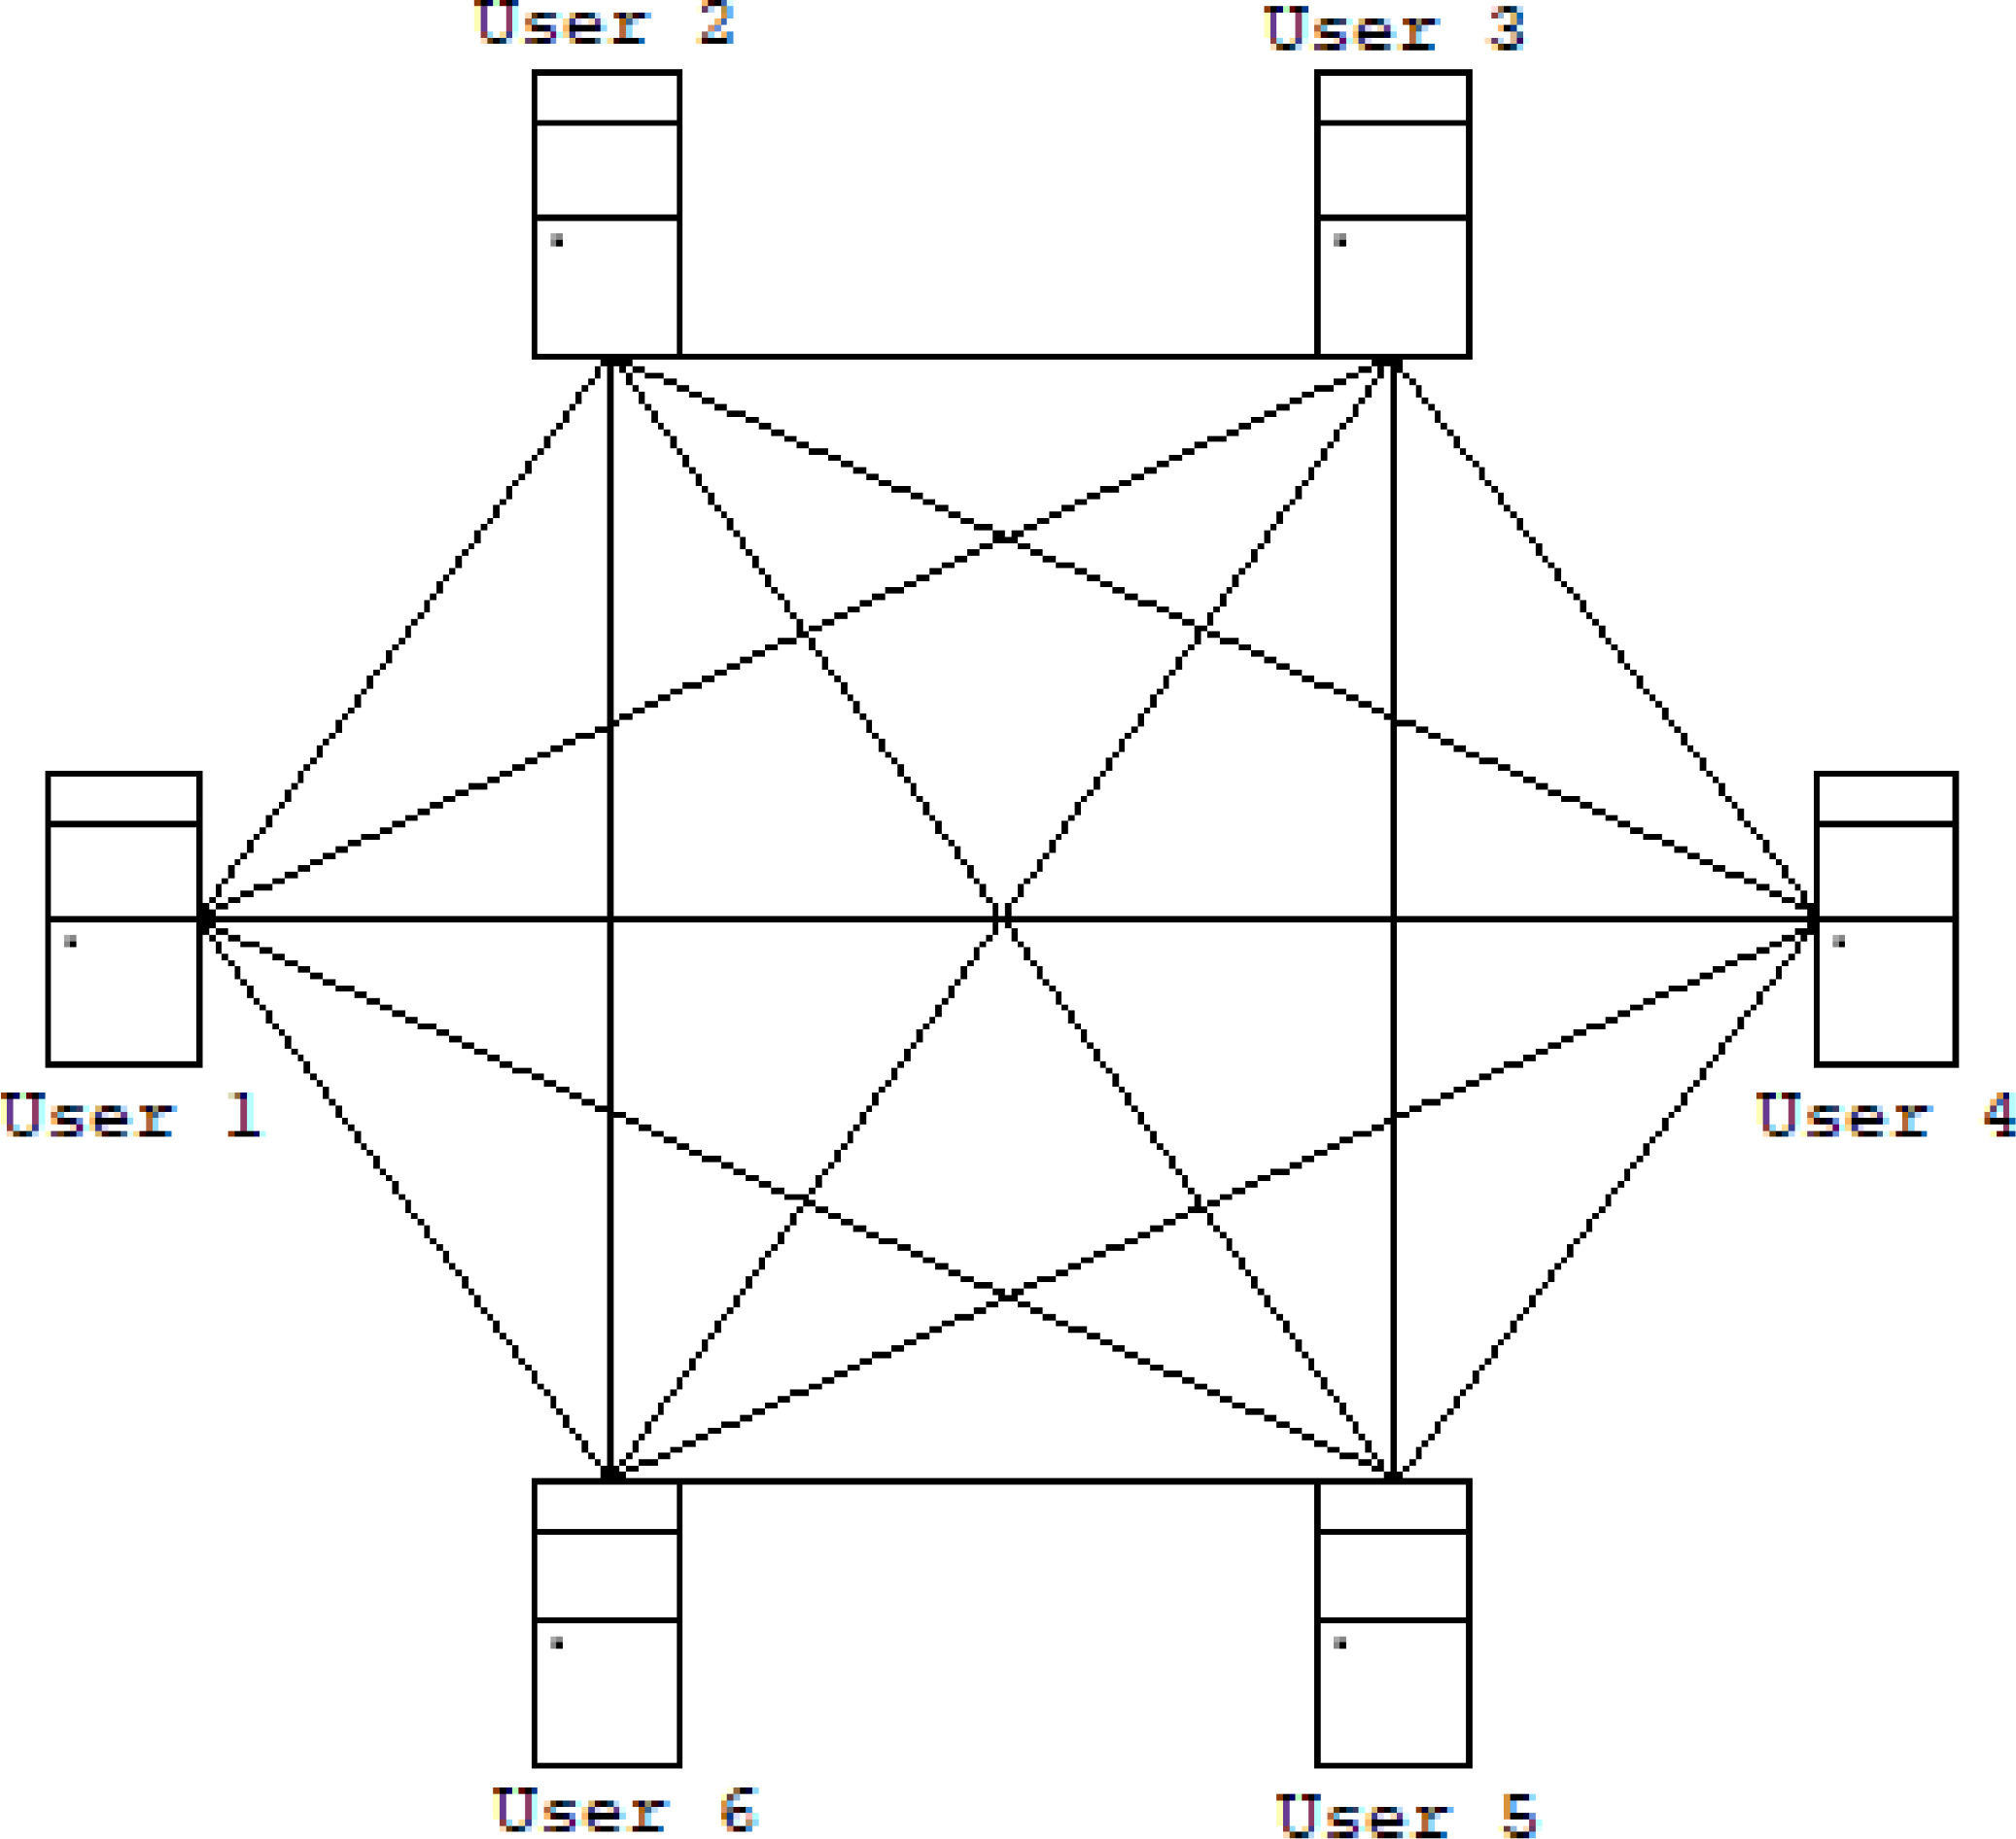
The blockchain technology used in the bitcoin cryptocurrency made it possible to implement a calculation method that completely excluded intermediaries between payment system users from the chain of monetary relationships (Böhme et al., 2015). The peer-to-peer data transfer architecture meant not granting network participants special rights as these could affect the system's performance, which made each user an equal client and a peer server for storing data (Kher et al., 2021; Omote et al., 2020; Huberman et al., 2021) (Fig. 2).

To date, many studies have now been published on the functioning of blockchain and cryptocurrencies (Daulay et al., 2017; Ali et al., 2019), their privacy, and anonymity (Zaghloul et al., 2019), aspects of the energy efficiency of cryptocurrency mining are considered in detail (Denisova et al., 2019; Meynkhard, 2019a; Huynh et al., 2022; Cong et al., 2021), and the level of their social-economic acceptance in society (Parino at al., 2018). Spontaneously created, the cryptocurrency market is beginning to confidently take its place in the finance industry as an alternative investment instrument and speculative asset (Karataeva & Sinyavsky, 2019). This is facilitated not only by the legitimization of the new instrument in the eyes of institutional investors and legislative bodies of countries, but also by the gradual introduction of the possibility of its sale and purchase in everyday life (Jacobs, 2018; Saiedi et al., 2021).
Investors are looking for objects that will allow them to successfully invest their funds, and they are evaluating the effectiveness of alternative markets and their instruments (Urquhart, 2016; Bariviera, 2017; Jiang et al., 2017). However, such mechanisms may not be appropriate in the current cryptocurrency market, since the underlying technology and market environment of cryptocurrencies are very different from those of traditional financial assets. The valuation metrics used in the stock market are categorically not applicable to the cryptocurrency market. This gave rise to great interest among analysts and representatives of the scientific community in a new and unexplored crypto phenomenon, which led to attempts to create an effective leading indicator that can predict the future direction of price movement for a selected cryptocurrency. In this regard, a large number of very high-quality scientific papers have been published on the short- and long-term investment analyses of bitcoin and other cryptocurrencies.
The authors of scientific articles assessed the investment opportunities of cryptocurrencies by analyzing their price volatility (Teker & Teker, 2020; Chevallier et al., 2021; Liu & Tsyvinski, 2021; Gradojevic & Tsiakas, 2021); correlations between cryptocurrencies and classic assets (Corbet et al., 2018; Ciaian et al., 2017); the impact of trading volumes (Balcilar et al., 2017), as well as the influence of global macroeconomic factors on pricing issues (Demir et al., 2018; Cheah et al., 2021). It is possible to state here some significant determinants of the bitcoin mempool. Some blocks make up the mempool. The size, transaction volume, and fee of each block guide mempool performance (Dae-Yong et al., 2020). Firstly, the mempool size is quite high when transactions pending confirmation are well accumulated (Mallikarjuna et al., 2020). This situation indicates that there is a high demand for bitcoin transfers in the network. Additionally to the aforementioned point, transaction fees can also be effective in this regard (Luo et al., 2020). For example, transactions with higher fees may take priority when approval times are longer for transactions (Mišić et al., 2020).
This study is aimed at evaluating bitcoin mempool priorities. Two different analyses have been conducted for this purpose. Firstly, the mempool periods are examined through statistical analysis. Secondly, the performance determinants of mempool are evaluated with q-ROF Multi-SWARA. In addition to q-ROF sets, weights are computed with IFS and PFS. The innovative feature here is that the role of mempool as a leading indicator will most accurately signal an impending change in trading volumes and bitcoin prices. As well, this study is novel in that it conducts a comparative evaluation using statistical analysis and fuzzy decision-making methodology. This strategy enables the analysis results to be verified, making possible the development of appropriate strategies in this area.
The aforementioned academic literature explores the predominantly historical behavior of cryptocurrency prices. However, it is worth noting that there are other ways to conduct investment evaluations, based not only on price data but also on technical indicators embedded in cryptocurrency blockchains (Meynkhard, 2019b). The literature about bitcoin trading volumes includes 4 main hypotheses about relationships between bitcoin mempool growth and trading volumes (Diaconaşu et al., 2022; Yousaf & Yarovaya, 2022).
The problem of blockchain scalability is the key concerning all the disadvantages of this technology. For example, the bitcoin network has a block with a size of 1 megabytes, and this feature helps protect against DDoS attacks, but the limited size interferes with the growth of bandwidth. In the bitcoin network, seven transactions can be carried out in one second, and more than twenty thousand in the Visa payment system. When the bitcoin price soars, the mempool reaches hundreds of thousands of unconfirmed transactions. Sarkodie et al. (2022) recently suggested that a supply and demand shock in the bitcoin mempool stimulates an increase in bitcoin trading volumes in the market (Erdogan et al., 2022). The existence of a relationship between bitcoin trading volume and mempool volume (Huynh et al., 2022) was assumed based on the analysis of time dependence between bitcoin trading volume and the state of the mempool. Due to the high transaction power of bitcoin transactions, mempool has proved to be an effective predictor of bitcoin trading volumes. Subsequently, this paper offers a hypothesis about the relationship between bitcoin trading volume and bitcoin network mempool volume:
Hypothesis 1
Mempool size (criterion 1) has an influence on BTC trading volume.
Wüstenfeld and Geldner (2022) found that the local volume in bitcoin system is linked with weight of bitcoin mempool, because the size of mempool transactions and trading volumes are very cointegrated. Będowska-Sójka and Kliber (2021) proposed this idea in their study. Meanwhile the results of Baur and Dimpfl (2018) suggest that positive mempool volume volatility is higher than a negative one on many occasions. With the growing popularity of cryptocurrencies, the number of transactions added for validation also increases, so not all transactions are approved at the same time. As a consequence, mempools are formed – this is a set of all transactions that are waiting for confirmation by miners on the network. Transactions form a queue to be added to the block for processing, and their sequence depends on the commission set by the sender. The higher the commission, the faster the miners will include an entry in the block. One of the disadvantages is energy consumption. For the mining process not only are powerful computing systems needed, it also consumes a significant amount of energy. A second hypothesis can be formulated:
Hypothesis 2
Mempool weight (criterion 2) has an influence on BTC trading volume.
Theoretically, the blockchain technology in mempool can be supplemented indefinitely. Reliability is extremely important in the modern computing world, and blockchain technology performs this function well. At the stage when the transaction is checked for correctness, an operation occurs that enables one to filter transactions and enter only legitimate ones into the database. However, blockchain technologies are imperfect and have disadvantages, for example, transaction quantity, since enough memory is needed to store all blockchain data. Marmora (2021) found that bitcoin demand is sensitive to local transactions quantity, because cryptocurrencies are substitutes in the black market. Therefore mempool transaction quantity can be one influential factor. Based on this argument the third hypothesis follows:
Hypothesis 3
Mempool transaction quantity (criterion 3) has an influence on BTC trading volume.
Previous research indicates that transaction fee in mempool can influence transaction volume (Ante et al., 2021). It is connected to the idea devised by Meybodi et al. (2022) about unconfirmed transactions and memes. Due to the growing popularity of cryptocurrencies, the number of transactions awaiting confirmation is growing daily. All transactions are not processed at the same time, so queues are formed from the same transactions (mempools). Thus, the research study posits Hypothesis 4:
Hypothesis 4
Fee in Mempool (criterion 4) has an influence on BTC trading volume.
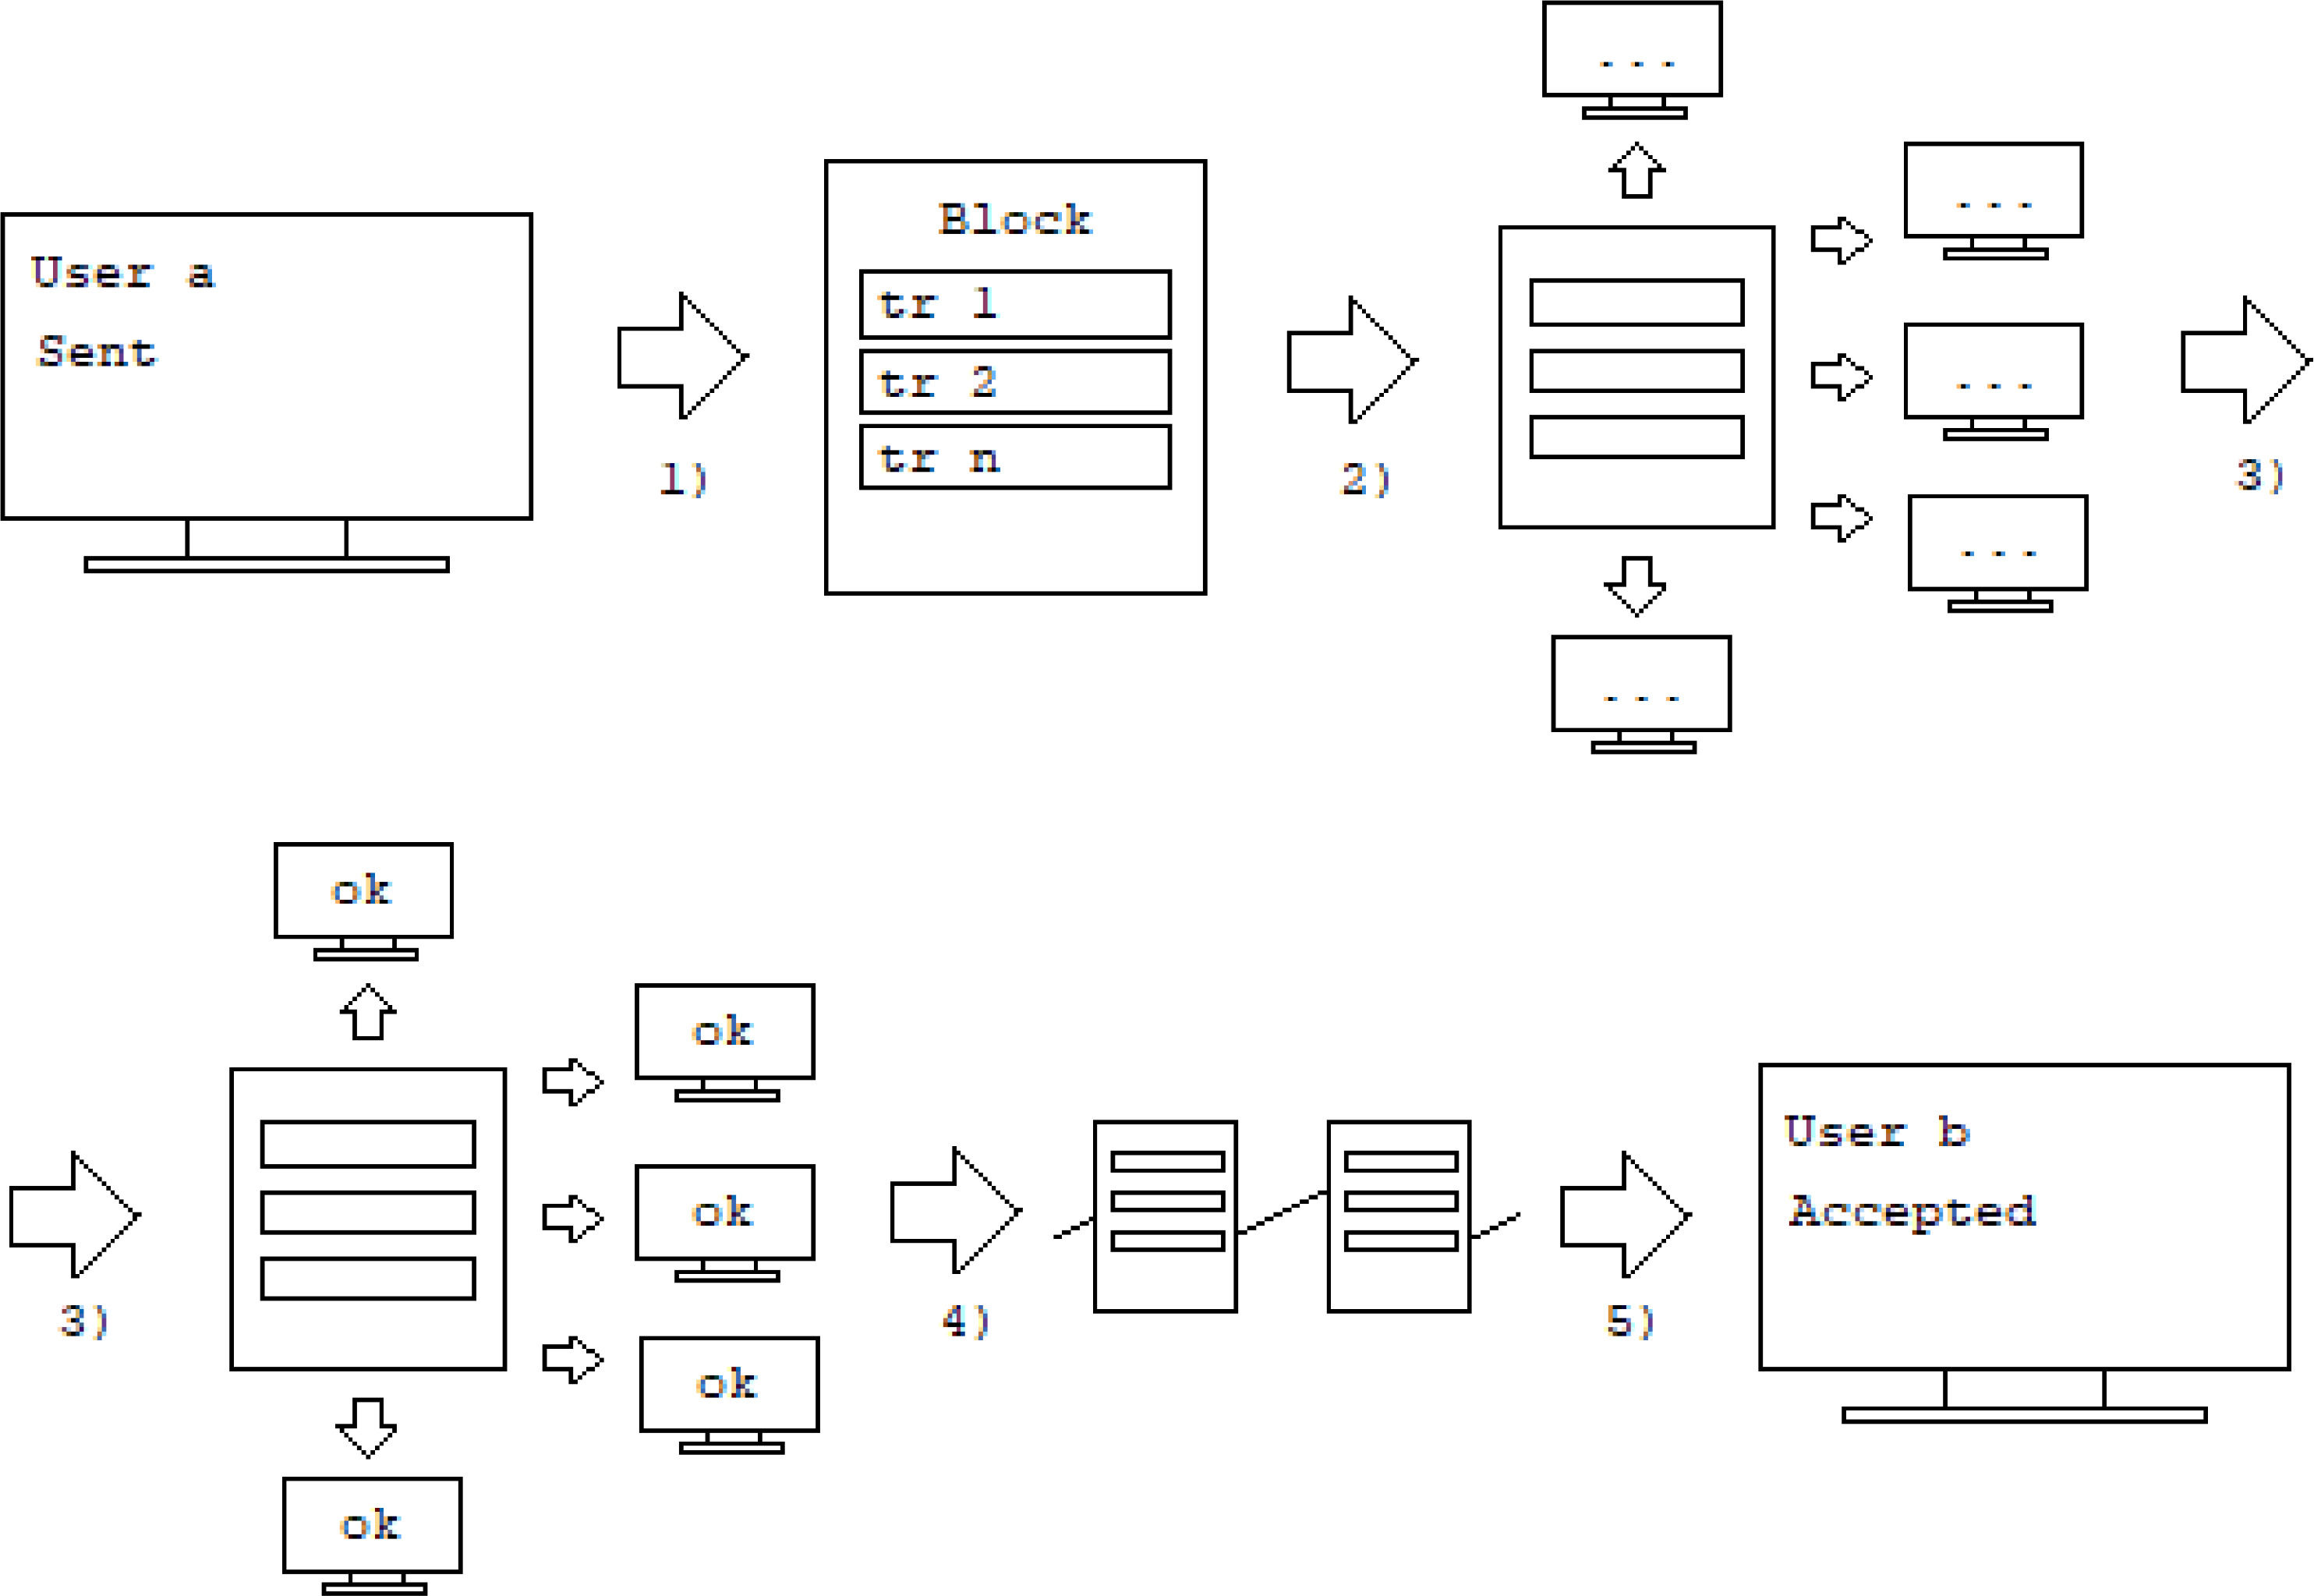
MethodologyMaterials and limitationsThe blockchain is the backbone of any cryptocurrency. The uniqueness of blockchain technology and the software algorithms embedded in it open up the ability to carry out transactions between users of the peer-to-peer network (Tsang & Yang, 2021). In the classic example, illustrating the performance of the bitcoin blockchain, there is always: the initiator of the payment-user A; receiving payment-user B; network participants confirming the payment-miners; and amount of transactions-block of transactions (Fig. 3):
- 1)
User A initiates a BTC (a unit of value in the bitcoin network) transfer to user B. After making a payment, the transaction enters the network and is sent to the transaction block;
- 2)
Miners validate the block of transactions by using computing power;
- 3)
After validation, the block of transactions is sent to all participants in the blockchain to confirm their legality and correctness;
- 4)
The validated block of transactions is embedded in the blockchain after its legality and correctness are confirmed; and
- 5)
User B receives a BTC transfer from user A as soon as the block (including the pool of committed transactions) is embedded in the blockchain.

The blockchain functional scheme presented in Fig. 3 is correct and accurately reflects the mechanism for carrying out payment transactions in a decentralized network. However, this scheme does not include a very important but neglected detail—the mempool of a transaction. The mempool is a transaction queue resulting from the low throughput of the bitcoin network due to: (i) the limited size of the transaction block (MB); and (ii) its fixed generation time-once every ten minutes. Since there is no definition of mempool in the scientific literature, the author decided to provide the classic, most accepted definition in the professional environment; namely, a mempool is a set of transactions awaiting confirmation in the bitcoin network.
Since the inception of bitcoin, its blockchain network did not provide for restrictions on the size of the block of transactions, which implies the absence of transaction queues. However, in 2010, network users, by a majority vote, decided to impose restrictions on the size of the transaction block, setting the limit at 1 MB. This was done so that attackers could not undertake DOS attacks by sending a large volume of small transactions, thereby overloading the poorly developed blockchain at that time and reducing its bandwidth. For the next six years, since the restrictions were adopted, there were no problems with making payments on the bitcoin network. However, with the rise in popularity of decentralized finance, transaction volumes began to rise, leading to the emergence of the mempool.
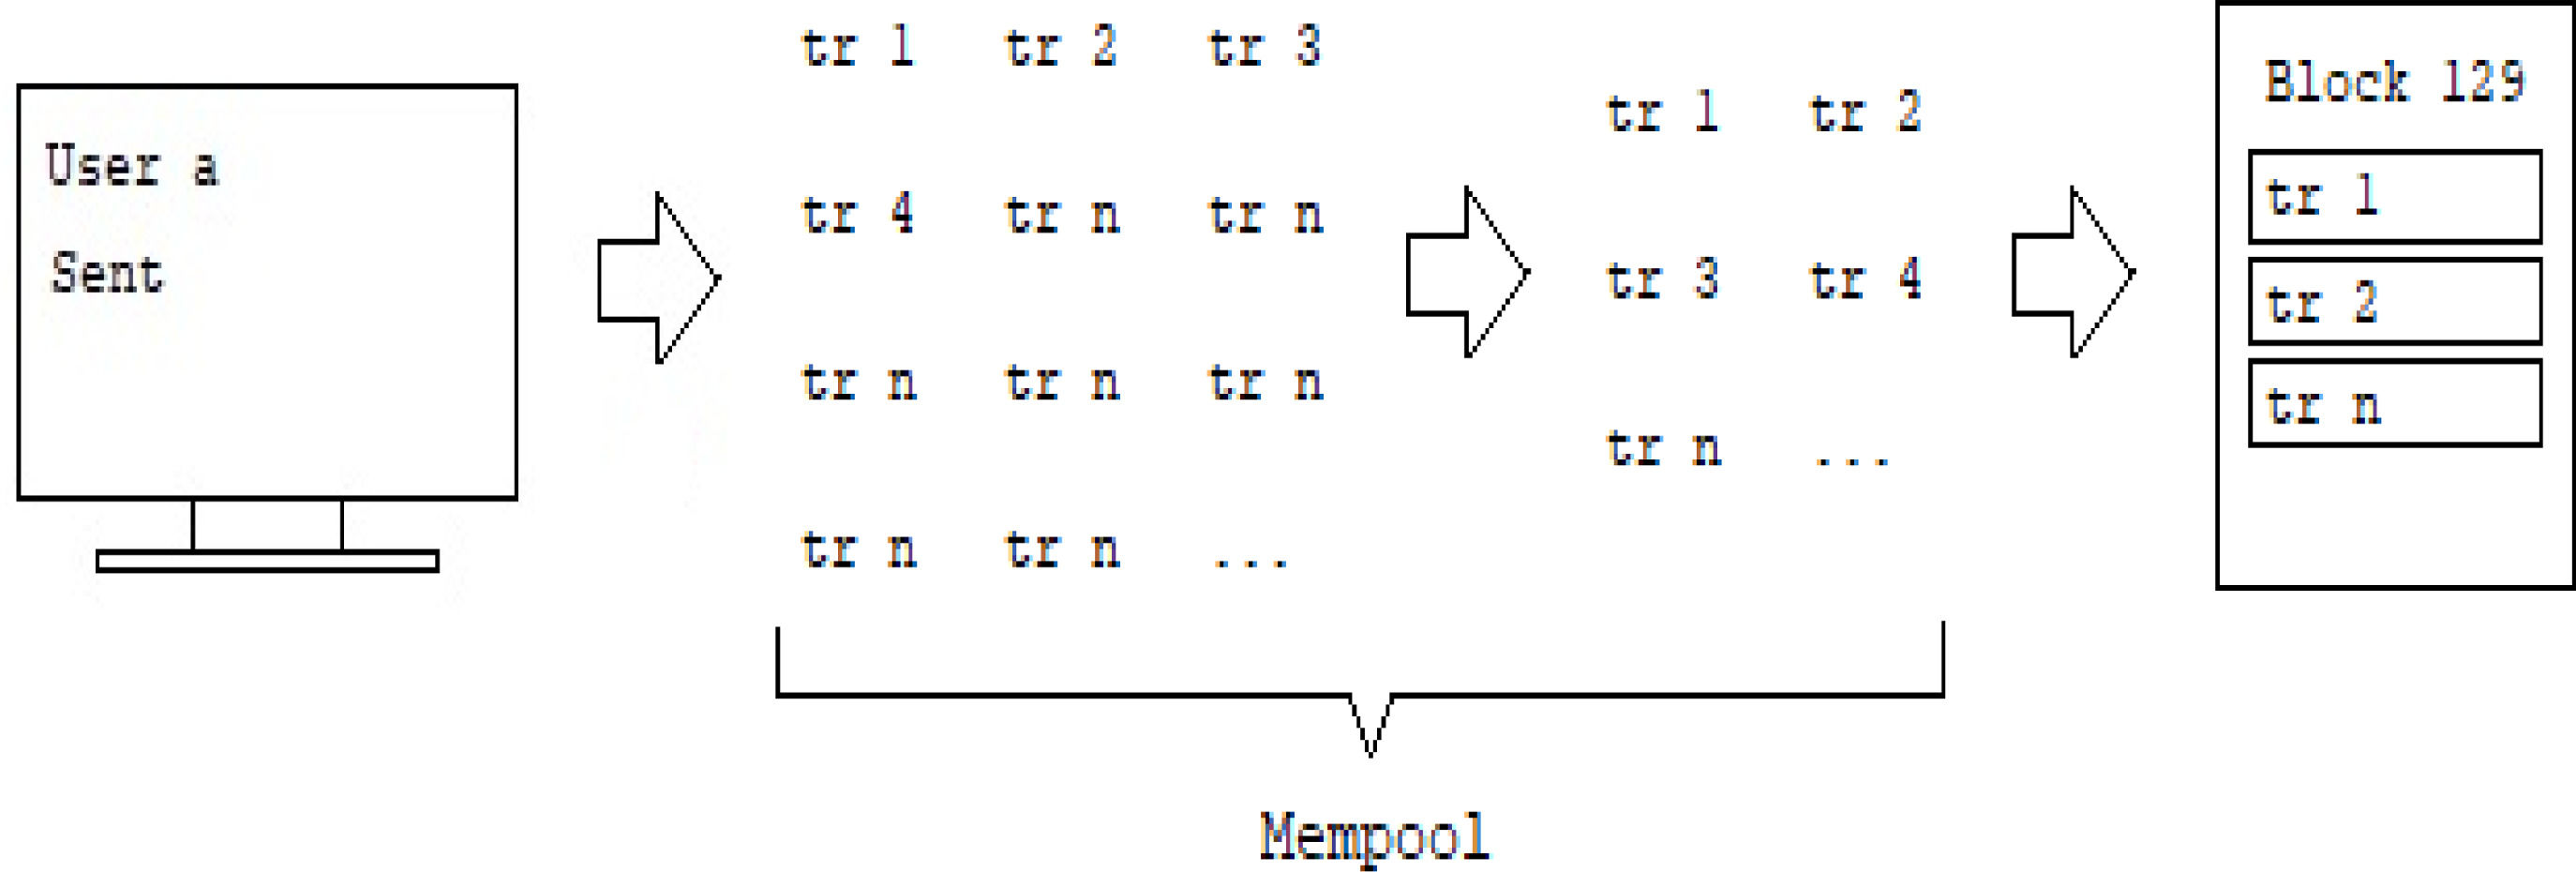
Currently, during the first stage of a transaction in the bitcoin network (Fig. 3), each user-initiated transaction falls into the area of unconfirmed transactions (Fig. 4) and will remain there until the miners include this transaction in the block of transactions. The movement of a bitcoin transaction in the mempool is based on the first-come-first-out queue principle, and in order for a transaction to get into the "block of transactions", it needs to "defend its turn" (Fig. 4).

The author noticed a pattern: a significant short-term change in the size of the mempool leads to no less significant changes in the trading volumes of bitcoin and its market prices. When the size of the mempool increases as a result of transactions initiated by network participants, this is reflected in a significant impetus to the growth of the volume of transactions performed in the market. Historically, cash flow indicators most effectively reflected the mood of the masses in relation to a financial asset or the market as a whole, both in the short- and long-term. Since bitcoin was originally created as a decentralized payment system, and not as a financial asset (Chimienti et al., 2019) traded on cryptocurrency trading platforms, the author conducted a quantitative and qualitative analysis of all indicators related to cash flows within the blockchain networks of bitcoin. The following indicators were analyzed: the number of transactions in the block; the cost of transactions denominated in BTC and US dollars; the number of confirmed transactions per day, etc.
The most effective indicator that displays up-to-date information on the state of future cash flows of the bitcoin network is the mempool of transactions. Firstly, mempool can predict an increase in future cash flows with 100% accuracy by displaying the growth in the number of transactions awaiting confirmation but not yet confirmed in real-time. Secondly, mempool has no absolute boundaries and can be measured in hundreds of megabytes, thereby correctly projecting the short-term mood of network participants, regardless of the scale of transactions initiated by users.
The purpose of this article is to reveal the relevance of the thesis: the growth of mempool transactions is a leading indicator of the growth of bitcoin trading volumes and its price volatility. As mentioned above, investors are looking for objects to make a successful investment of their funds, evaluating the effectiveness of alternative markets and their instruments. The non-standard use of bitcoin mempool as a short-term indicator of changes in trading volumes and market prices contributes to the qualitative disclosure of investment opportunities that the cryptocurrency market opens up.
q-rung orthopair fuzzy setsIntuitionistic fuzzy sets aim to achieve more appropriate results by identifying the membership and non-membership degrees (μ−I.,ϑ,.,n−I.,ϑ.) as shown in Eq. (1). In this case, the condition of 0≤,μ−I.,ϑ.,+,n−I.,ϑ.≤1 should be met (Atanassov, 1986).

As stated in Eq. (2), additionally, Pythagorean fuzzy sets define a novel class of non-standard fuzzy membership grades (μP,nP) (Yager, 2013).

For this purpose, the condition in Eq. (3) should be satisfied.

As an extension to IFS and PFS, q-rung orthopair fuzzy sets (q-ROFSs) are generated. They aim to provide solutions to complex decision-making problems. The main superiority of these sets is that they consider more space than the others in this process. Eq. (4) explains this situation in which μQ and nQ represent the grades (Yager, 2016).

Eq. (5) gives information about the conditions.

Eq. (6) includes the degree of indeterminacy.

Eqs. (7)–(11) include the details of the calculation.


Eq. (12) is used for defuzzification.
Proposed decision-making approach with m-swara and q-ROFSs
SWARA aims to weigh different criteria by considering the hierarchical priorities of the experts. An extension of SWARA is generated in this study with the aim of multi-SWARA. The relationship matrix of the criteria is created with the help of linguistic evaluations as shown in Eq. (13) (Rani et al., 2020).

Next, q-rung orthopair fuzzy sets are constructed with Eq. (5). Additionally, Eq. (12) is used to calculate the score function. The values of sj, kj, qj, and wj are defined by Eqs. (14)-(16).


In this framework, sj provides information about comparative importance rate. In contrast, kj represents the coefficient value. Meanwhile, wj demonstrates the weights of the criteria under the q-ROFNs (Torkashvand et al., 2021). Following that, Eq. (17) generates the q-rung orthopair fuzzy decision matrix.


The q-rung orthopair fuzzy weighted average (q-ROFWA) and q-rung orthopair fuzzy weighted geometric (q-ROFWG) are then constructed using Eqs. (18) and (19).
AnalysisEvaluating the mempool periods

For ease of further calculations, the initial data on the state of the mempool of transactions of the bitcoin network is raw and historically reflected in bytes. The first step is to convert the values from bytes to megabytes. Since 1 Mb = 1048,576 bytes, it is necessary to find the quotient for each of the time intervals (days) of the presented data sample:
where MS(Mb) is a mempool size in megabytes; MS(byte) is a mempool size in bytes.
In order to smooth out short-term fluctuations in time series and highlight the main, significant trends in the direction of movement of mempool, within the model's framework, it is necessary to find 30-day and 7-day simple moving averages (SMA) using time series data. The simple moving average is a very popular technical indicator in the stock market. It is used by traders as one of the tools to signal a change in the trend of price movement for a selected asset. The Simple Moving Average, or Moving Arithmetic Average (SMA), is numerically equal to the arithmetic average of the original function's values over a specified period and is calculated using the following formula:
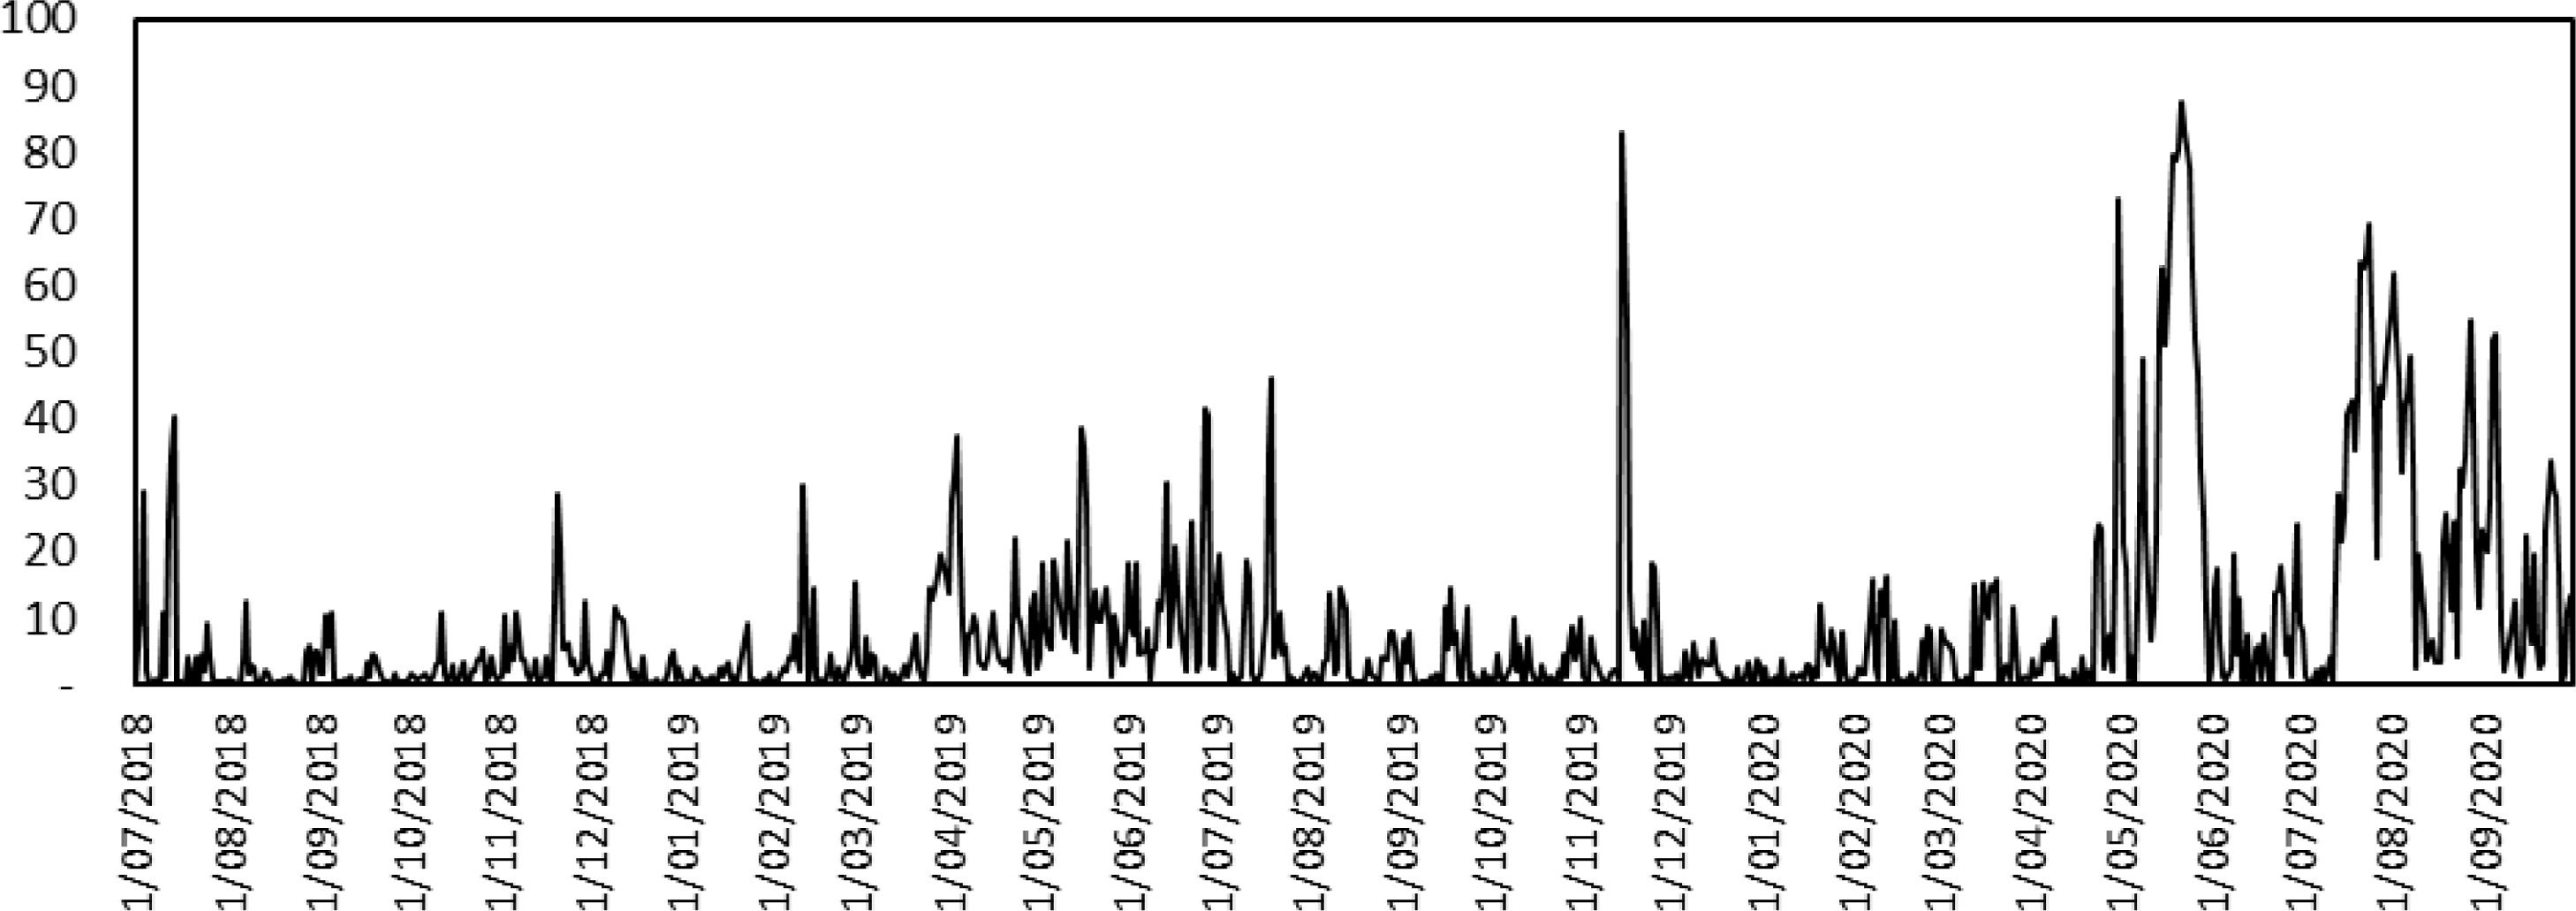
where SMAt denotes the value of the simple moving average at time t, n stands for the number of values in the original function used to calculate the moving average, and pt-n represents the value of the original function at time tn. The values of the 30-day and 7-day simple moving average in this analysis were not chosen by chance. The mempool of transactions is a rapidly changing indicator (Fig. 5), where values representing its status can change significantly within one week.

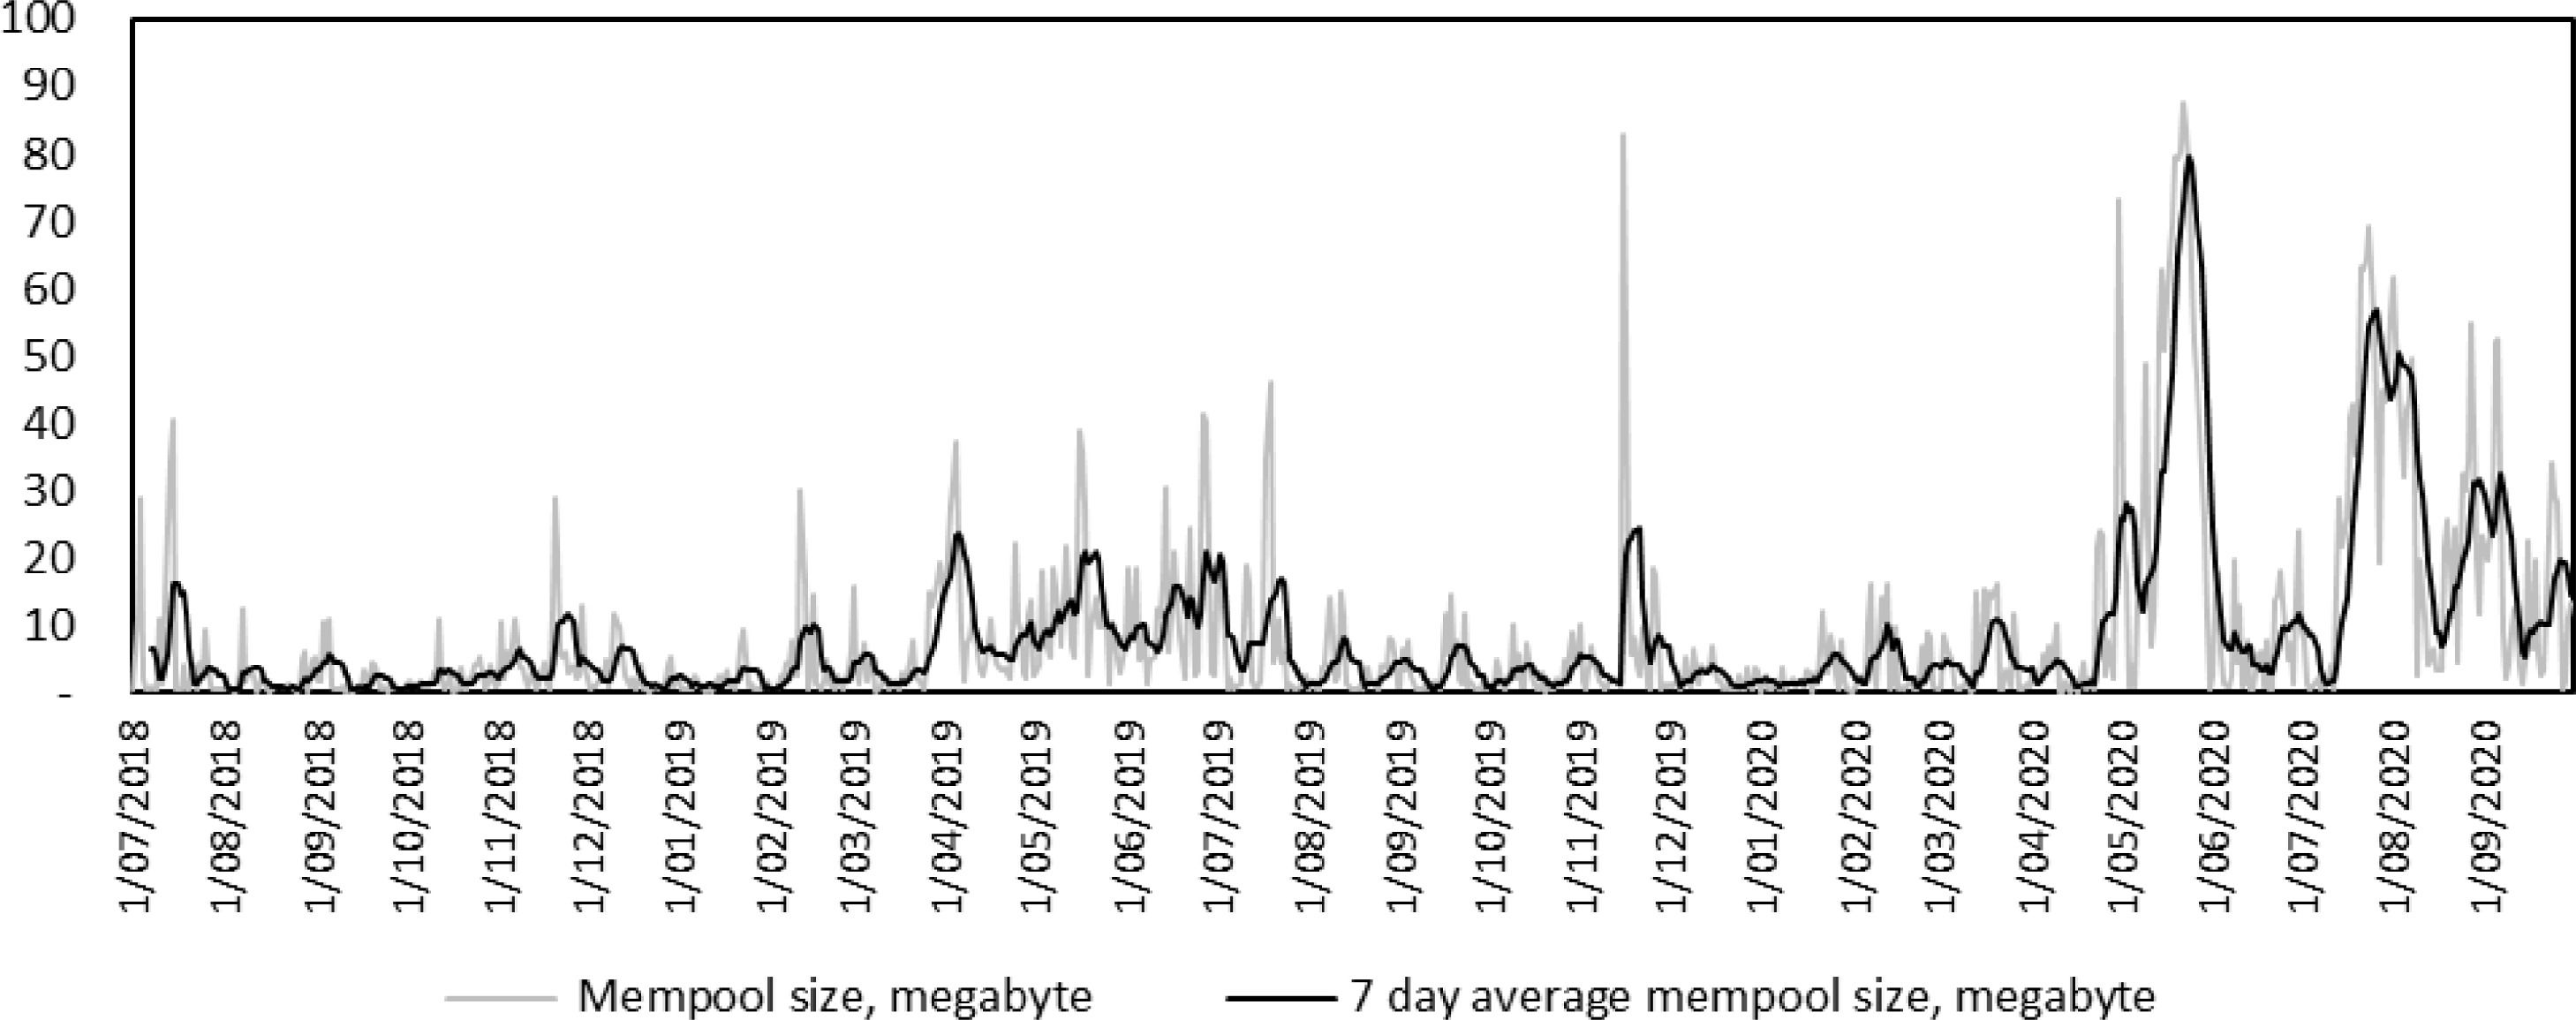
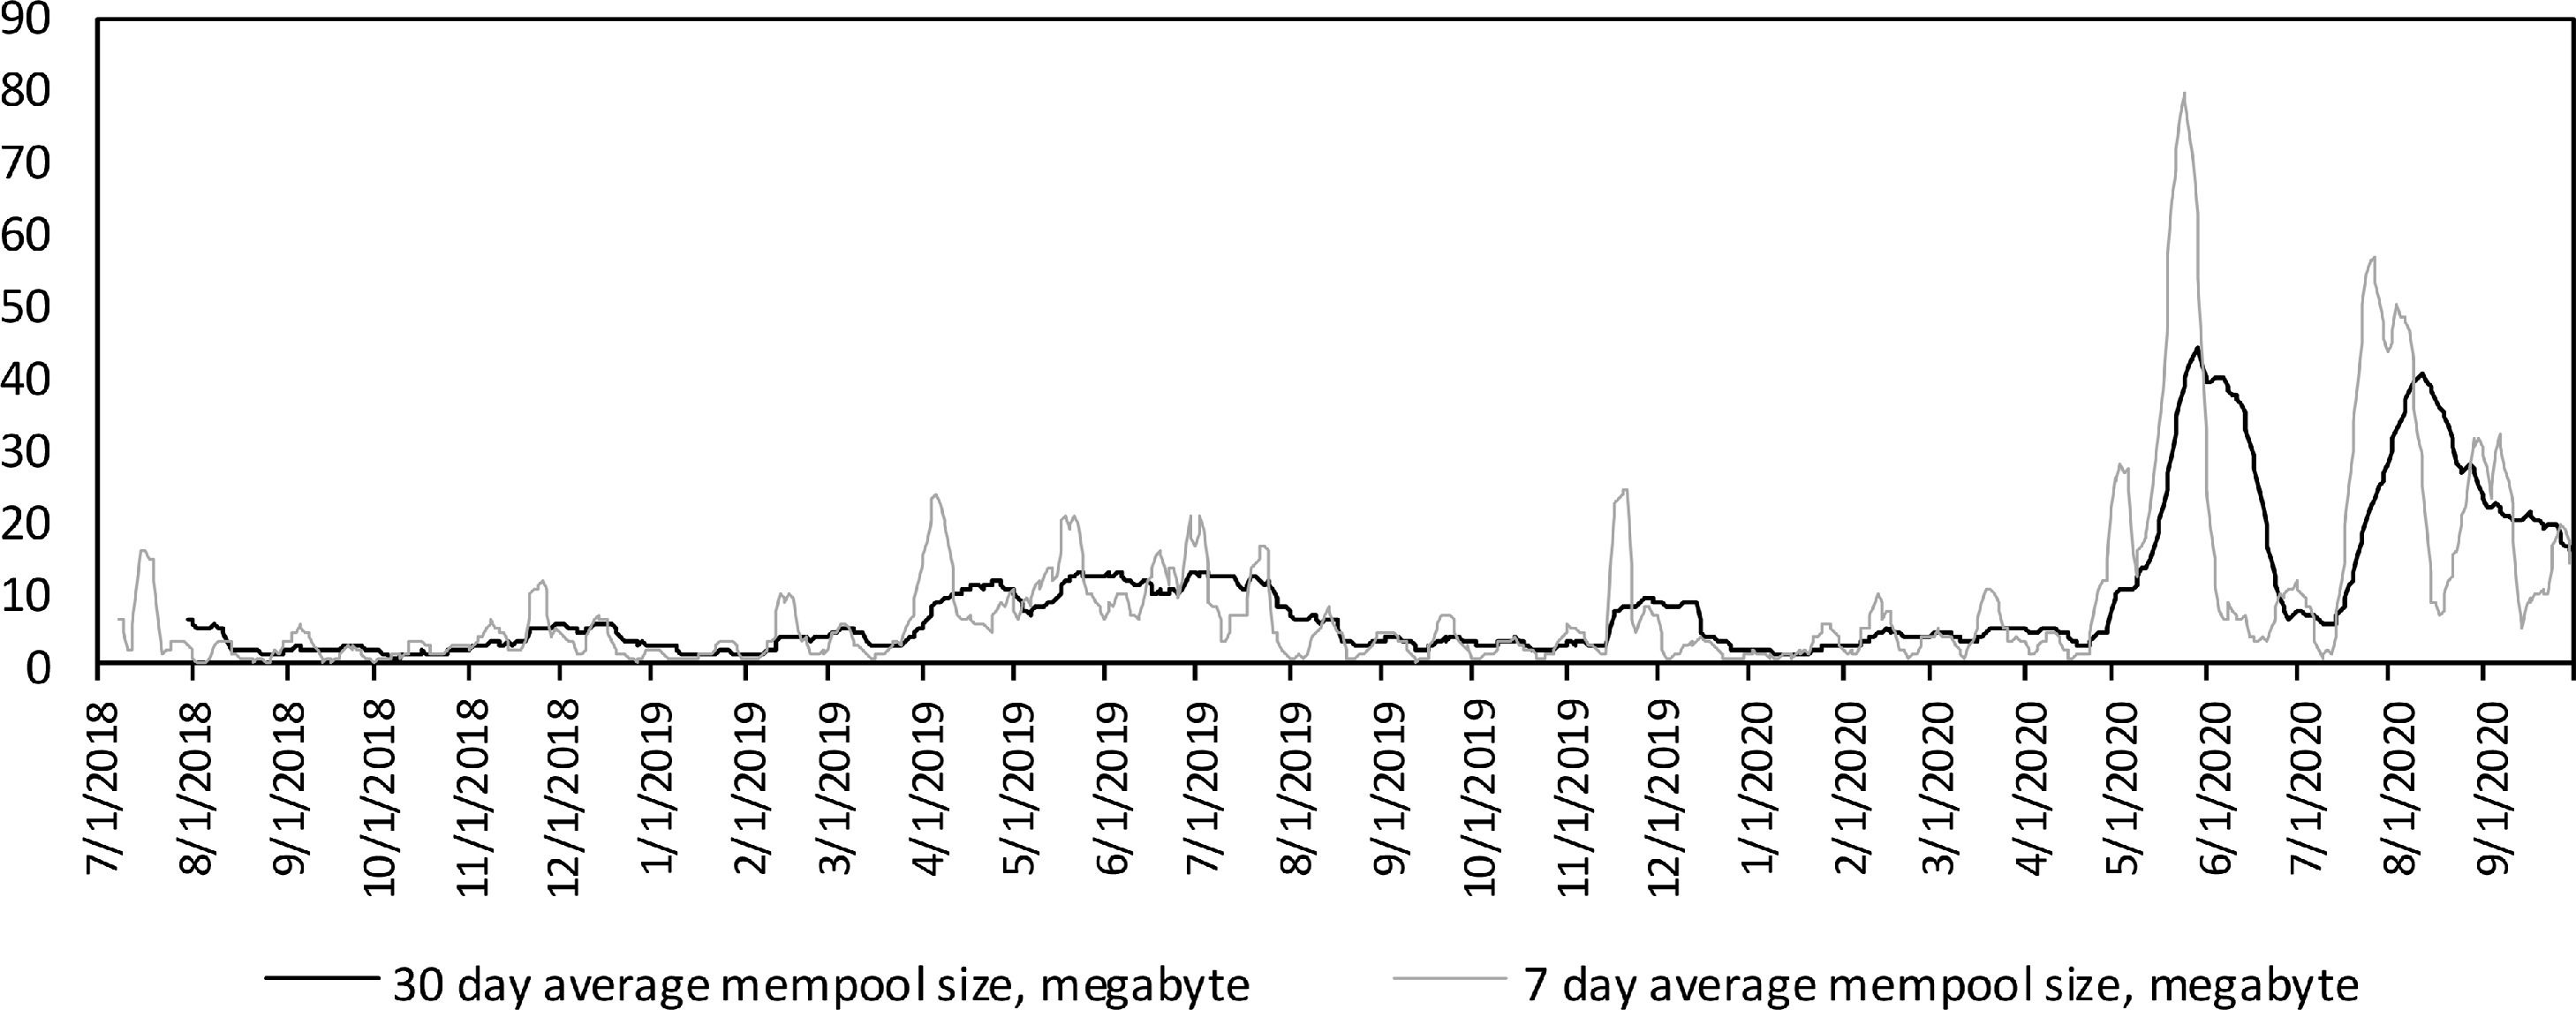
A simple 7-day moving average is able to neutralize minor short-term impulses of mempool growth and neutralize significant but isolated cases of growth (local outliers). At the same time, SMA-, 7. allows one to remain flexible and not miss significant changes in the bitcoin mempool (Fig. 6). Meanwhile a simple 30-day moving average is an essential part of building a model SMA-,. 30. is the basis of the trend in the direction of movement of mempool and reflects the average value of the mempool over the number of days in multiples of one month. Unlike, SMA(Mb)7, which displays the short-term mood of the bitcoin network participants, SMA(Mb)30 is able to correctly display medium-term sentiments, leveling out short-term mempool growth impulses. It is less flexible than SMA(Mb)7 and has a shallower trend line.

The 7-day SMA is found using the formula above (22) and looks like:
where SMA(Mb)7 is the simple 7-day moving average (megabytes), 7 is the number of days of the original function to calculate, the moving average, and pt−7 is the original function's value at point t7.
The 30-day SMA is found using the formula above (23) and looks like:
where SMA(Mb)30 is the simple 30-day moving average (megabytes), 30 is the number of days in the original function used in the calculation, the moving average, and pt−30 is the value of the original function at t30 (Fig. 7).

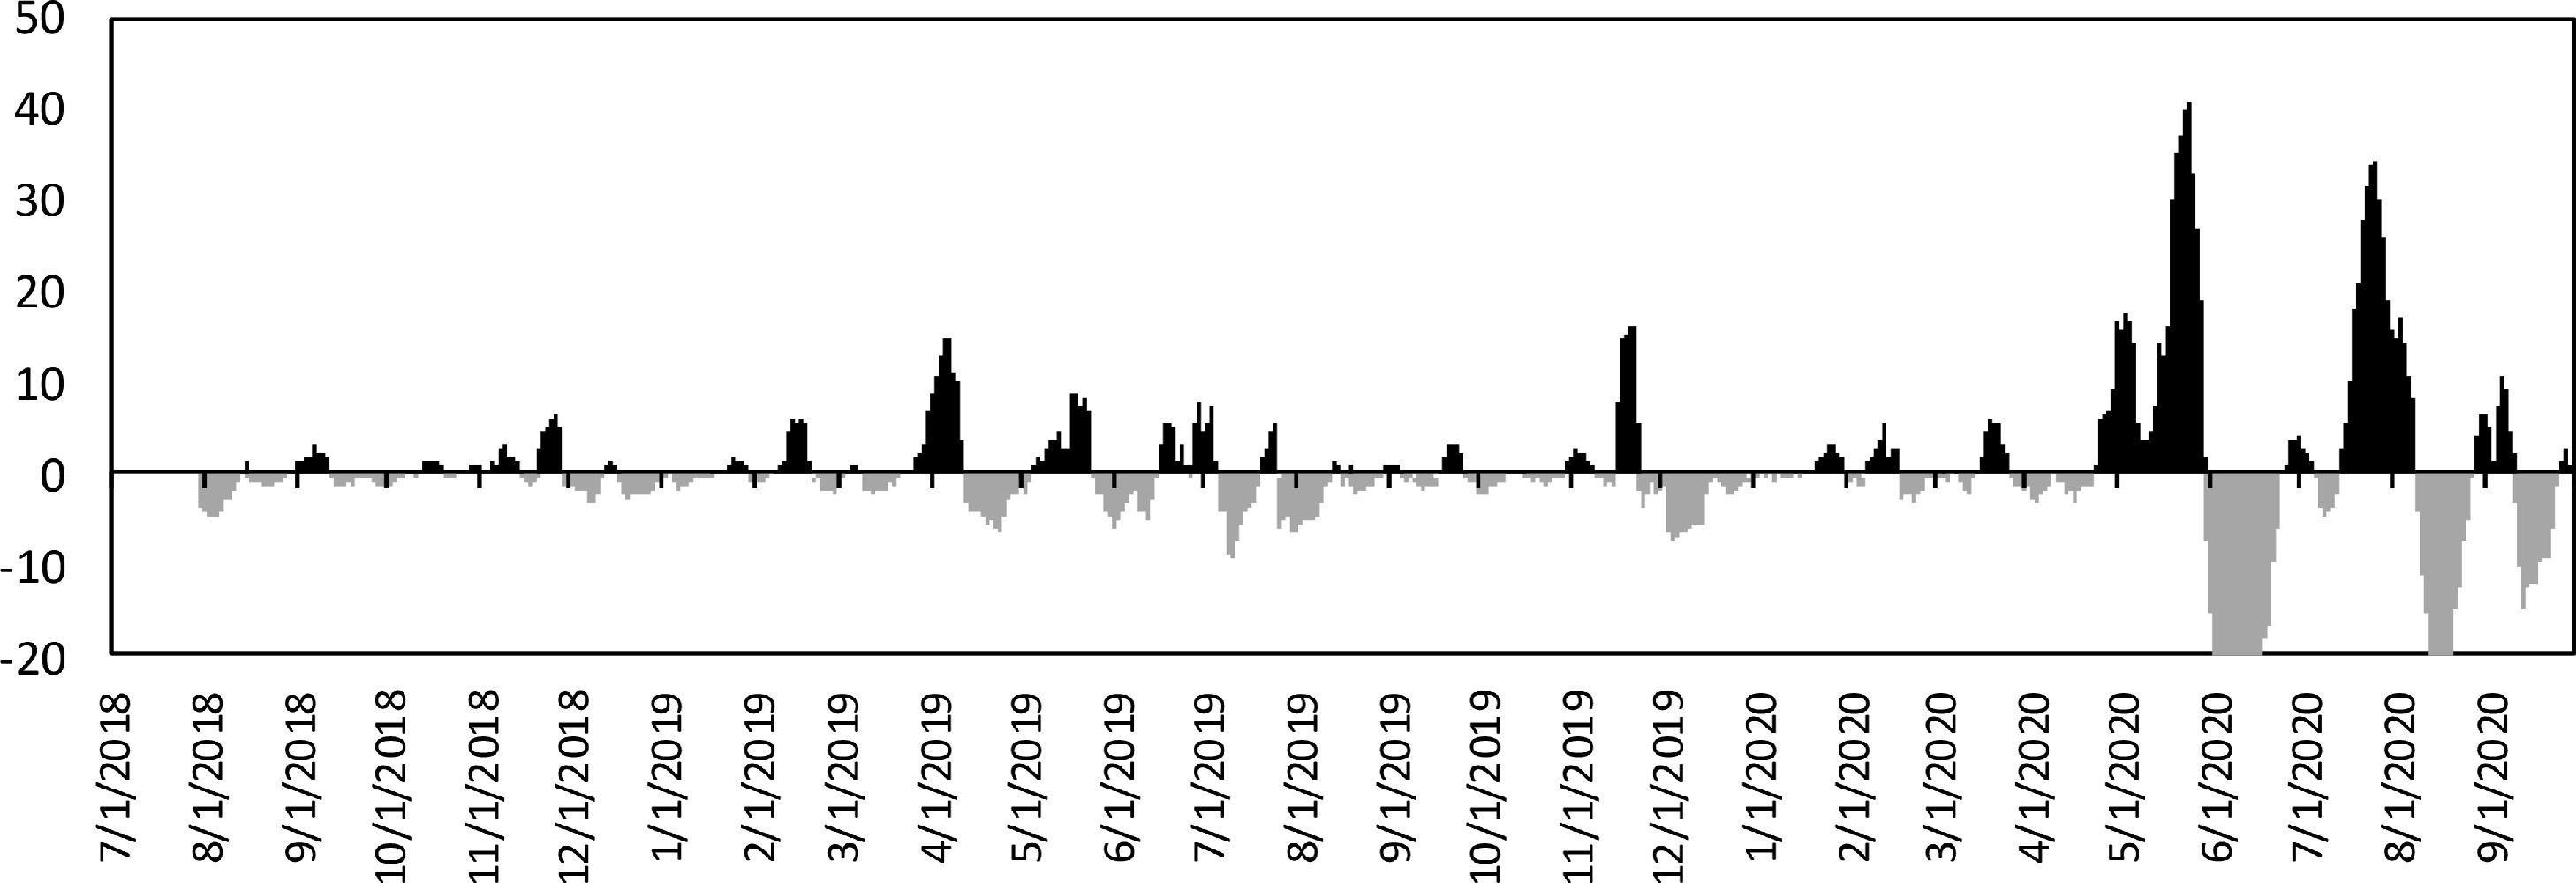
Subsequently, for a more convenient perception of the results obtained, we transform the processed data for SMA(Mb)7 and SMA(Mb)30 into a linear graph of positive (significant) and negative (insignificant) values formula:
where SMA(Mb)7 stands for the simple 7-day moving average (megabytes), SMA(Mb)30 is the simple 30-day moving average (megabytes), ΔMS denotes the difference between a 30-day SMA and a 7-day SMA (Fig. 8).

As mentioned above, a mempool is a set of transactions awaiting confirmation on the bitcoin network, and a mempool is a future cash flow that is just about to happen.
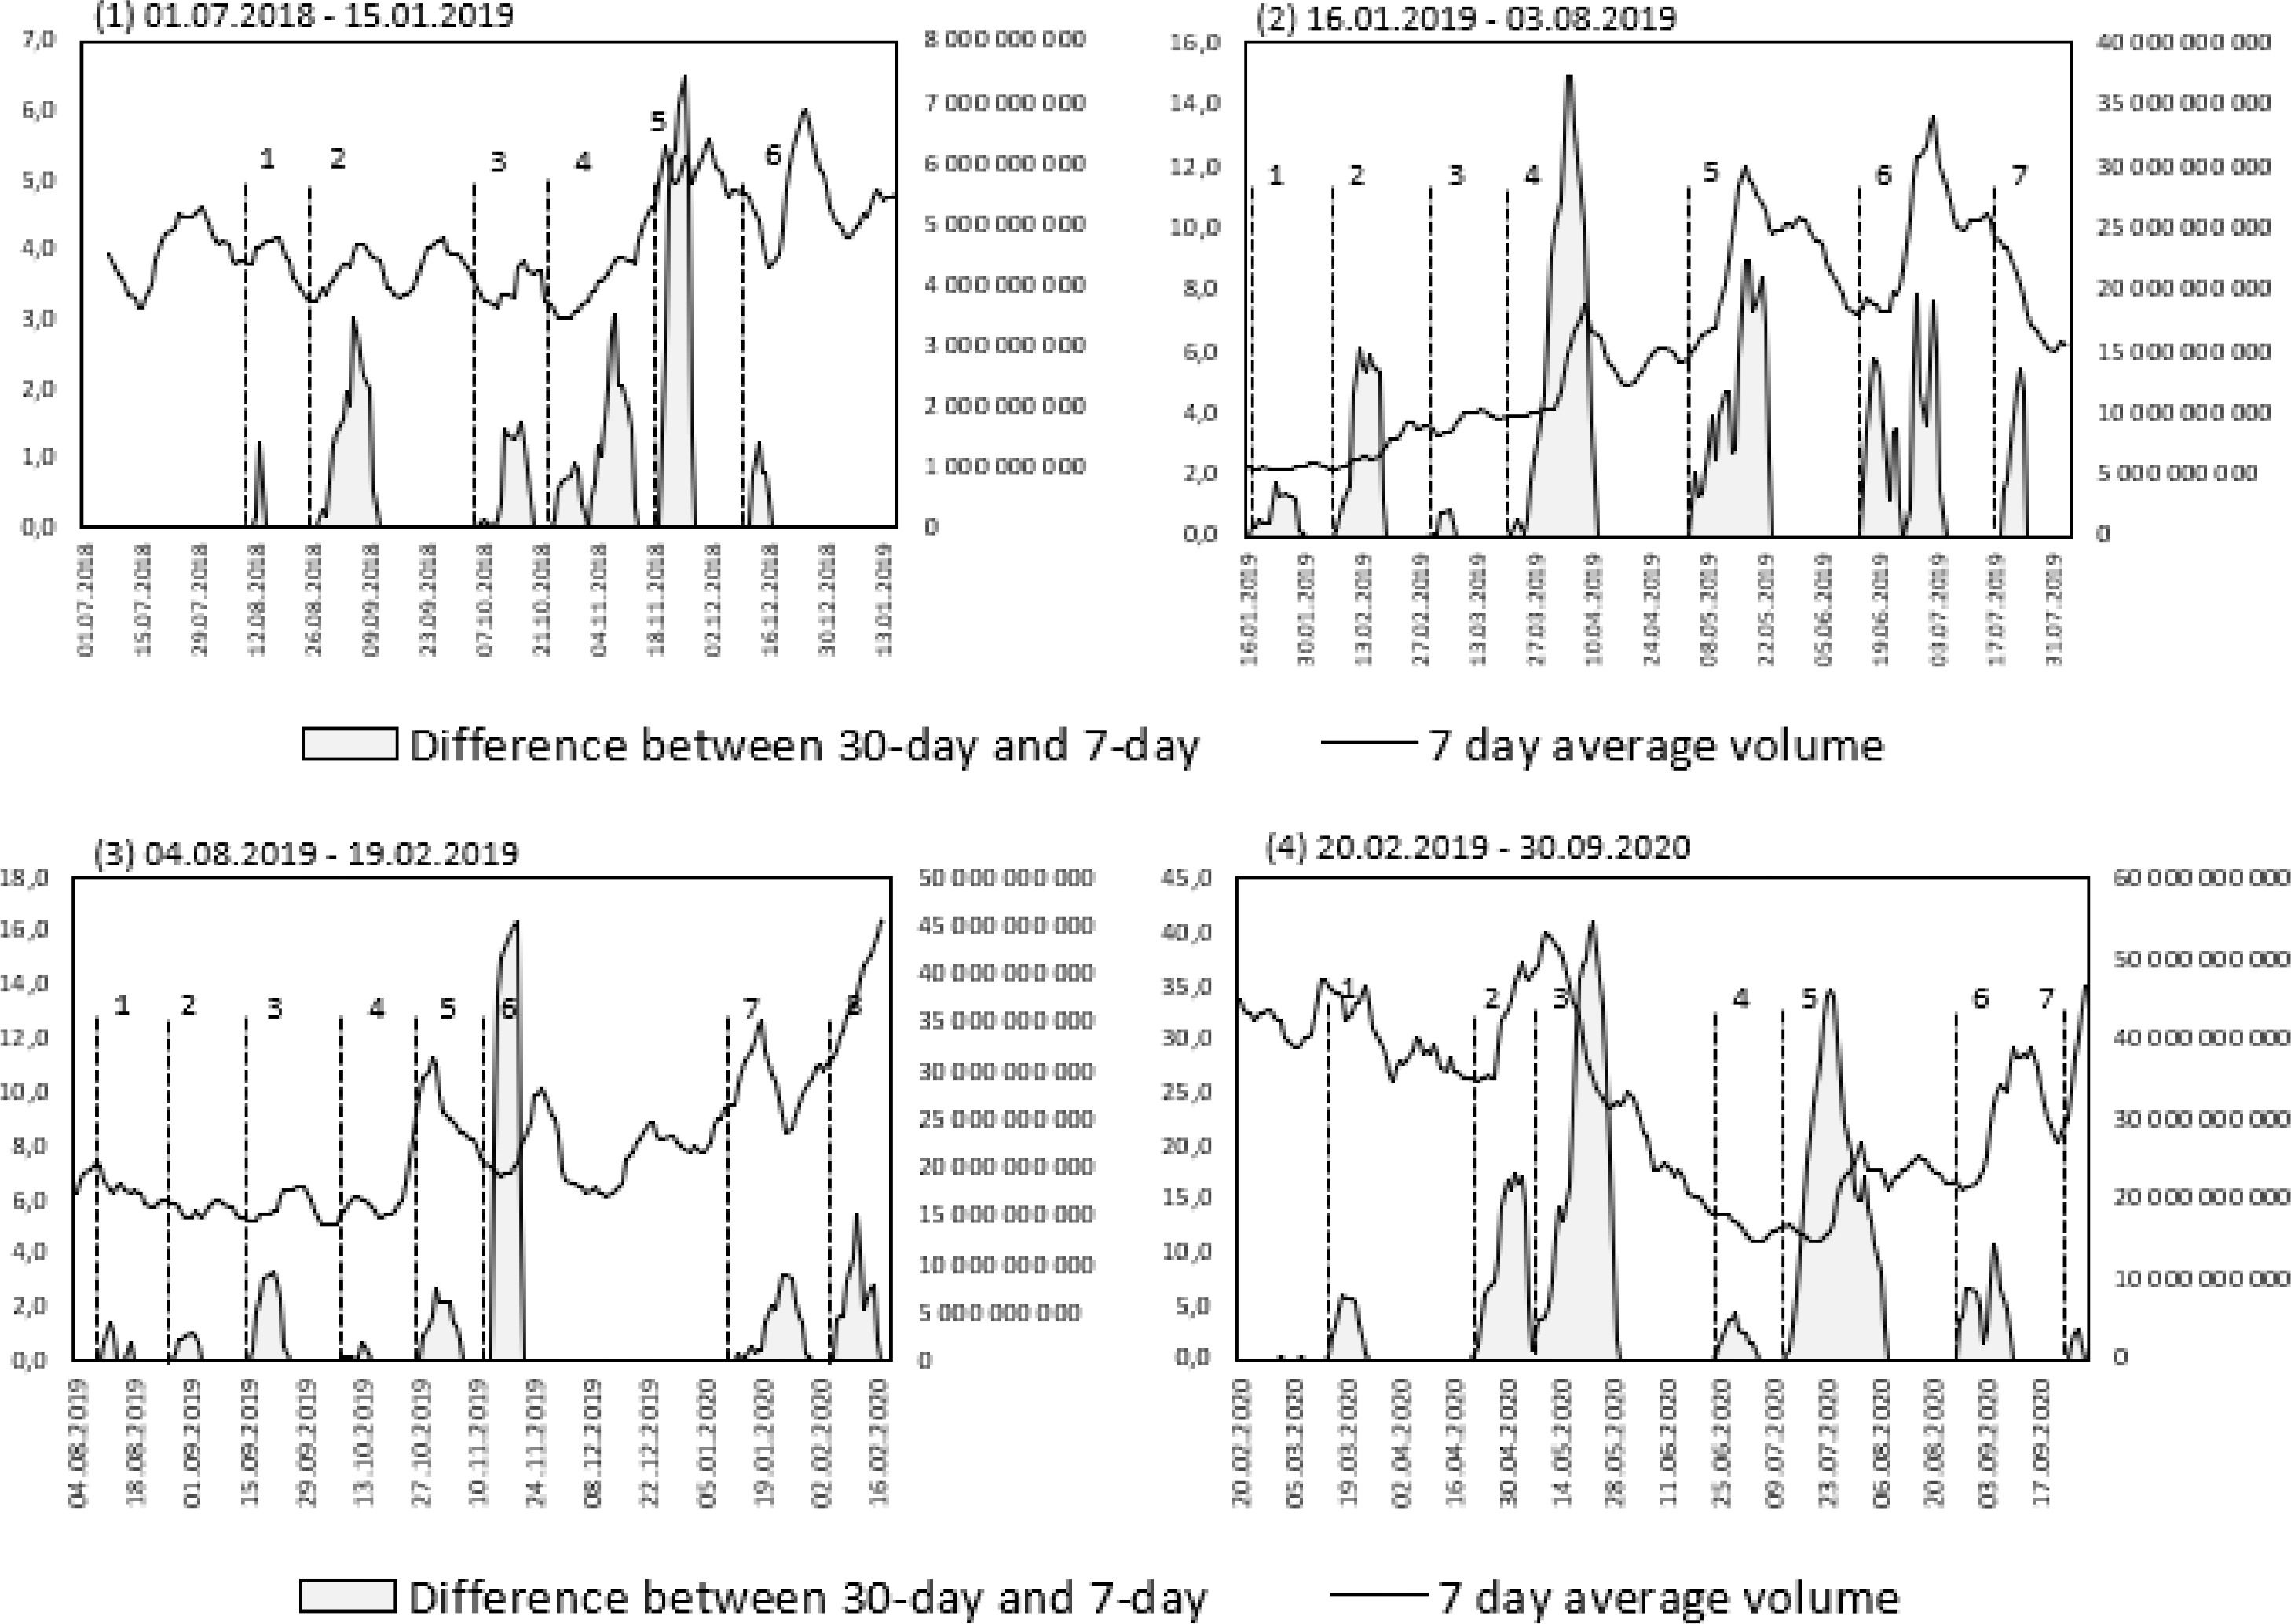
Fig. 9 presents data on the relationship of positive difference SMA(Mb)7over SMA(Mb)30 in comparison with SMA7 in terms of global bitcoin trading volumes in the analyzed interval - July 1, 2018 - September 30, 2020 (823 data periods), divided by four-date coordinates, approximately 200 days each. Fig. 9 (1–4) clearly depicts the outpacing dynamics of the bitcoin network's mempool growth prior to the increase in the 7-day SMA of global bitcoin trading volumes, which is sensitive to short-term changes.
 and the 7-day SMA of bitcoin trading volumes (USD).")
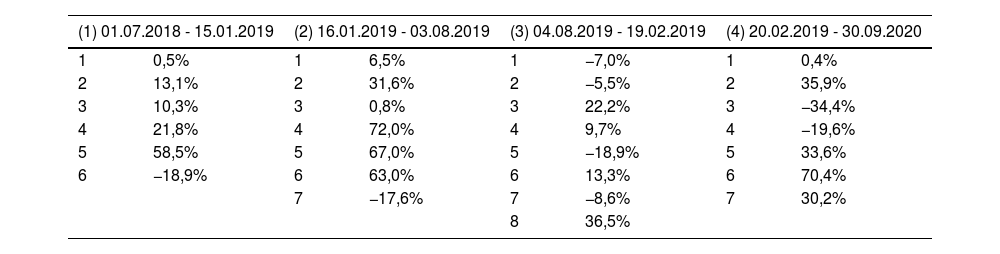
Positive values for the difference between SMA(Mb)7 and SMA(Mb)30, which cover the largest changes in the bitcoin mempool (having neutralized minor short-term growth impulses and significant, but isolated cases of growth-local emissions), led to an effective selection of not yet happened, but expected increases in bitcoin trading volumes (Fig. 9; Table 1; Table 2).
Dynamics of the trading volume of bitcoin according to the 7-day SMA during the growth of the positive mempool difference on the bitcoin network.
| (1) 01.07.2018 - 15.01.2019 | (2) 16.01.2019 - 03.08.2019 | (3) 04.08.2019 - 19.02.2019 | (4) 20.02.2019 - 30.09.2020 | ||||
|---|---|---|---|---|---|---|---|
| 1 | 0,5% | 1 | 6,5% | 1 | −7,0% | 1 | 0,4% |
| 2 | 13,1% | 2 | 31,6% | 2 | −5,5% | 2 | 35,9% |
| 3 | 10,3% | 3 | 0,8% | 3 | 22,2% | 3 | −34,4% |
| 4 | 21,8% | 4 | 72,0% | 4 | 9,7% | 4 | −19,6% |
| 5 | 58,5% | 5 | 67,0% | 5 | −18,9% | 5 | 33,6% |
| 6 | −18,9% | 6 | 63,0% | 6 | 13,3% | 6 | 70,4% |
| 7 | −17,6% | 7 | −8,6% | 7 | 30,2% | ||
| 8 | 36,5% | ||||||
Indicators of the dynamics of the trading volume of bitcoin during the growth of positive mempool difference in comparison with the total values of the trading volume.
| Selected period: July 1, 2018 - September 30, 2020 | ||
|---|---|---|
| Total average for the period (1), (2), (3), (4): | 16,7% | |
| Total median for the period (1), (2), (3), (4): | 11,7% | |
| Maximum value of growth in trading volumes: | 138,9% | |
| Dynamics of trade volumes, average: | 1,90% | |
| Dynamics of trade volumes, median: | 1,16% | |
| The maximum value of the decrease in trading volumes: | −51,2% | |
So, for the period July 1, 2018 - September 30, 2020 (823 data periods), the moving average model showed 28 cases of crossing SMA(Mb)7 over SMA(Mb)30:
- 1.
In 60% of cases, mempool functioned as a leading indicator of a significant increase in trading volumes, on average by 35% since the crossing of SMA(Mb)7 above SMA(Mb)30;
- 2.
In 10.7% of cases, mempool provided false signals about a future increase in trading volumes, by an average of 0.4% since the crossing of SMA(Mb)7 above SMA(Mb)30;
- 3.
In 28.6% of cases, mempool acted as a leading indicator of a significant decrease in trading volumes, on average by −16.3% from the moment of crossing, SMA(Mb)7 above SMA(Mb)30;
The processed mempool data were able to indicate significant changes in trading volumes by the mean values and median of the data sample by 16.7% and 11.7%, respectively, with the average values of the growth of the trading volume at 1.9% and 1.16%, respectively (Table 2). The obtained values confirm the empirical conclusion that mempool growth is equal to future cash flow and leads to a new conclusion that the growth of future cash flows in the bitcoin network leads to a significant increase in future trading volumes.
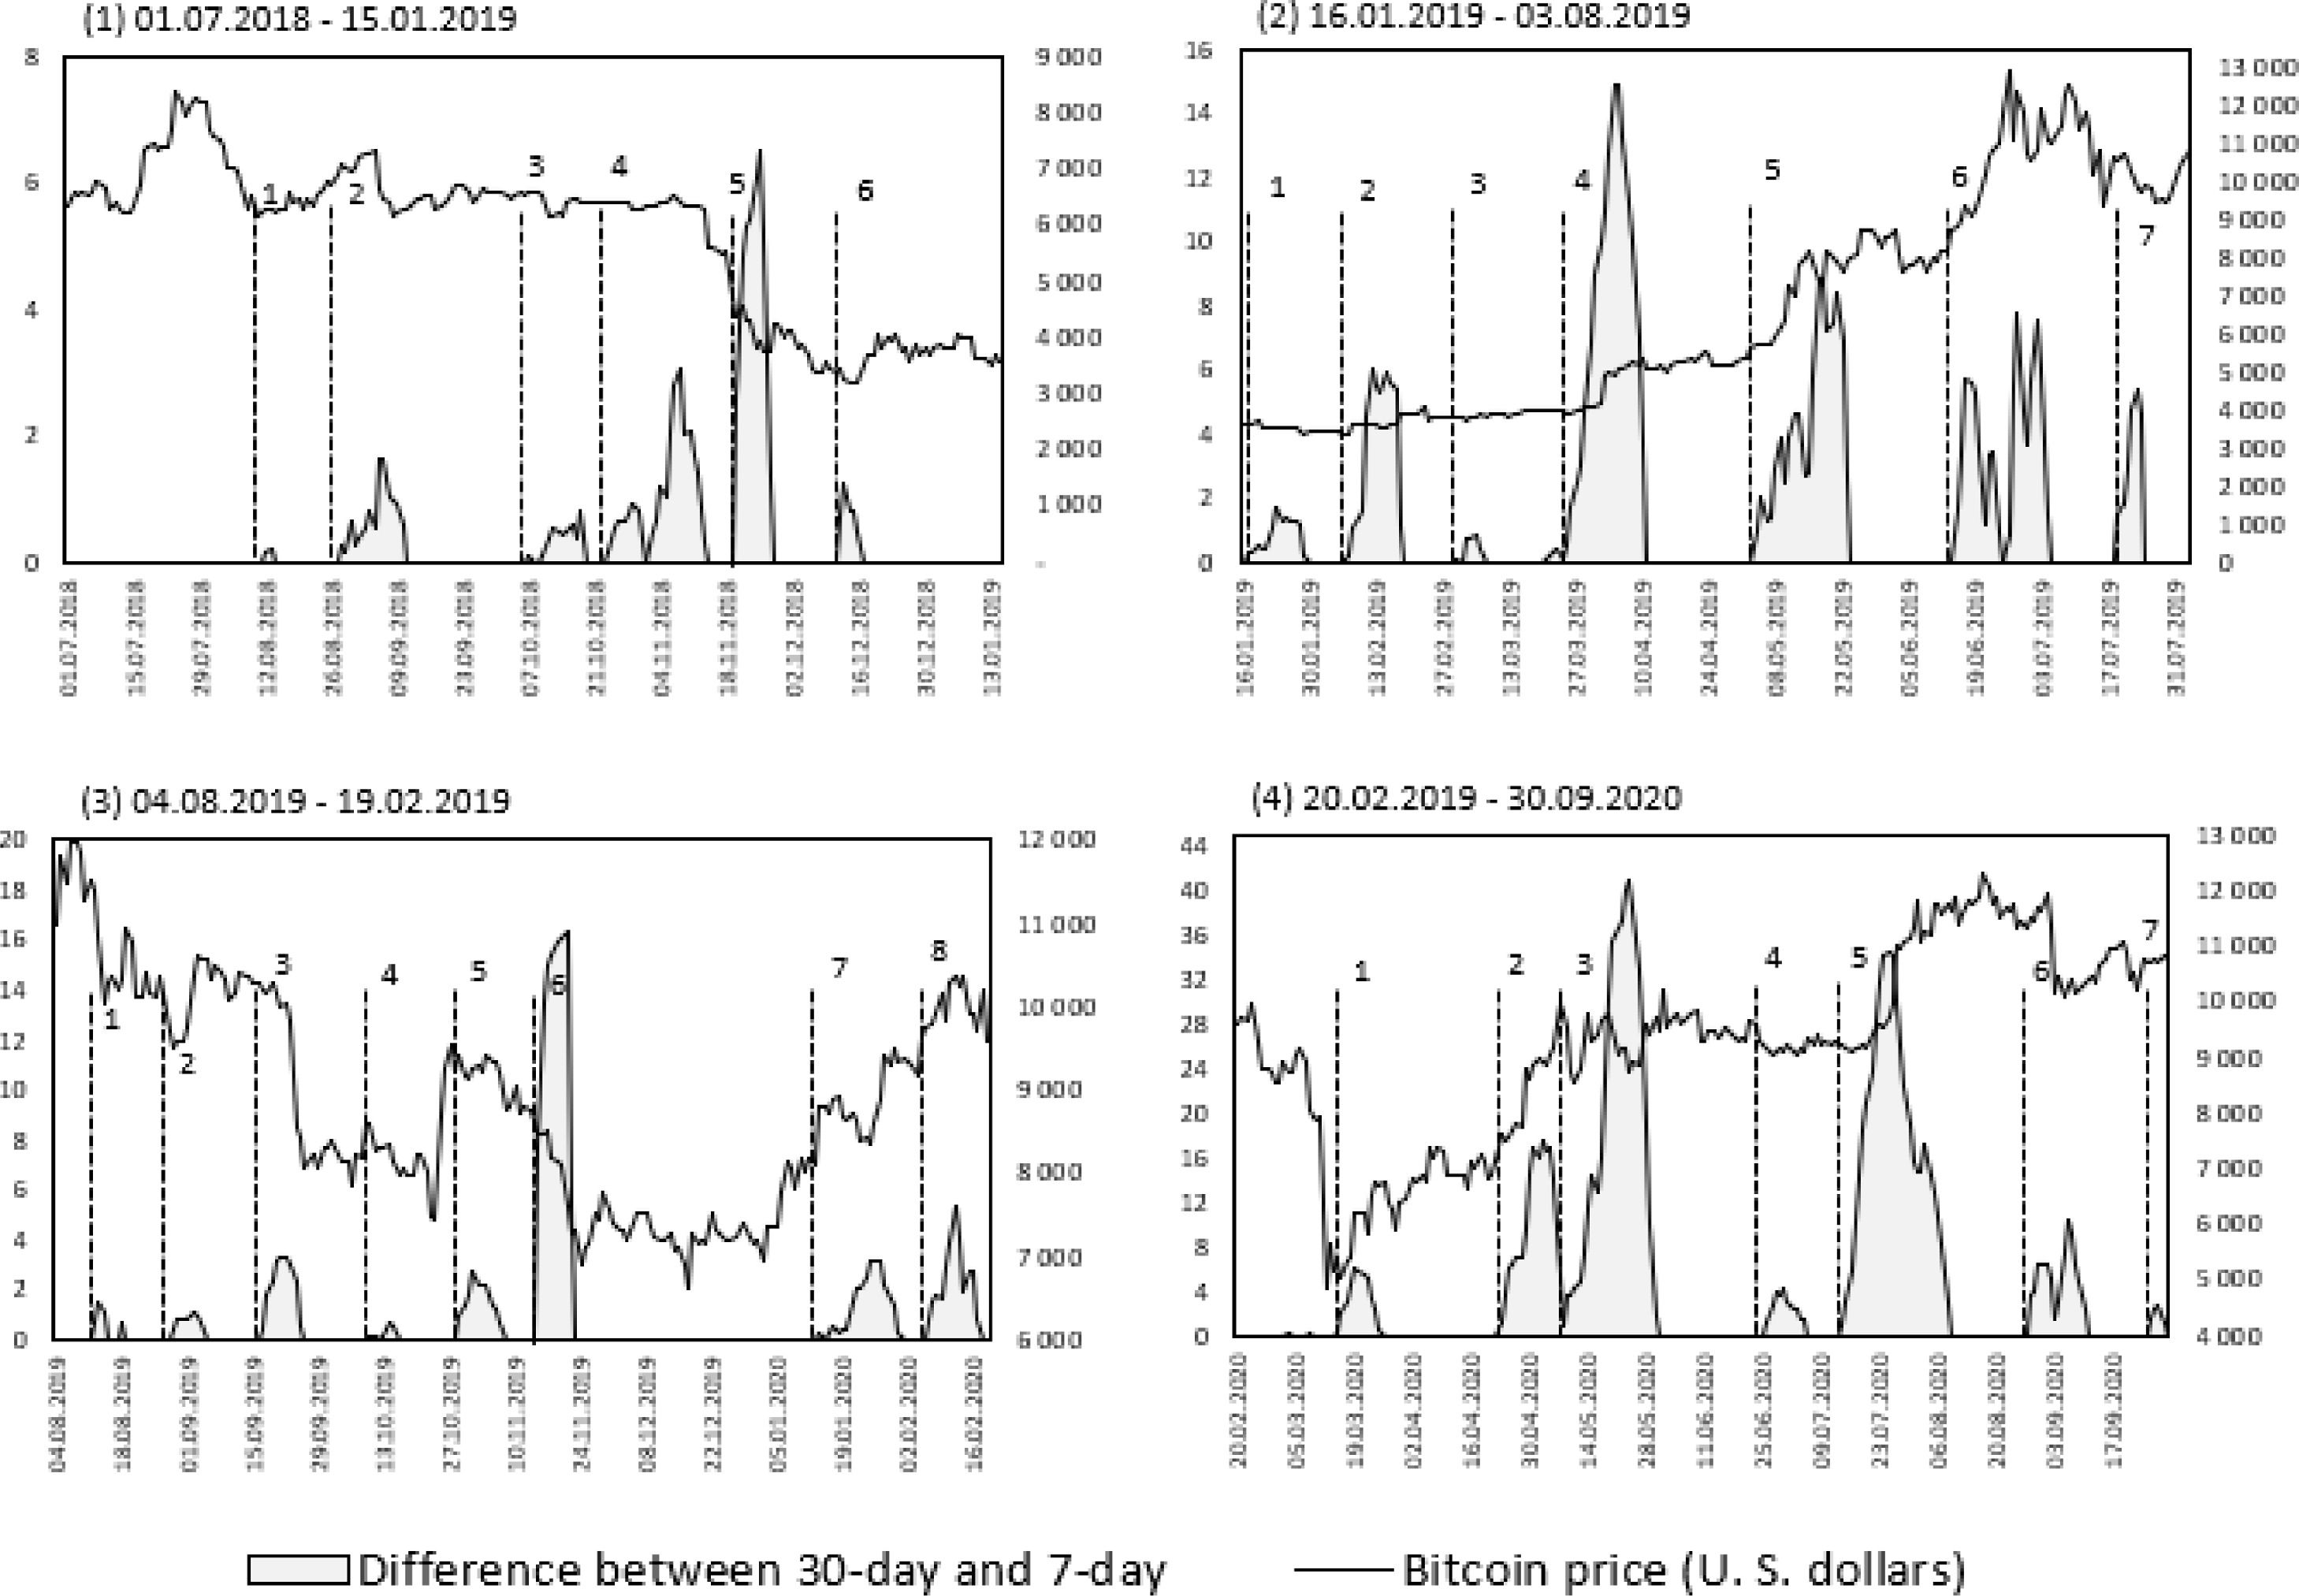
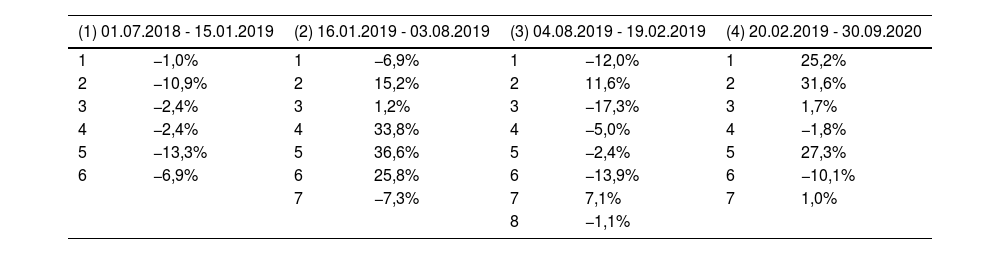
However, it is not enough to confirm the ability of mempool to be a leading indicator of growth in trading volumes of bitcoin; it is important to determine its ability (or lack thereof) to be a leading price indicator. Fig. 10 (1–4) presents data on the relationship of positive difference, SMA(Mb)7 over SMA(Mb)30 in comparison with the market prices of bitcoin in the analyzed interval - July 1, 2018 - September 30, 2020 (823 data periods), divided by four-date coordinates, approximately 200 days each.
 and the bitcoin market price (USD).")
For the selected period, the mempool's bitcoin moving average model showed 28 cases of crossing SMA(Mb)7 over SMA(Mb)30:
- 1.
In 42.9% of cases, mempool acted as a leading indicator of bitcoin price growth, on average by 18.2% since the crossing of SMA(Mb)7 above SMA(Mb)30;
- 2.
In 57.1% of cases, mempool served as a leading indicator of a fall in bitcoin prices, on average by −7.2% from the moment SMA(Mb)7 crossed over SMA(Mb)30.
With the average value of price growth for bitcoin at 0.14% and the median at 0.13%, the processed mempool data could not indicate significant price changes at the intersection of SMA(Mb)7 above SMA(Mb)30, taking into account the obtained values of 3.7% for the average and 1.4% for the median. In most cases (57.1%), mempool growth leads to a drop in the price of bitcoin Tables 3-4.
The dynamics of the market prices of bitcoin during the growth of the positive mempool difference in the network.
| (1) 01.07.2018 - 15.01.2019 | (2) 16.01.2019 - 03.08.2019 | (3) 04.08.2019 - 19.02.2019 | (4) 20.02.2019 - 30.09.2020 | ||||
|---|---|---|---|---|---|---|---|
| 1 | −1,0% | 1 | −6,9% | 1 | −12,0% | 1 | 25,2% |
| 2 | −10,9% | 2 | 15,2% | 2 | 11,6% | 2 | 31,6% |
| 3 | −2,4% | 3 | 1,2% | 3 | −17,3% | 3 | 1,7% |
| 4 | −2,4% | 4 | 33,8% | 4 | −5,0% | 4 | −1,8% |
| 5 | −13,3% | 5 | 36,6% | 5 | −2,4% | 5 | 27,3% |
| 6 | −6,9% | 6 | 25,8% | 6 | −13,9% | 6 | −10,1% |
| 7 | −7,3% | 7 | 7,1% | 7 | 1,0% | ||
| 8 | −1,1% | ||||||
Indicators of the dynamics of the market prices of bitcoin during the growth of the positive mempool difference between the network and the overall values of the change in market prices.
| Selected period: July 1, 2018 - September 30, 2020 | |
| Total average for the period (1), (2), (3), (4): | 3,7% |
| Total median for the period (1), (2), (3), (4): | −1,4% |
| Maximum value of price growth: | 18,4% |
| Dynamics of price growth, average: | 0,14% |
| Dynamics of price growth, median: | 0,13% |
| Maximum value of price reduction: | −39,0% |
The second part of the analysis is aimed at weighting the performance determinants of mempool with q-ROF Multi-SWARA (Table 5).
Selected criteria for the performance determinants of mempool.
| Criteria | References |
|---|---|
| Size (criterion 1) | Dae-Yong et al. (2020) |
| Weight (criterion 2) | Mallikarjuna et al. (2020) |
| Transaction (criterion 3) | Luo et al. (2020) |
| Fee (criterion 4) | Mišić et al. (2020) |
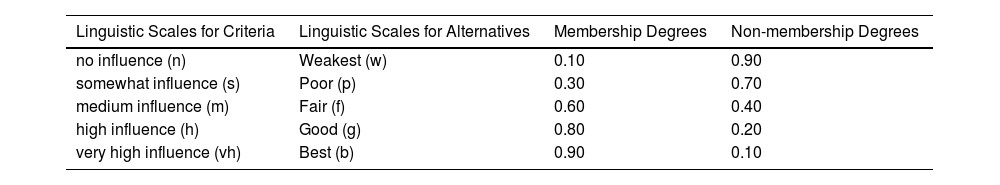
Linguistic evaluations from the experts are obtained by using the scales and grades (Table 6).
Linguistic scales and degrees of membership and non-membership for criteria and alternatives.
| Linguistic Scales for Criteria | Linguistic Scales for Alternatives | Membership Degrees | Non-membership Degrees |
|---|---|---|---|
| no influence (n) | Weakest (w) | 0.10 | 0.90 |
| somewhat influence (s) | Poor (p) | 0.30 | 0.70 |
| medium influence (m) | Fair (f) | 0.60 | 0.40 |
| high influence (h) | Good (g) | 0.80 | 0.20 |
| very high influence (vh) | Best (b) | 0.90 | 0.10 |
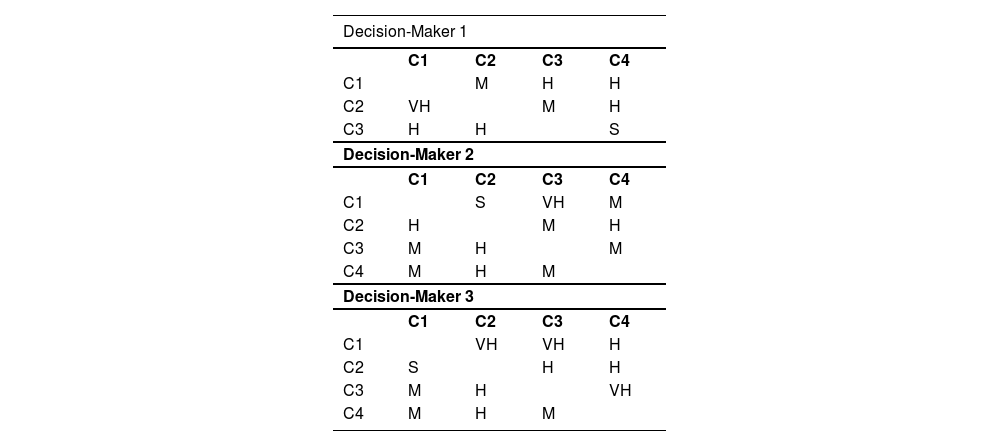
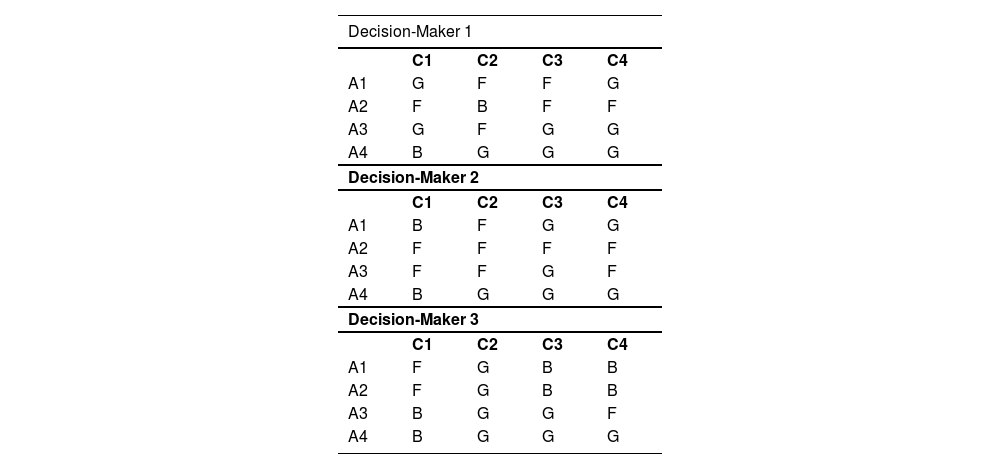
The details of the linguistic analyses are shown below in Table 7.
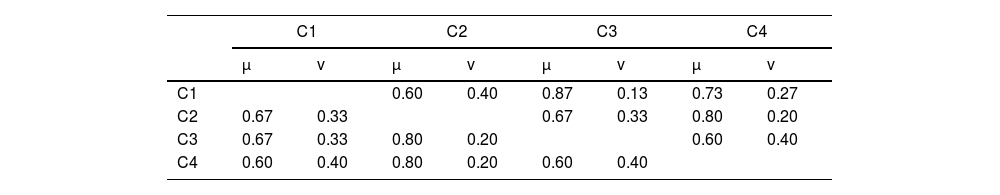
The average values for membership and non-membership degrees are defined (Table 8).
The values of the score function are calculated as shown below (Table 9).
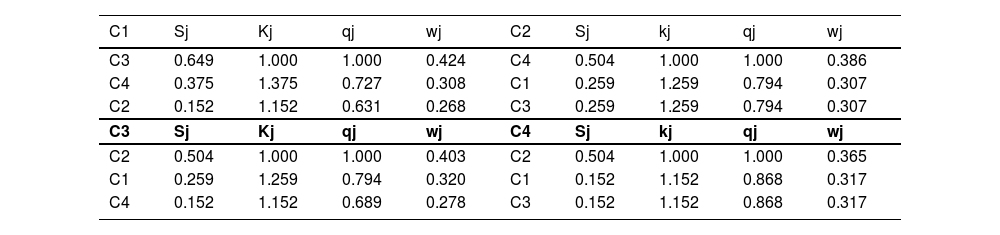
Next, sj, kj, qj, and wj values are computed (Table 10).
Sj, kj, qj, and wj values for the relationship degrees of each criterion.
| C1 | Sj | Kj | qj | wj | C2 | Sj | kj | qj | wj |
|---|---|---|---|---|---|---|---|---|---|
| C3 | 0.649 | 1.000 | 1.000 | 0.424 | C4 | 0.504 | 1.000 | 1.000 | 0.386 |
| C4 | 0.375 | 1.375 | 0.727 | 0.308 | C1 | 0.259 | 1.259 | 0.794 | 0.307 |
| C2 | 0.152 | 1.152 | 0.631 | 0.268 | C3 | 0.259 | 1.259 | 0.794 | 0.307 |
| C3 | Sj | Kj | qj | wj | C4 | Sj | kj | qj | wj |
| C2 | 0.504 | 1.000 | 1.000 | 0.403 | C2 | 0.504 | 1.000 | 1.000 | 0.365 |
| C1 | 0.259 | 1.259 | 0.794 | 0.320 | C1 | 0.152 | 1.152 | 0.868 | 0.317 |
| C4 | 0.152 | 1.152 | 0.689 | 0.278 | C3 | 0.152 | 1.152 | 0.868 | 0.317 |
The relation matrix is constructed (Tables 11-12).
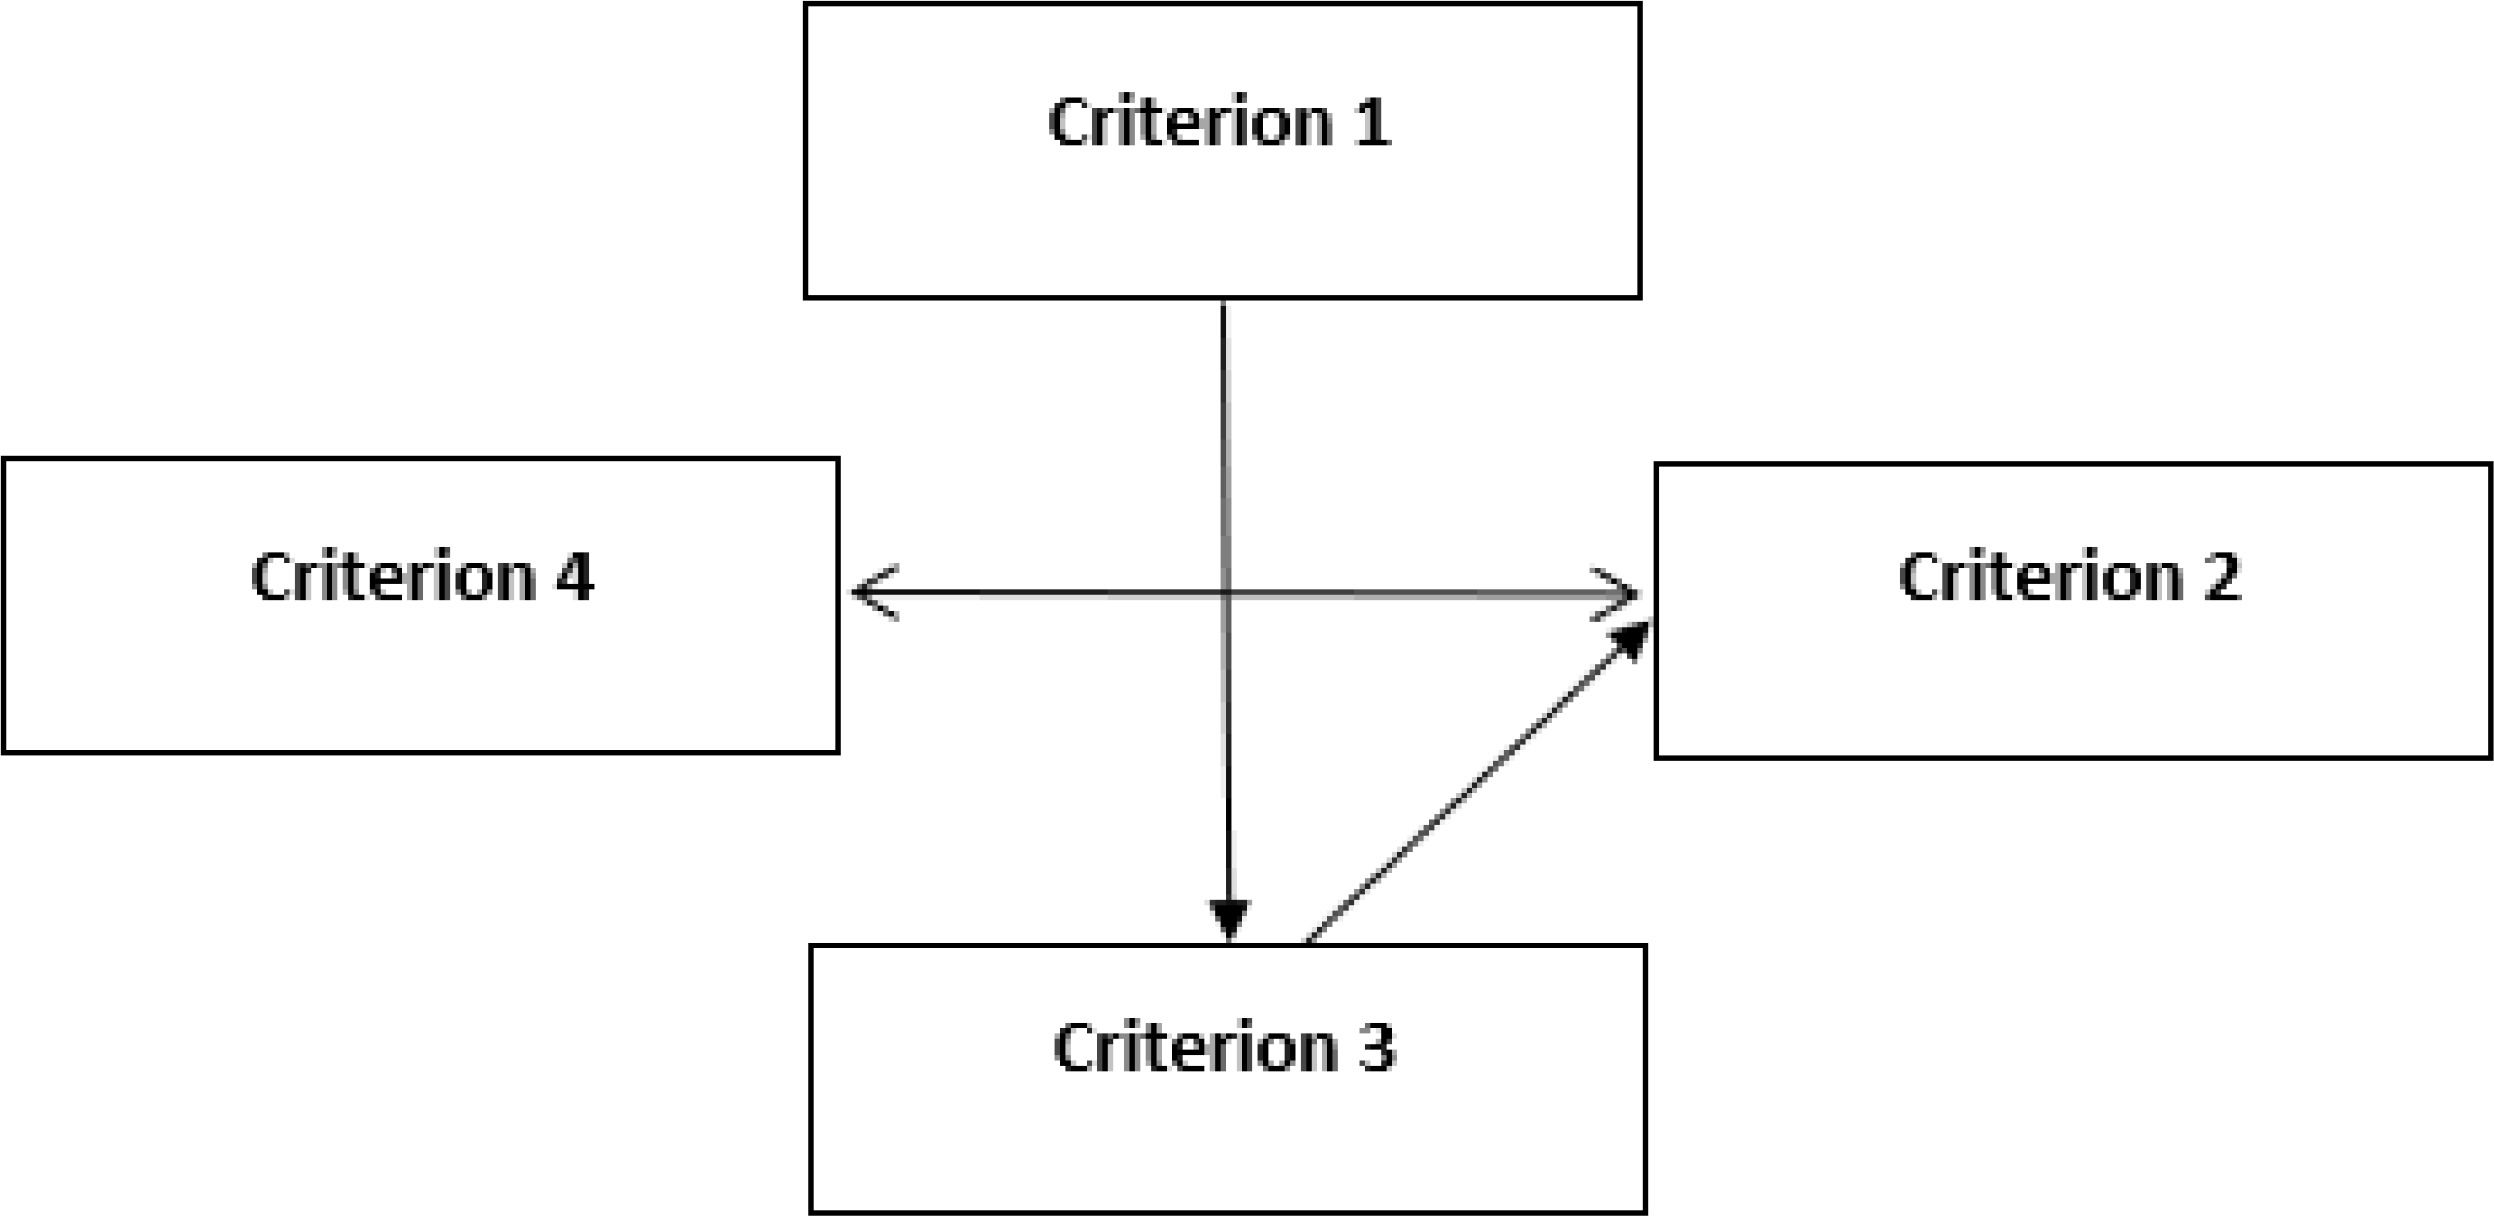
The impact-relation results are detailed (Fig. 11).

Fig. 11 illustrates that size (criterion 1) exerts an impact on the transaction (criterion 3). Similarly, weight (criterion 2) is affected by both the transaction (criterion 3) and the fee (criterion 4). Conversely, weight (criterion 2) has an influence on the fee (criterion 4). In addition to q-ROF sets, weights are also computed with IFS and PFS.
Demonstrated here is that all fuzzy sets produce identical results (Table 13). This scenario provides good insights into the findings' reliability. It is identified that a transaction (criterion 3) is the most important determinant of the bitcoin mempool. In the next stage, the mempool priorities are ranked by the period alternatives. Different mempool periods are selected as alternatives, and these periods are as follows: 01.07.2018–15.01.2019 (alternative 1), 16.01.2019–03.08.2019 (alternative 2), 04.08.2019–19.02.2020 (alternative 3), and 20.02.2020–30.09.2020 (alternative 4). It includes the linguistic evaluations for the alternatives (Table 14).
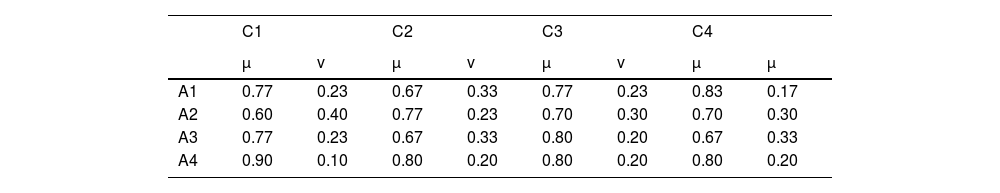
For each alternative, the average values of membership and non-membership degrees are determined (Table 15).
The weighted average values of q-rung orthopair fuzzy sets (Table 16).
Score function values are compared for ranking the alternatives (Table 17).
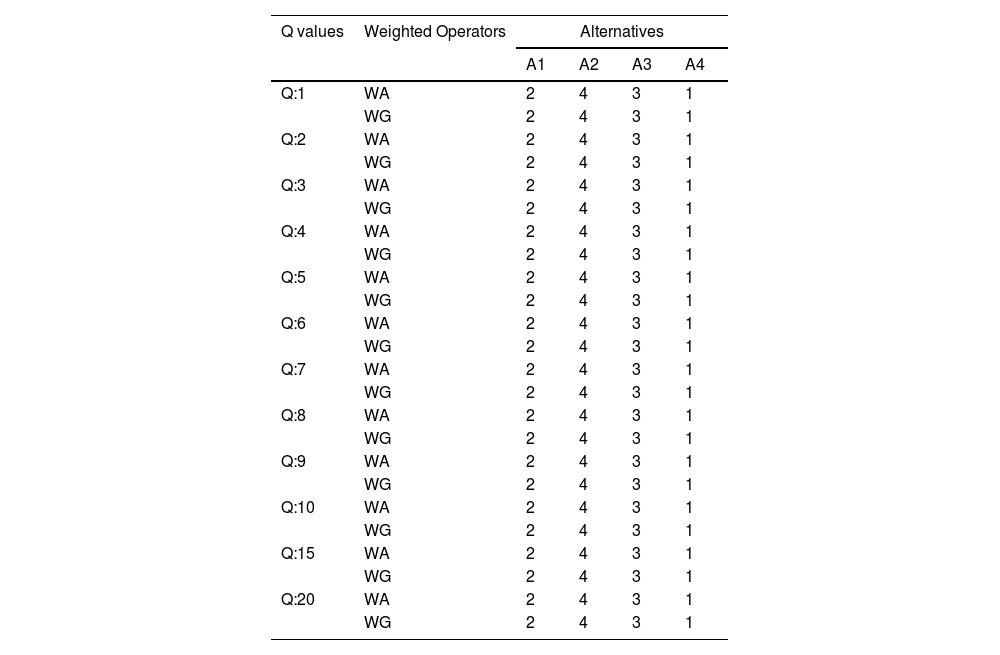
Finally, the sensitivity analysis is applied to the ranking alternatives for different q values.
The mempool period of 20.02.2020–30.09.2020 (alternative 4) has the greatest importance. On the other hand, the period of 1.07.2018–15.01.2019 (alternative 1) enjoys second ranking (Table 18).
Sensitivity analysis of ranking alternatives for different q values.
| Q values | Weighted Operators | Alternatives | |||
|---|---|---|---|---|---|
| A1 | A2 | A3 | A4 | ||
| Q:1 | WA | 2 | 4 | 3 | 1 |
| WG | 2 | 4 | 3 | 1 | |
| Q:2 | WA | 2 | 4 | 3 | 1 |
| WG | 2 | 4 | 3 | 1 | |
| Q:3 | WA | 2 | 4 | 3 | 1 |
| WG | 2 | 4 | 3 | 1 | |
| Q:4 | WA | 2 | 4 | 3 | 1 |
| WG | 2 | 4 | 3 | 1 | |
| Q:5 | WA | 2 | 4 | 3 | 1 |
| WG | 2 | 4 | 3 | 1 | |
| Q:6 | WA | 2 | 4 | 3 | 1 |
| WG | 2 | 4 | 3 | 1 | |
| Q:7 | WA | 2 | 4 | 3 | 1 |
| WG | 2 | 4 | 3 | 1 | |
| Q:8 | WA | 2 | 4 | 3 | 1 |
| WG | 2 | 4 | 3 | 1 | |
| Q:9 | WA | 2 | 4 | 3 | 1 |
| WG | 2 | 4 | 3 | 1 | |
| Q:10 | WA | 2 | 4 | 3 | 1 |
| WG | 2 | 4 | 3 | 1 | |
| Q:15 | WA | 2 | 4 | 3 | 1 |
| WG | 2 | 4 | 3 | 1 | |
| Q:20 | WA | 2 | 4 | 3 | 1 |
| WG | 2 | 4 | 3 | 1 | |
Spontaneously created, mempool has become one of the most effective indicators for displaying up-to-date information about the state of future cash flows on the bitcoin network. In this study, it was discovered that the adjusted mempool data (+16.7%) for 7-day and 30-day moving averages was able, with a time lag of 24–48 h, to indicate significant volatility of future bitcoin trading volumes (+1.6%) on average. The obtained values confirm the author's empirical conclusion: mempool growth equals future cash flow growth and leads to a new conclusion: an increase in future cash flows leads to a significant increase in future trading volumes (Yigitcanlar et al., 2020; Hermawati et al., 2020; Tayal et al., 2021).
However, when assessing the ability of mempool to act as a leading indicator of future growth in bitcoin prices, the author came to the conclusion that the growth of a transaction in mempool, on the contrary, leads to a decline in prices in 57.1% of cases (An et al., 2020; An & Mikhaylov, 2020). The findings indicate that a transaction is the most important determinant of the bitcoin mempool. It is understood that the mempool's size is quite large when transactions pending confirmation are well accumulated. This situation strongly suggests that there is a high demand for bitcoin transfers in the network. Consequently, it is recognized that strategies to increase bitcoin mining should be refined. With the new mines to be determined, it will be possible for the bitcoin system to make progress in the future. In this way, transactions in the bitcoin system will not have to wait long. With the system operating more effectively, it will be much easier to attract the attention of new customers.
The logical assumption of the obtained result is the desire of network participants to transfer digital assets from their cold wallets to trading platforms for their further sale, which creates a springboard for the growth of trading volumes. The results obtained lead to the final conclusion that mempool growth leads to future cash flow (future trading volume growth). The theoretical implications are included in statistical analysis and q-ROF Multi-SWARA. The methodology and results are for the benefit of the central banks, policymakers and other relevant authorities. The practical implications regarding the role of mempool as a leading indicator to signal impending changes most accurately in trading volumes and bitcoin prices are for institutional investors like crypto funds, exchange traded funds and financial advisors to act on.
ConclusionsInvestors are looking for objects to invest their funds successfully, evaluating the effectiveness of alternative markets and their instruments. However, such mechanisms may not be appropriate in the current cryptocurrency market, as the underlying technology and market environment of cryptocurrencies are distinct from those of traditional financial assets. The valuation metrics used in the stock market are categorically not applicable to the cryptocurrency market. This gave rise to great interest among analysts and representatives of the scientific community in a new and unexplored crypto phenomenon. It led to attempts to create an effective leading indicator that can predict the future direction of price movement and changes in trading volumes for the selected cryptocurrency.
Historically, cash flow indicators most effectively reflect the mood of the masses with reference to a financial asset or the market as a whole, both in the short- and long-term. The queue of already completed but not yet confirmed transactions, which are future cash flows in mempool bitcoin, is one of those indicators that can most accurately and correctly display the state of the bitcoin network. That part of the network, i.e. the changes, is entirely dependent on the current users.
This research is aimed at evaluating bitcoin mempool priorities. Two different analyses have been conducted for this purpose. Firstly, the mempool periods are examined using statistical analysis. Secondly, the performance determinants of mempool are evaluated with q-ROF Multi-SWARA. As well as the q-ROF sets, weights are computed with IFS and PFS. It is demonstrated that the results of all fuzzy sets are identical. This outcome provides important insights into the findings' reliability. The findings in turn indicate that a transaction is the most important determinant of the bitcoin mempool.
This study's most significant contribution is to undertake a comparative evaluation with the help of statistical analysis and fuzzy decision-making methodology. This method makes it possible to verify the analysis results so that appropriate strategies can be generated in this respect. The paper fills the gap in our knowledge regarding the role of mempool as a leading indicator to most accurately signal impending changes in trading volumes and bitcoin prices. It can provide significant support to any type of investor in the cryptocurrency market. Nevertheless, the main limitation of this study is using only bitcoin data mempool analysis as a leading indicator to signal most accurately impending. With this in mind, future studies should consider different types of cryptocurrencies. One area for future research to explore is using new data and methods for statistical analysis.