


China is facing tremendous pressure to reduce carbon emissions. This paper investigates the impact of financial technology (fintech) on carbon emissions reduction across Chinese provincial regions using annual data from 2011 to 2021. To comprehensively reflect the development level of fintech, we utilize web crawler technology and word frequency analysis to create new variables for measuring the technology level and innovation capability, with fintech-related keywords sourced from the Baidu index. Subsequently, we construct a fintech index for each province in China. Given the heterogeneous relationship between fintech and carbon emissions reduction, we employ an innovative sparse support vector quantile regression to explore the impact of fintech on carbon emissions reduction at different quantile levels. This method employs an Lp-norm regularization term to identify the key variables influencing carbon emission reduction. The empirical results indicate that fintech significantly reduces carbon emissions in all Chinese provincial regions. Furthermore, the positive effects of fintech on carbon emissions reduction are much stronger in high-carbon provinces than in low-carbon provinces. Consequently, it is imperative for policy-makers and practitioners to focus on increasing investment in digital infrastructure and enhancing digital services, particularly in Shanxi, Hebei, Henan, Shaanxi, Ningxia, and Xinjiang provinces. The mechanism analysis reveals that fintech contributes to carbon emission reduction by promoting industrial structure upgrading in more economically developed provinces, while its mediating role is absent in less developed provinces.
China has made a commitment to ensuring to peak its carbon emissions by approximately 2030, with the further objective of achieving carbon neutrality by 2060. As the largest carbon-emitting nation, China is facing tremendous pressure to reduce carbon emissions. Technological innovation is a double-edged sword that has both positive and negative effects on carbon emission reduction (Liang et al., 2023; Wang et al., 2022; Wang & Wei, 2020). A positive view is that technological innovation offers practical solutions for reducing carbon emissions (Lin & Ma, 2022; Dong et al., 2022; Ahmed & Le, 2021; Su et al., 2020). A negative view is that technological innovation reduces the costs of goods, services and economic activities. This, in turn, increases energy consumption and degrades the environment (Umar et al., 2020a).
Financial development represents a crucial factor in determining carbon emissions (Zaidi et al., 2019). The impact of financial development on carbon emissions has attracted the attention of a broad range of academics. Many studies highlight the argument that financial development contributes to increasing carbon emissions for several reasons (Zhang, 2011; Boutabba, 2014; Jiang& Ma, 2019; Wang et al., 2020; Huang, Sadiq, & Chien, 2023). First, financial development expands financing channels and helps enterprises lower financing costs, resulting in the expansion of production scale and energy consumption. Second, financial development could provide better financial services, which promote the expansion of social consumption and energy usage. Conversely, some studies have come to the opposing view that financial development could mitigate carbon emissions by updating production technology and improving energy infrastructure (Tamazian et al., 2009; Shahbaz et al., 2013; Dogan & Seker, 2016; Zaidi et al., 2019). Additionally, some studies maintain that financial development has no effect on carbon emissions (Dogan & Turkekul, 2016; Umar et al., 2020b). In recent years, the booming progress of advanced technology based on digital trading systems and mobile payment systems (Philippon, 2016; Chen, 2016) has led to continuous application in the Chinese financial industry. Considering finance's green, digital and inclusive characteristics, most scholars have focused on the impact of green finance (Chen & Chen, 2021; Bai et al., 2022; Gan & Voda, 2023), digital finance (Xue et al., 2022; Pu & Fei, 2022; Qin et al., 2022), and financial inclusion (Le et al., 2020; Wang et al., 2022; Shahbaz et al., 2022) on carbon emissions but have failed to reach a consensus.
As a core field of the fourth industrial revolution (Jiao et al., 2021), financial technology (fintech) has played a vital role within the financial industry. Fintech is defined as a cross-disciplinary subject that combines finance, technology management and innovation management (Leong & Sung, 2018) and has dramatically impacted different sectors of the economy through the use of cutting-edge technological innovations, such as artificial intelligence, blockchain, cloud computing, and big data (Cheng & Qu, 2020). Fintech has brought new momentum to finance and has received extensive attention from academia. A new debate has arisen regarding the interrelationship between fintech and carbon emissions (Tao et al., 2022). On the one hand, fintech plays a positive role in carbon emissions (Muhammad et al., 2022; Teng & Shen, 2023a; Cheng et al., 2023). Fintech can improve intelligent management in cities (Teng & Shen, 2023a) to help directly reduce energy demand through renewable energy initiatives, purchasing low-carbon products, financing electric cars, and supporting green transport (Muhammad et al., 2022). Moreover, fintech can indirectly influence carbon emissions through advanced industrial structure (Cheng et al., 2023), energy structure upgrading (Teng & Shen, 2023a), government fiscal science expenditure (Teng & Shen, 2023b), and green finance (Xu et al., 2023). On the other hand, fintech can increase the demand for energy by increasing the demand for hardware and software upgrades and replacements to create a copious amount of e-waste (Tao et al., 2022). Therefore, the influence of fintech on carbon emission arouses is controversial.
Although China is at the forefront of the global expansion of fintech (Kong & Loubere, 2021), the construction of a comprehensive fintech index that fully reflects the level of fintech development remains a hot topic. Several studies have directly used the financial inclusion index (Guo et al., 2020) to measure the development of fintech in China (Muganyi et al., 2021; Cheng et al., 2023; Xu et al., 2023), which is unreasonable since the financial inclusion index mainly reflects the financial inclusiveness. In response to this limitation, Ye et al. (2022) constructed a fintech index that included dimensions such as the usage depth of digital finance, the level of digitization, and the level of technology. However, the fintech index proposed by Ye et al. (2022) falls short in addressing the level of innovation ability. Additionally, the level of fintech development among Chinese provincial regions is heterogeneous (Ye et al., 2023). The relationships between fintech and carbon emissions in Chinese provincial regions are also heterogeneous. Little academic literature has been devoted to the heterogeneous impact of fintech on carbon emissions across provincial regions in China.
Hence, the above discussion leads to the following research questions. First, how can a fintech index be constructed to completely depict the level of fintech development in China? Second, does fintech have a heterogeneous impact on carbon emissions among Chinese provinces? Third, what is the mechanism through which fintech affects carbon emissions?
To address these research questions, this paper first constructs a fintech index encompassing various dimensions, including digital infrastructure, the usage depth of digital finance, the level of digitization, the level of technology, and innovation capability. Extending the fintech index of Ye et al. (2022), we utilize web crawler technology and word frequency analysis to create new variables to reflect the innovation capacity. Second, we employ a generalized elastic net Lp-norm support vector quantile regression (GLpSVQR) (Ye et al., 2022) to examine the heterogeneous effects of fintech on carbon emissions at different quantile levels. GLpSVQR uses a quantile parameter to obtain a family of regression curves and thus captures the heterogeneous relationship between fintech and carbon emissions. Furthermore, the Lp-norm regularization term (where 0 < p < 1) within GLpSVQR facilitates the selection of the main influencing variables due to its intrinsic sparsity. Lp-norm regularization term in GLpSVQR induces the shrinkage of some regression coefficients towards 0, and some coefficients are shrunk to exactly 0, leading to some redundant variables being discarded and some main influencing variables being selected (Ye et al., 2017). To address the third research question, we examine how fintech influences carbon emissions through the channel of industrial structure upgrading. Therefore, the main contributions of this paper include the following aspects:
- 1)
Utilizing web crawler technology and word frequency analysis, we systematically identifed fintech-related keywords from the Baidu index. Subsequently, we create new variables to evaluate the technology level and innovation capacity. Additionally, we employ the analytic hierarchy process and entropy weight method to construct a fintech index for each province in China.
- 2)
To address the heterogeneous impact of financial technology on carbon emissions among China's provincial regions, we introduce a novel sparse quantile regression approach. Rather than analyzing heterogeneity by dividing the Chinese regions into several geographical sections as in Teng and Shen (2023b), which damages the intrinsic structure of the data, this approach maintains the inherent distributed structure and utilizes quantile estimators as empirical "location" measures to completely explore the heterogeneous relationships between fintech and carbon emissions.
- 3)
To capture the main factors that influence carbon emissions reduction, GLpSVQR utilizes Lp-norm regularization for variable selection. Notably, GLpSVQR effectively selects nine key variables that influence carbon emissions reduction: fintech, degree of openess, capital, FDI, government, urbanization rate, urban living standard, rural living standard, and employment structure.
- 4)
The regression results at different quantile levels illustrate the heterogeneous reduction effects of fintech on carbon emissions reduction among Chinese provinces. Furthermore, we trace heterogeneous impact pathways of fintech on carbon emissions and categorize China's provinces into four clusters: a low-effect region, a moderate-effect region, an up- moderate-effect region, and a high-effect region.
- 5)
We investigate whether industrial structure upgrading plays an intermediary role in the influencing mechanism through which fintech affects carbon emissions across Chinese provinces, thereby providing important policy implications for reducing carbon emissions.
The rest of the paper is organized as follows. In Section 2, a review of the research on fintech and the carbon emissions is presented. Section 3 introduces the methodology adopted in this study. Section 4 describes the data sources and variables. Section 5 examines the heterogeneous impact and mechanism of fintech on carbon emissions. Section 6 concludes this paper and provides corresponding suggestions for future research.
Literature reviewMeasurement of fintechDefining and measuring the level of fintech development presents challenges due to the lack of a universally accepted fintech index and the ongoing debate over its definition (Teng & Shen, 2023a; Cheng & Qu, 2020). Some scholars constructed a fintech index focusing on the technology dimension (Li & Xu, 2021; Wang et al., 2021). The fintech index developed by Lee et al. (2021) covers only the financial services dimension. Findexable constructed the global fintech index focusing only on the political and economic environment dimension (Pauliukevičienė & Stankevičienė, 2021). Several studies have directly used the financial inclusion index (Guo et al., 2020) to measure the development of fintech in China (Muganyi et al., 2021; Cheng et al., 2023; Xu et al., 2023), which is excessive since the financial inclusion index mainly focuses on financial inclusiveness. Furthermore, Ye et al. (2022a) developed a fintech index based on digital finance depth, digitization level, and technology level, excluding the innovation dimension.
Considering the absence of a standardized fintech index in China, this paper follows Leong and Sung (2018) definition of fintech as an interdisciplinary subject that integrates finance, technology management, and innovation management. We introduce new variables for technology level and innovation capacity using web crawler technology and word frequency analysis. Employing the analytic hierarchy process, we construct a comprehensive fintech index that includes digital infrastructure, the usage depth of digital finance, the level of digitization, innovation capability, and the level of technology.
The direct impact of fintech on carbon emissionsIn theory, fintech may affect carbon emissions directly or through a mediating impact mechanism (Muhammad et al., 2022; Cheng et al., 2023). The direct impact of fintech on environmental quality can manifest in contradictory ways. A negative view is that fintech lowers the threshold of financial services and escalates the demand for electric products such as phones, laptops, and tablets, which accelerates electricity and energy consumption and results in deteriorating environmental quality (Muhammad et al., 2022). Furthermore, the energy-intensive nature of the cryptocurrency industry, facilitated by fintech, poses additional risks to environmental sustainability (De Vries, 2018). A positive view is that fintech facilitates digital transformation, which is conductive to transferring offline economic activities to the online market, thus mitigating carbon emissions. Additionally, the convenience of mobile payment systems like Alipay and WeChat Pay is noted for streamlining transactions and potentially reducing the carbon footprint associated with traditional payment methods (Cheng et al., 2023).
Although there is no unanimous theory about the direct effect of fintech on carbon emissions, most of the related academic literature considers fintech an effective tool for reducing carbon emissions. Muhammad et al. (2022) investigated the nexus between fintech and environmental efficiency across 23 EU countries, and discovered that fintech enhances environmental efficiency through the adaption of green technologies and energy-saving initiatives. Tao et al. (2022) employed the latest fintech index and data on carbon emissions for approximately 65 countries. The results showed that the fintech development of a country is helpful in the transition towards a low-carbon economy owing to its negative impact on carbon emissions. Teng and Shen (2023a) used data from the OECD national panel to examine the effects of fintech on energy efficiency. The results indicated that fintech directly contributes to the improvement of energy efficiency in OECD countries.
In China, the research on fintech's impact on carbon emissions is still emerging. Xu et al. (2023) investigated fintech's effect on carbon emission intensity in China, demonstrating that fintech development notably reduces carbon emission intensity. However, Xu et al. (2023) directly used the financial inclusion index released by the Institute of Digital Finance Peking University (Guo et al., 2020) to measure the development of fintech in China, which is unreasonable since the financial inclusion index mainly reflects financial inclusiveness. Additionally, there is a gap in the literature regarding the varied effects of fintech on carbon emissions across Chinese provinces. This study aims to fill this gap by employing a novel sparse support vector quantile regression to explore the heterogeneous impacts of fintech on carbon emissions throughout various regions in China.
The mechanism through which fintech affects carbon emissionsBeyond its direct influence, fintech may also have an indirect effect on carbon emissions. Existing research identifies several pathways through which fintech in China impacts carbon emissions, including changes in industrial structure, energy structure, green technology innovation, financial constraints, green finance, and governing fiscal science expenditures. Teng and Shen (2023a) argued that fintech can improve energy efficiency through upgrading the energy structure and promoting environmental management innovations. Cheng et al. (2023) discovered that the main mechanisms through which fintech affects carbon emissions involve industrial structure, financing constraints, and green technology innovation. Moreover, Xu et al. (2023) found that the development of fintech enhances the efficiency of green finance, leading to a reduction in carbon emission intensity. Teng and Shen (2023b) suggested the finding that fintech can improve carbon efficiency by increasing financial science expenditure.
The mechanisms through which fintech influences carbon emissions are complexity. This study focuses on the upgrading of industrial structures as the intermediary variable. Fintech has the potential to alleviate information asymmetry, enhance the efficiency of capital allocation across industries, and thus upgrade the industrial structure. Such upgrading could lead to the elimination of outdated and highly pollutive industries, improve energy efficiency, reduce the distortion costs of factor mismatch, and, ultimately, contribute to a decrease in carbon emissions (Cheng et al., 2023).
MethodologyTo address the potential for unobserved heterogeneous relationship between independent variables and dependent variable, Ye et al. (2022) proposed a generalized elastic net Lp-norm support vector quantile regression (GLpSVQR). Suppose that Y=(y1,…,yN)′ is a dependent variable, X is a known N×Kdesign matrix of covariates, xi=(xi1,…,xiK)′ are K-dimensional independent variables.
Consider the following linear regression model:
where ε is the random error. Unknown parameters β0 and β=(β1,…,βK)′ are estimated by GLpSVQR as follows:where ∥·∥p represents the Lp-norm, ∥·∥2 represents the L2-norm, C(C>0) is a tradeoff parameter that balances the regularization term and the quantile loss, τ(0<τ<1) is the quantile level, ξ and ξ* are slack variables, and e is a vector of ones with appropriate dimensions. A convergent successive linear algorithm (SLA) can be adopted to solve GLpSVQR.

GLpSVQR employs the quantile parameter τ to capture the heterogeneous information within the sample distribution. With an increment in the quantile parameter, the estimated regression curve ascends through the samples, revealing diverse trends within the distribution. Moreover, GLpSVQR is equipped with a natural capability for variable selection, attributed to the sparsity induced by the Lp-norm regularization term. This term effectively shrinks certain coefficients towards zero, with some coefficients being shrunk exact zero (Ye et al., 2017, 2022). As a result, GLpSVQR discards redundant variables and retains the representative ones.
For evaluating the regression results of GLpSVQR, let n be the number of samples, y^i be the predicted value of yi, and y¯=∑i=1nyi/n be the average value of y1,…,yn. We use the natural analog of R2(Rτ1) and Riskτ to evaluate the performance of GLpSVQR.
Rτ1 is defined as follows:
where Q(τ) is the respond variable at τ quantile level. Rτ1 measures the relative success of the relative success of the corresponding quantile regression models at a specific quantile.
Riskτ is defined as follows:
where ρτ(r) is the pinball loss function as follows:

Obviously, the larger Rτ1 or smaller Riskτ is, the more statistical information is captured from dataset.
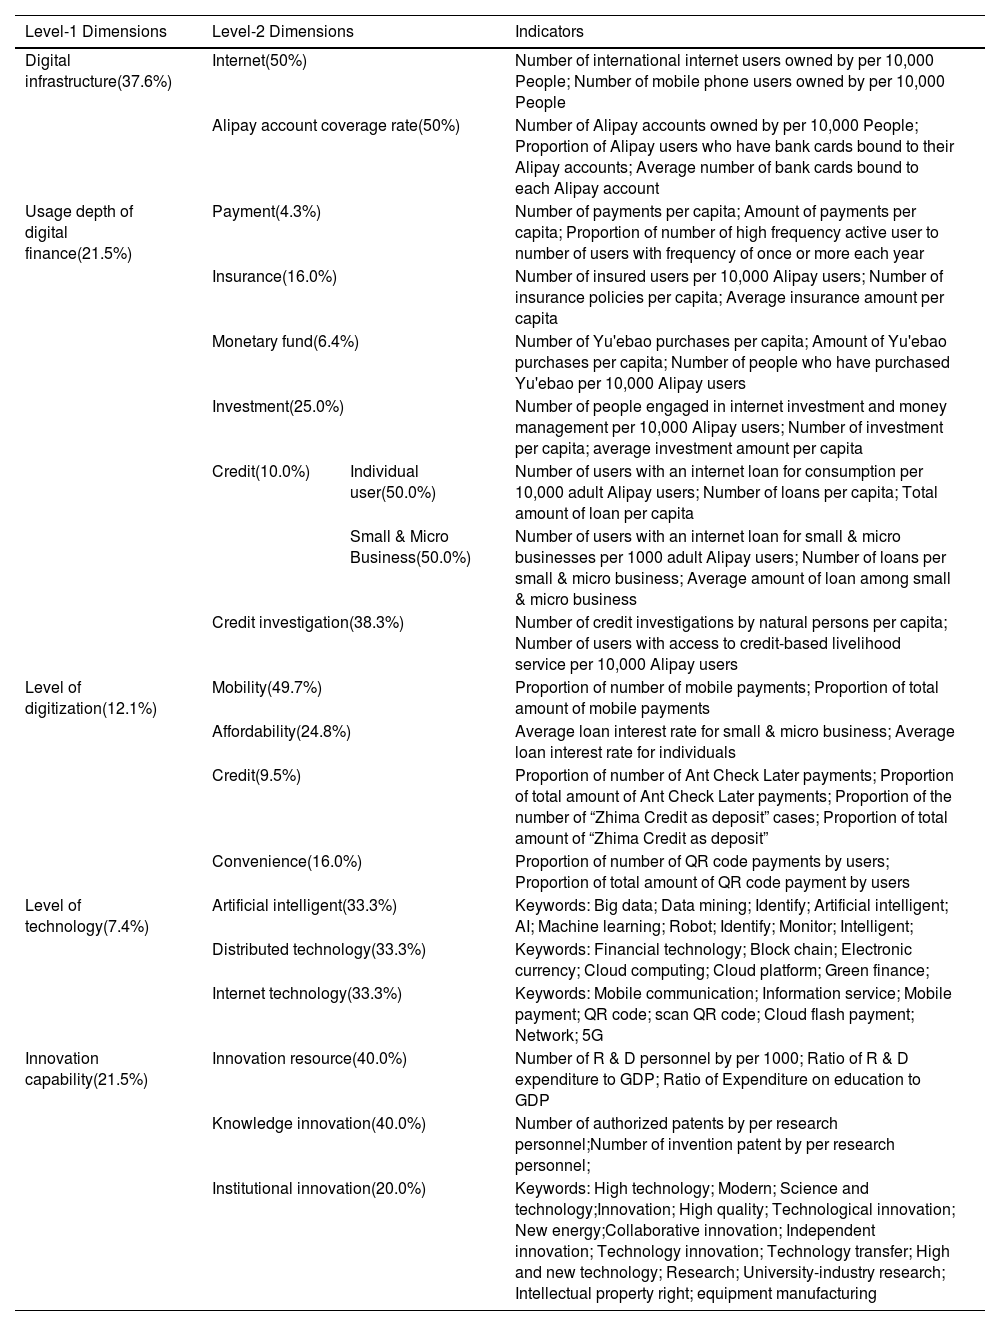
Data sources and variablesFinancial technology indexIn this section, we construct a fintech index across various dimensions, including digital infrastructure, the usage depth of digital finance, the level of digitization, the level of technology, and innovation capability. The “digital infrastructure” refers to the internet and Alipay account coverage rate. The usage depth of digital finance involves payments, insurance, monetary funds, investments, credit, and credit investigation. The level of digitization encompasses mobile usage level, affordability, credit level, and facilitation. The finance technological level covers artificial intelligence, distributed technology, and internet technology. Innovation capability includes innovation resources, knowledge innovation, and institutional innovation. The specifications of the variables reflecting fintech activities, are listed in Table 1. The data on the Alipay account coverage rate, the usage depth of digital finance and the digitization level of financial services are sourced from Guo et al. (2020). To collect data on the finance technology level and the institutional innovation, we utilize web crawler technology and word frequency analysis to extract fintech-related keywords from the Baidu index (http://index.baidu.com/). The Baidu index was proposed by the largest search engine in China. Based on the fintech-related keywords in Ye et al. (2022), we added innovation-capability-related keywords to Table 1.
Fintech dimensions.
Furthermore, we apply the entropy weight method to derive indicators for artificial intelligence, distributed technology, internet technology, and institutional innovation. The indicators representing innovation resources and knowledge innovation in Table 1 are collected from China's National Bureau of Statistics. Following the methodology of Guo et al. (2020), we use the analytic hierarchy process to construct a fintech index for each Chinese province, assigning weights to each dimension as indicated in Table 1. The weights are as follows: digital infrastructure (37.6%), usage depth of digital finance (21.5%), level of digitalization (12.1%), level of technology (7.4%), and innovation capability (21.5%).
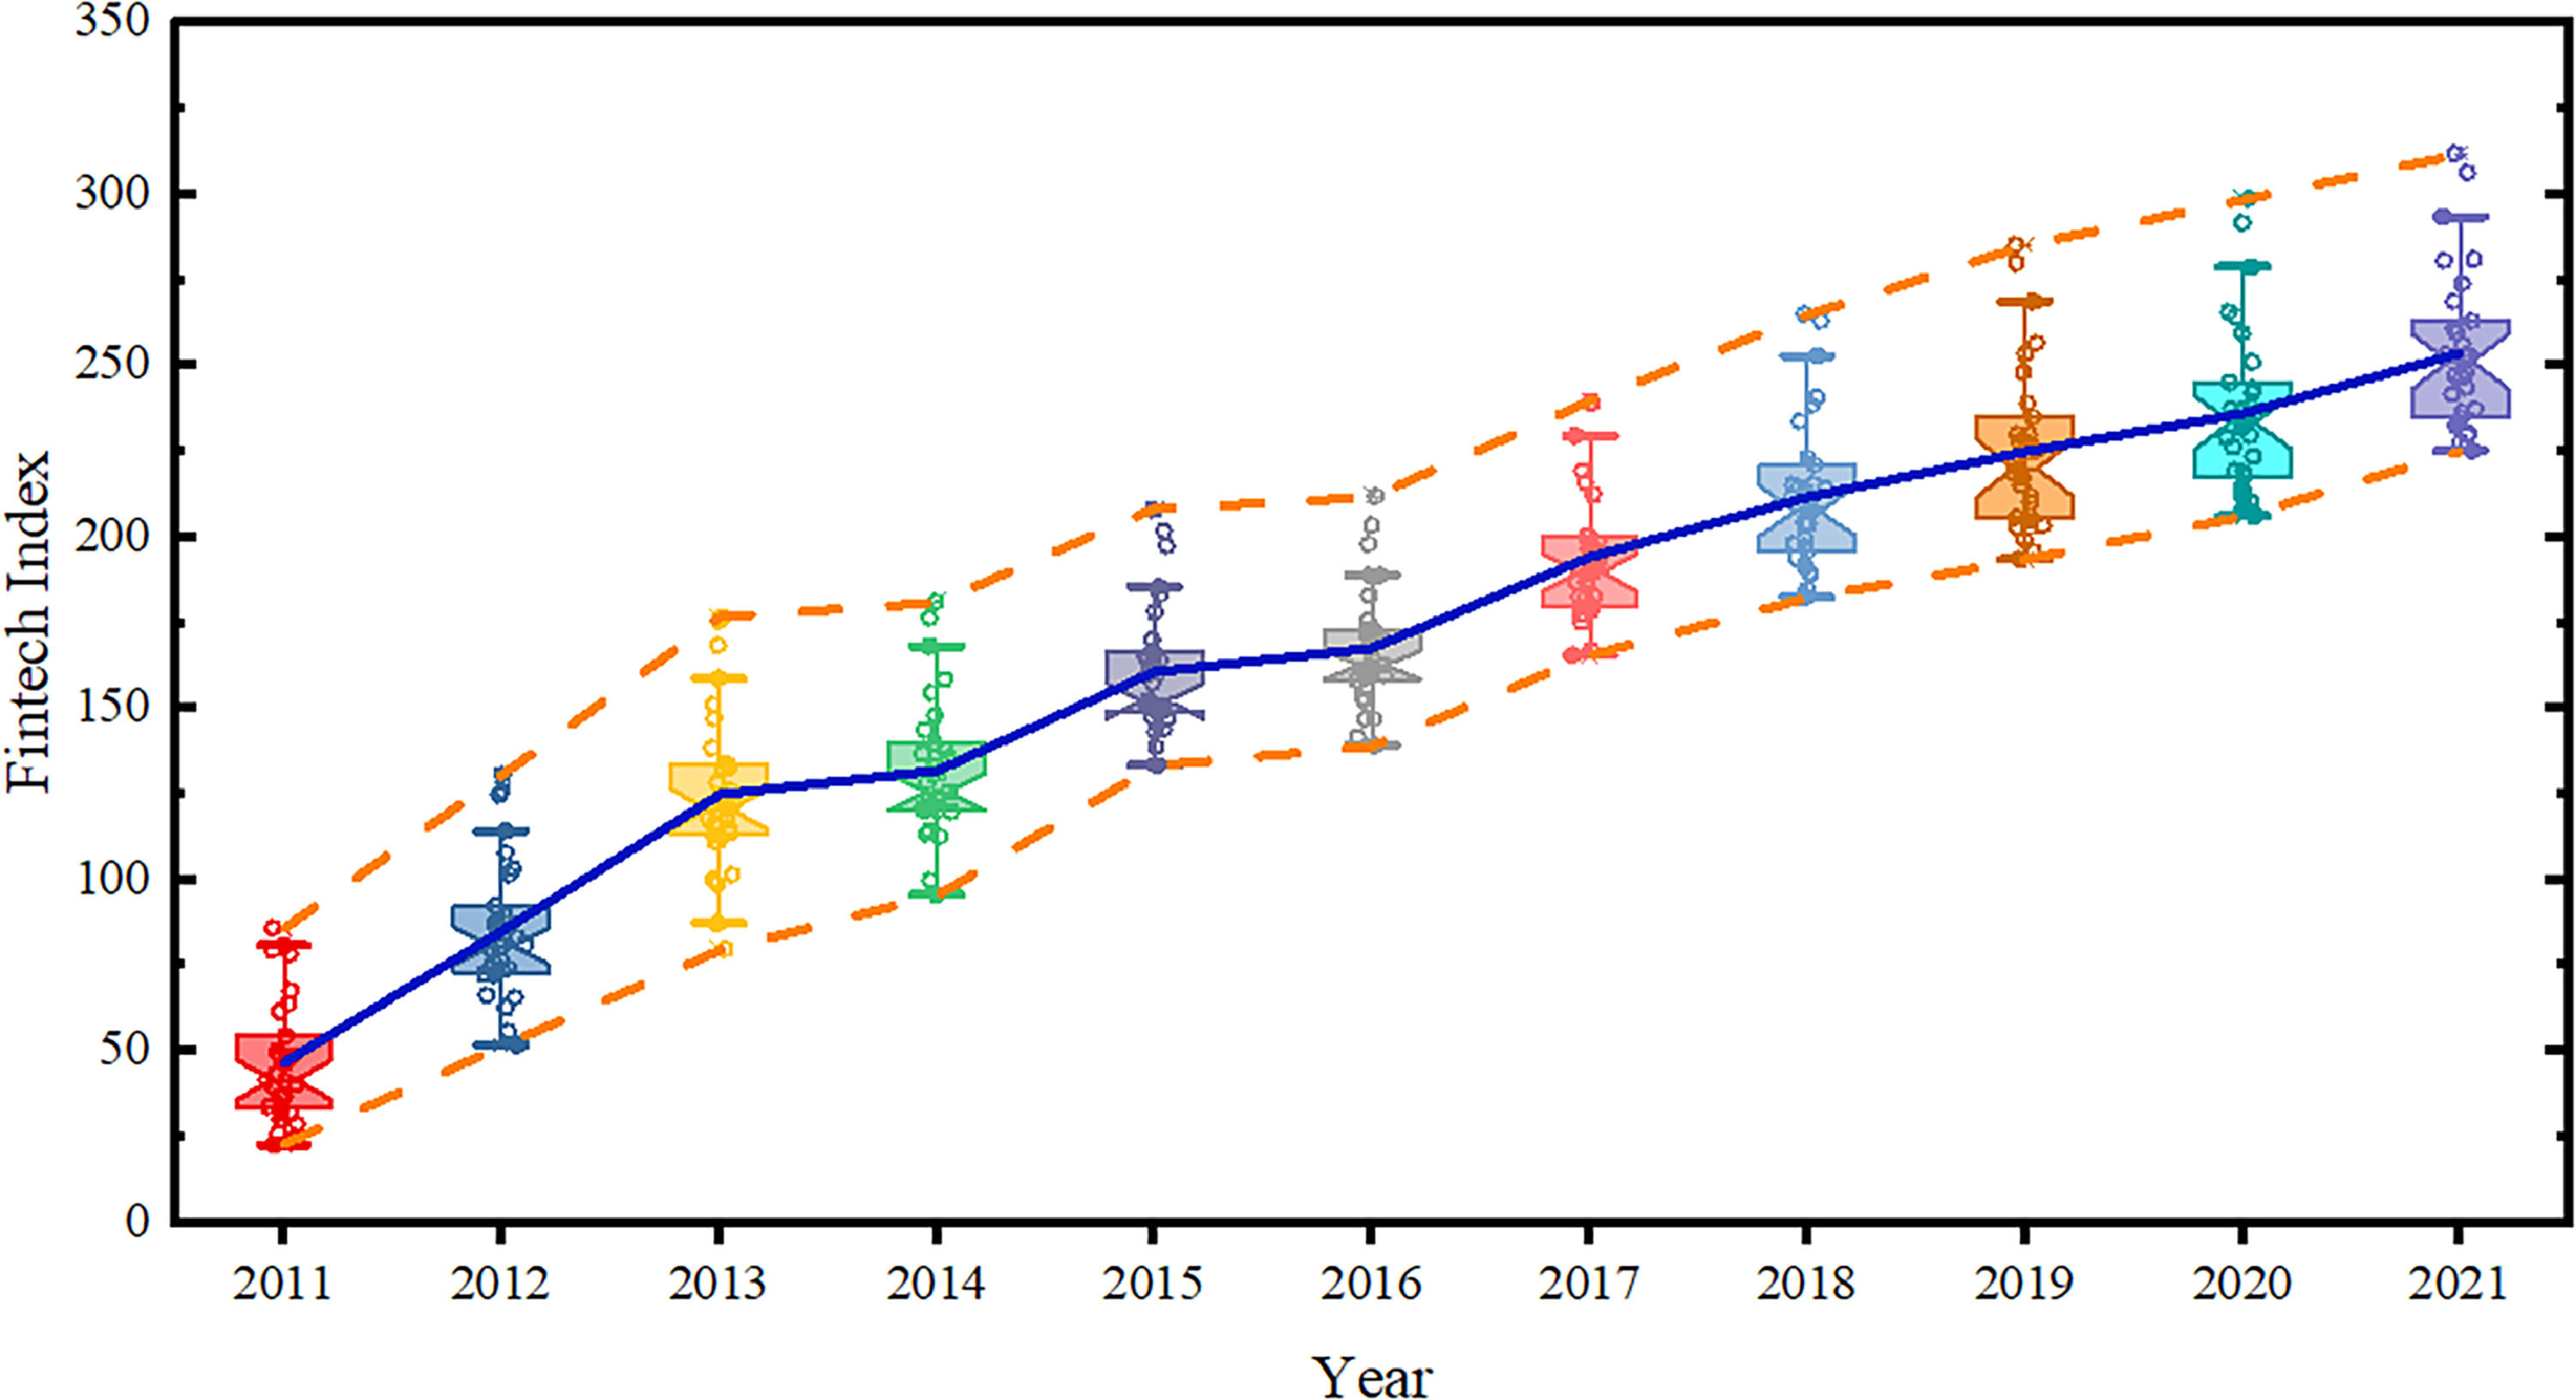
The boxplots depicted in Fig. 1 provide an overview of the fintech index across Chinese provinces for the years 2011 to 2021. Each boxplot displays five key statistics of the fintech index: the extreme values, the lower and upper quartiles, and the median. In Fig. 1, the average fintech index level is delineated by a solid blue line, while the maximum and minimum values are highlighted with orange dotted lines. An analysis of Fig. 1 reveals a consistent upward trend across all indicators, highlighting the dynamic growth of fintech. The large gap between the two orange dotted lines indicates the varied levels of fintech development across the provinces, indicating a notable degree of imbalance and heterogeneity. Notably, when the average level of fintech exceeds the median, Chinese provincial regions with high-level fintech make very positive contributions to fintech development.

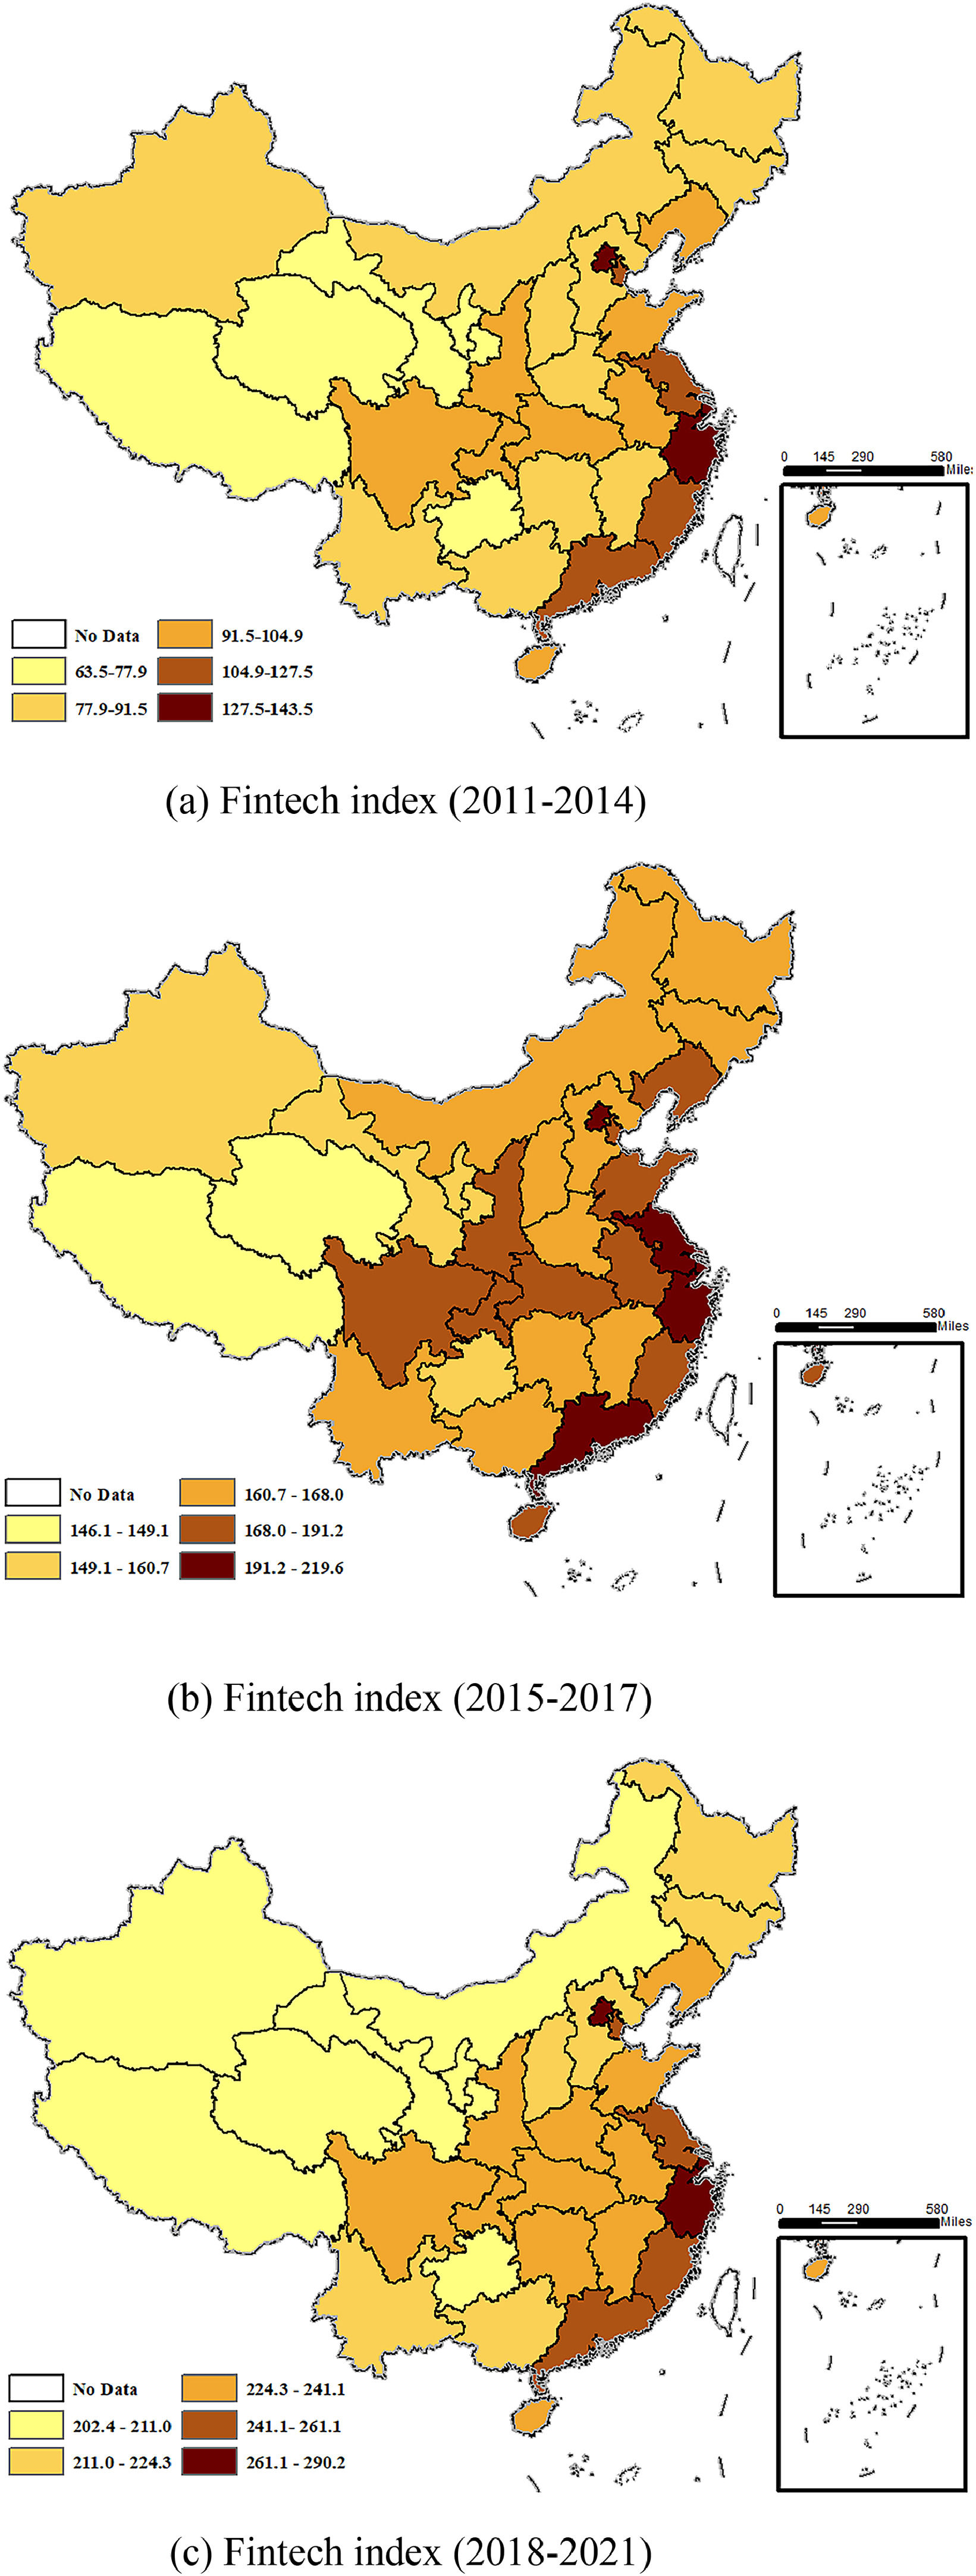
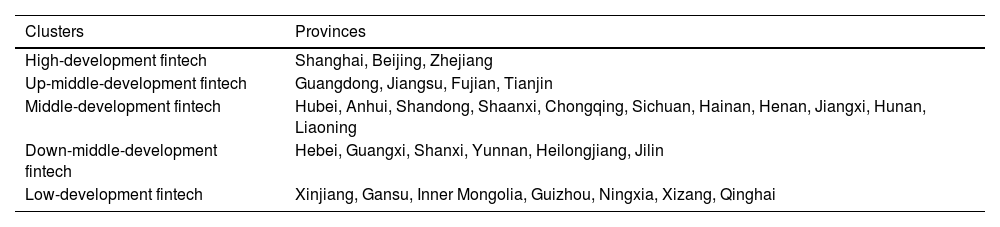
Employing ArcGIS 10.2 software, we map the average fintech levels in each Chinese province (excluding Hong Kong, Macao, and Taiwan) for the intervals 2011–2014, 2015–2017, and 2018–2021, as illustrated in Fig. 2. This visualization reveals pronounced spatial disparities in fintech development among the provinces. Fig. 2 indicates the imbalanced and heterogeneous development of fintech across Chinese provinces. The fintech clustering results of some provinces changed over time. Specifically, Fig. 2(c) shows the fintech landscape for 2018–2021, with detailed clustering outcomes presented in Table 2. The analysis identifies Xinjiang, Gansu, Inner Mongolia, Guizhou, Ningxia, and Qinghai as regions with lower levels of fintech development. According to Fig. 2(c) and Table 2, it is evident that fintech development in eastern China is relatively greater than that in central and western China.

Regional division of average fintech in China for the period from 2018 to 2021.
In this paper, carbon emissions in each province are measured by carbon emission intensity, which is defined as the ratio of total carbon emissions to GDP. Eight industrial end-use energy sources—raw coal, coke, crude oil, gasoline, kerosene, diesel, fuel oil, and natural gas—are utilized to estimate the total carbon emissions of Chinese industries via the following equations (IPCC, 2014):
where Ei is the consumption of the ith carbon source, CVi is the low calorific value, CCi is the carbon content, COi is the carbon oxidation rate, and 4412 is the molecular weight ratio of carbon dioxide to carbon (Wang et al., 2020).
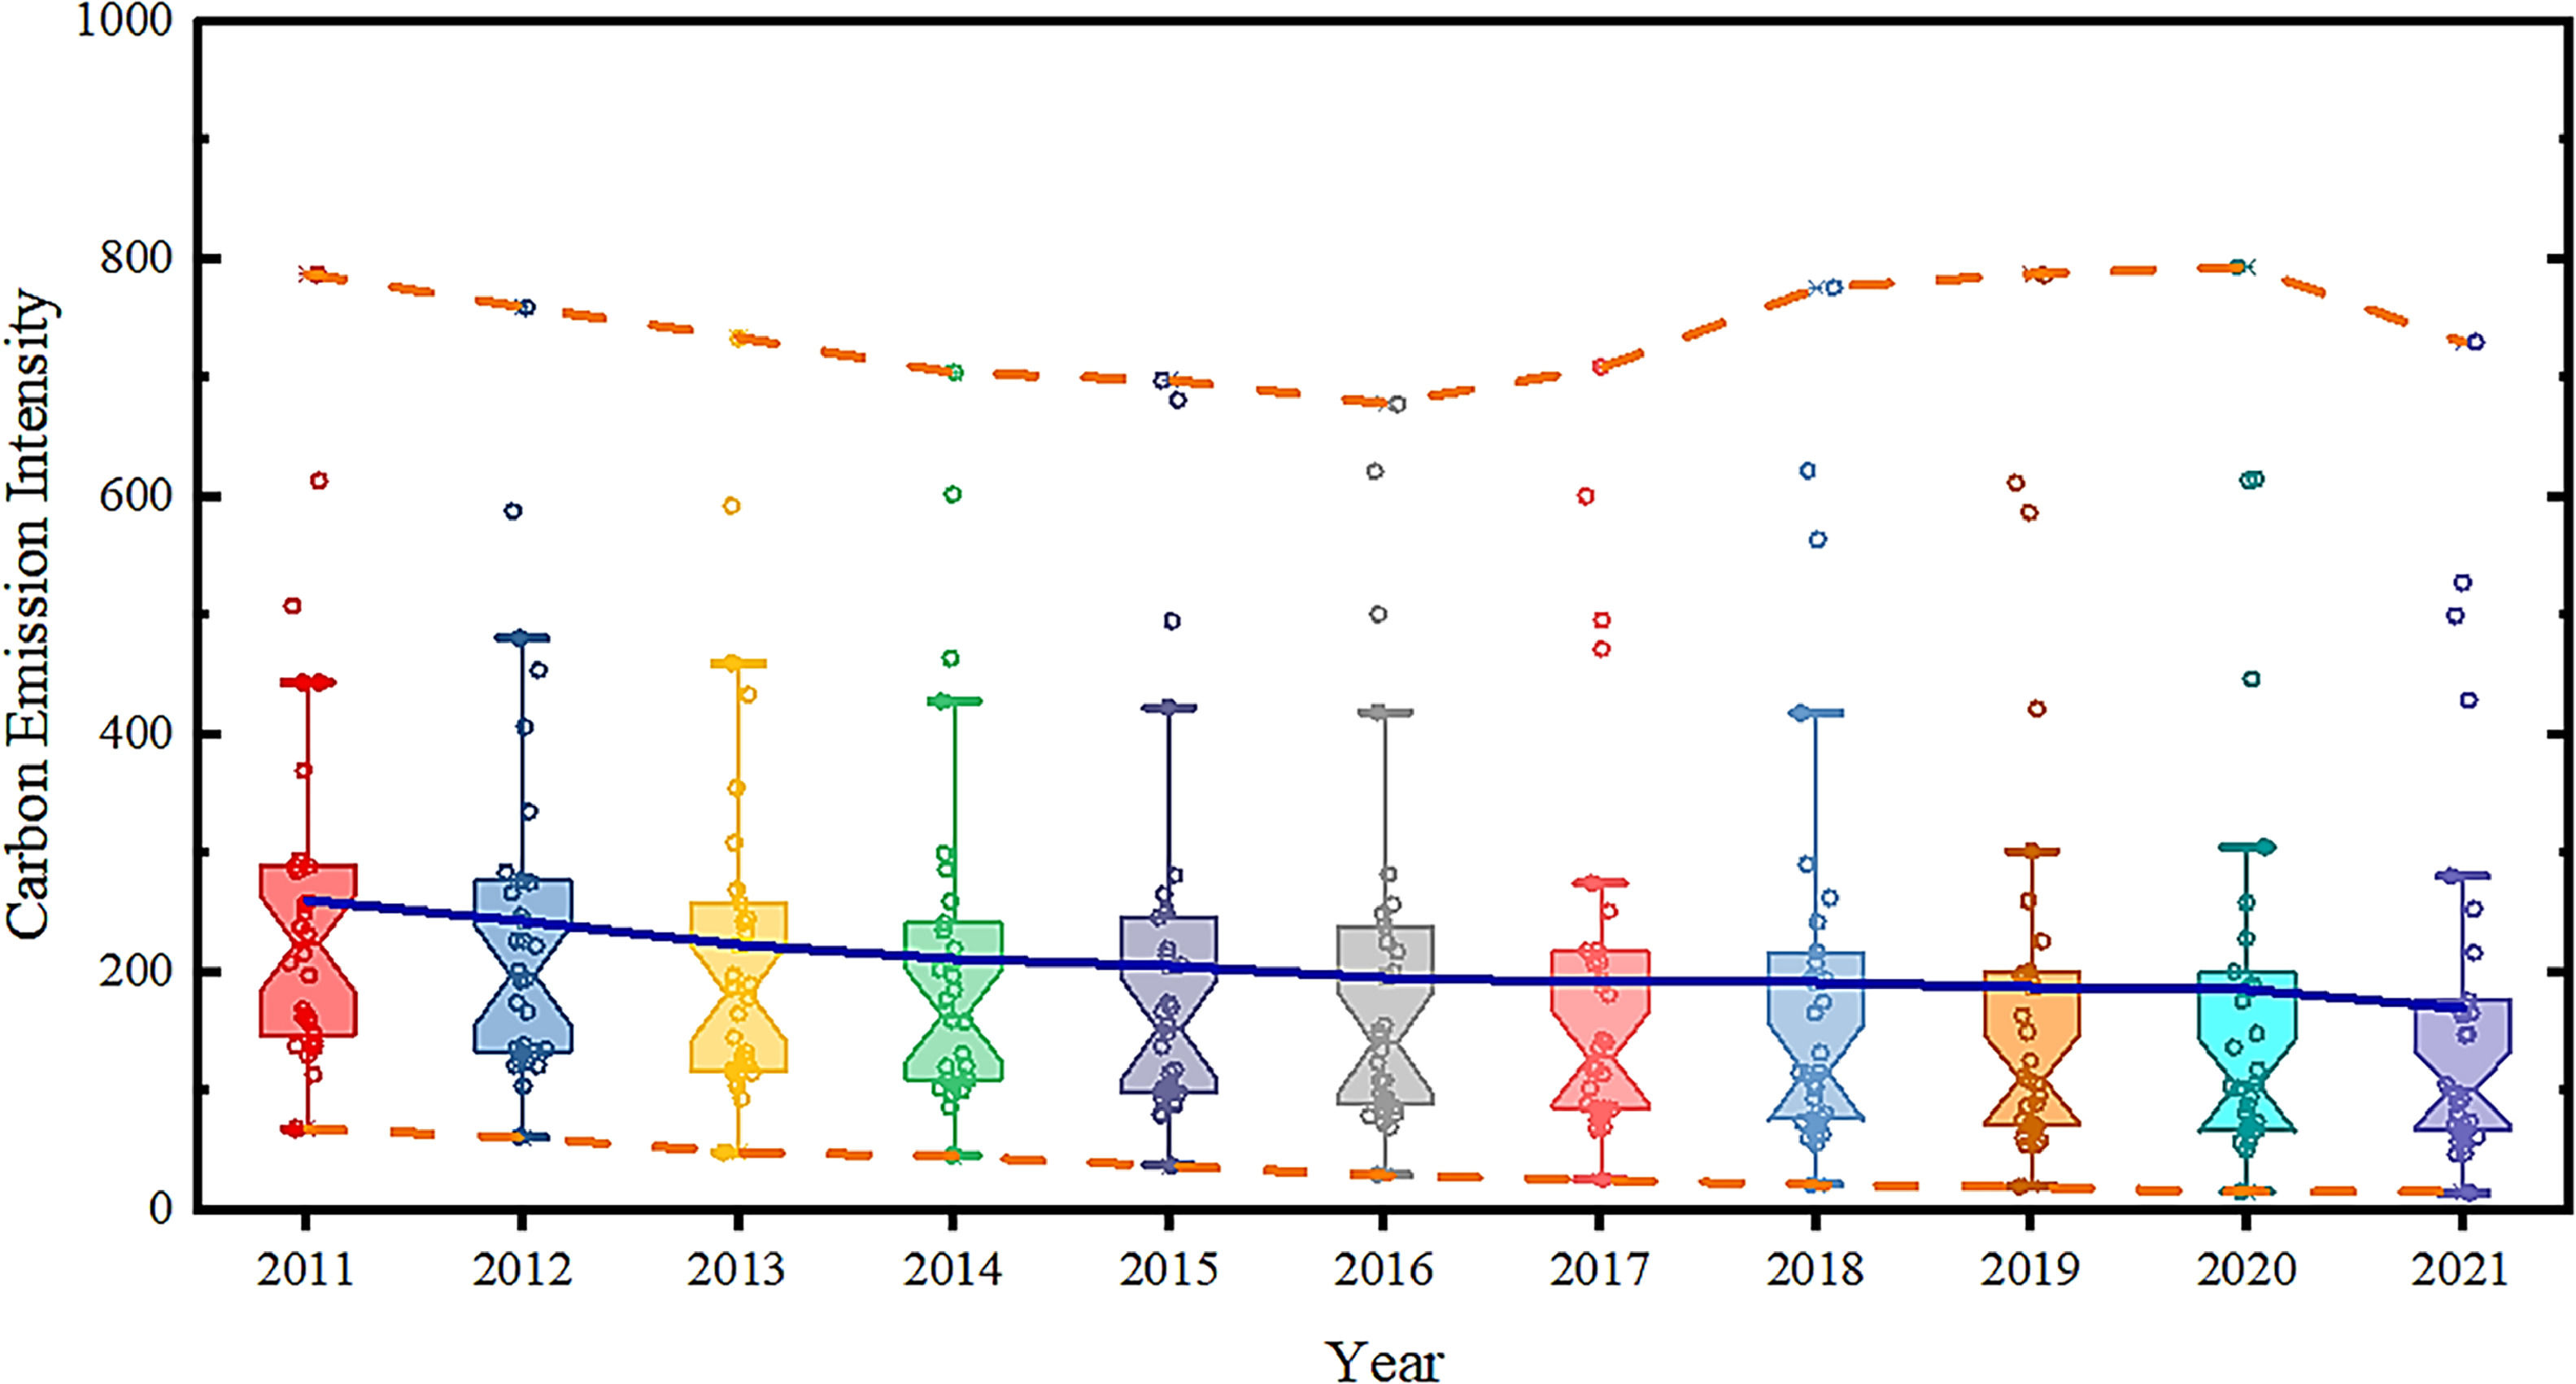
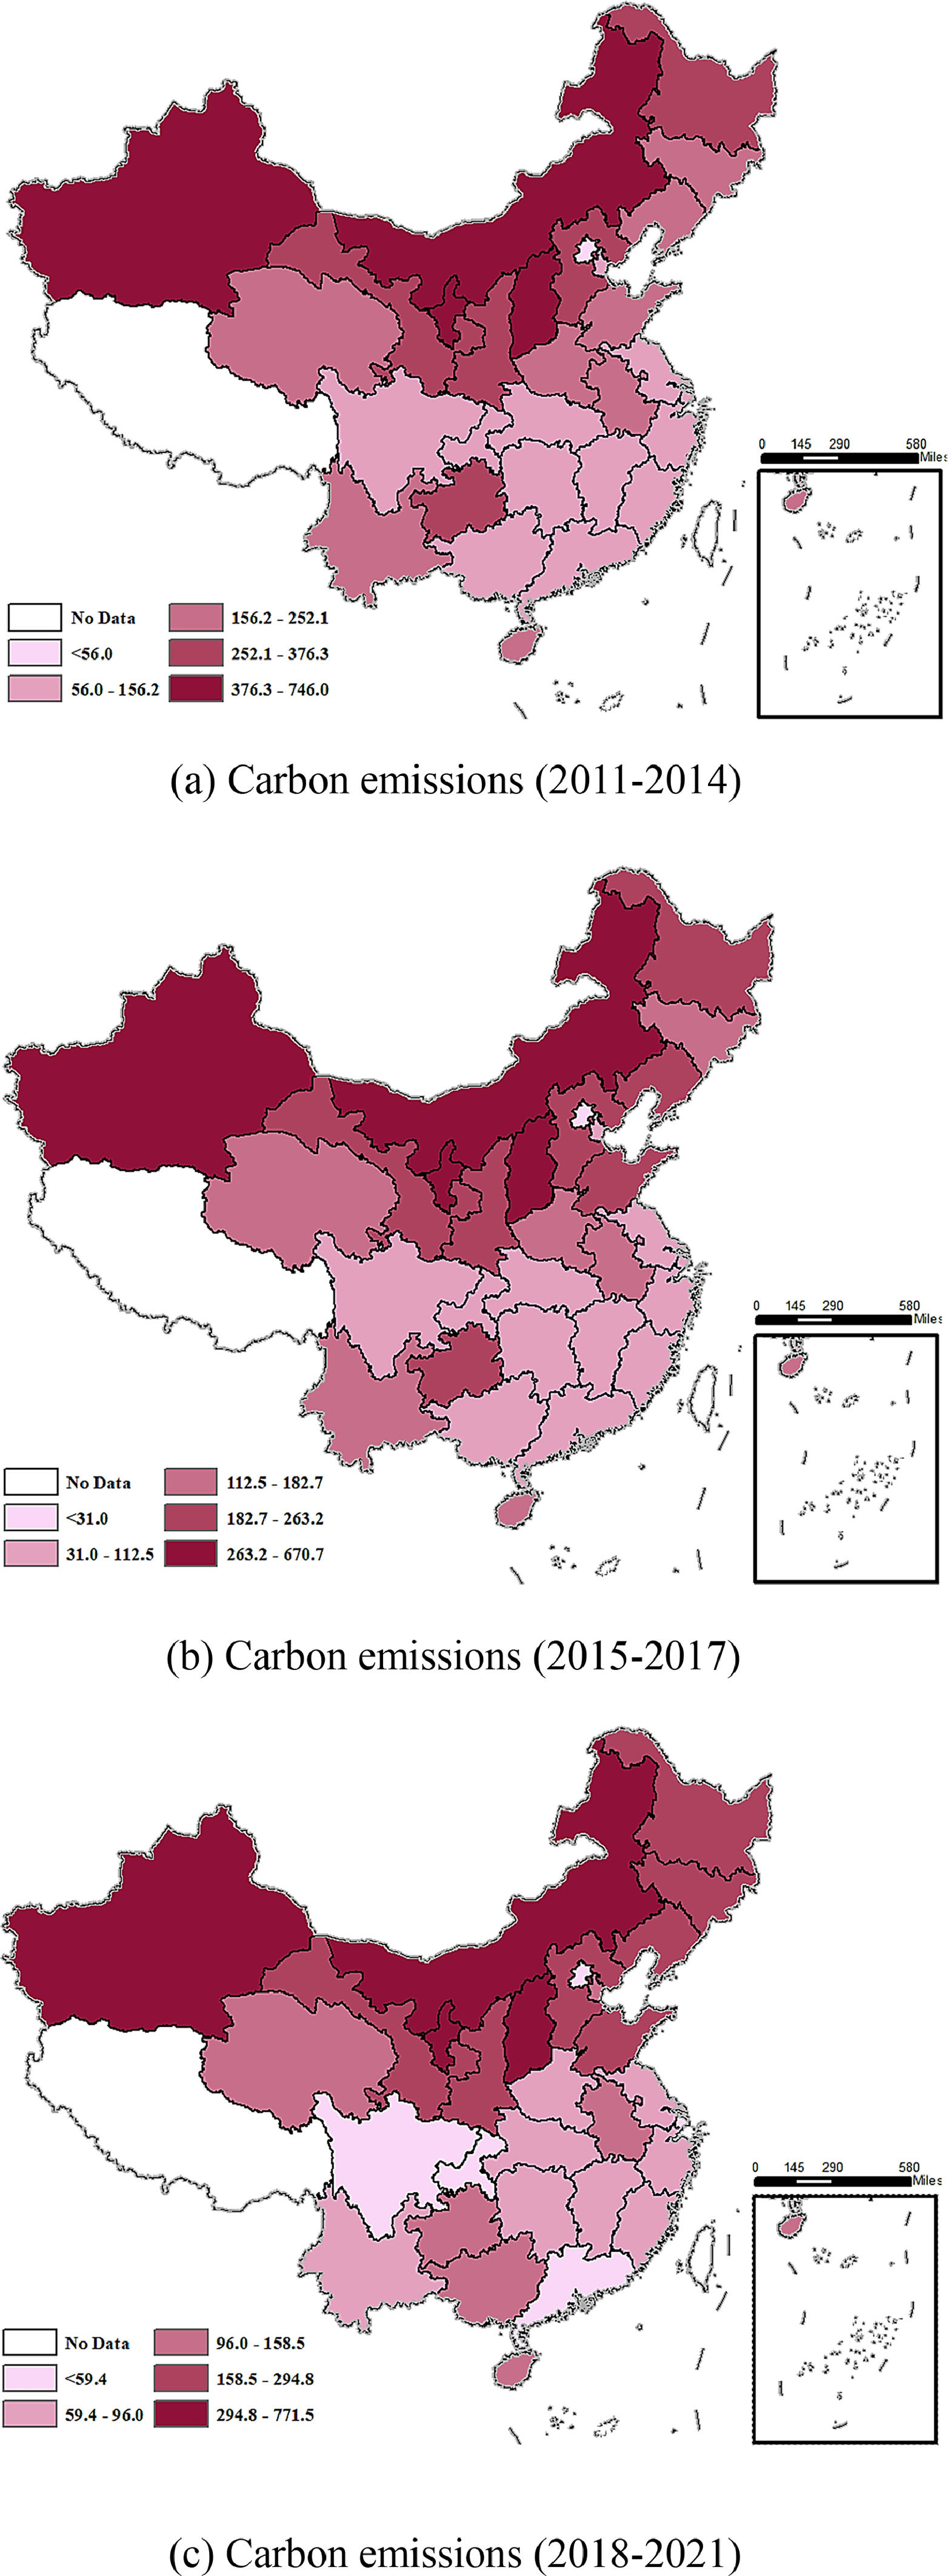
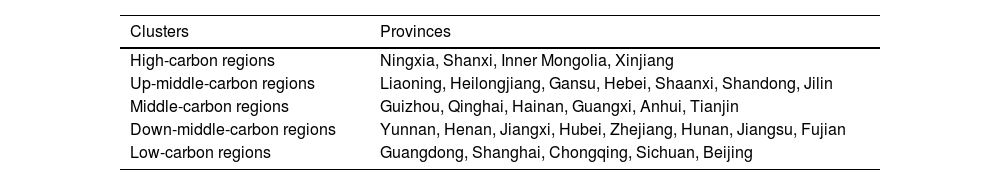
The boxplots in Fig. 3 illustrate the carbon emission intensity levels of the Chinese provincial regions for the period from 2011 to 2021. The solid blue line represents the average level of carbon emission intensity in China. A downwards trend of the blue line in Fig. 3 indicates that the environmental quality in China has improved in recent years. The two orange dotted lines represent the maximum and minimum carbon emissions. The increasing gap between both the two dotted lines has increased in recent years, indicating the imbalance and heterogeneity in carbon emissions among China's provincial regions. Fig. 4 illustrates the average level of carbon emission intensity in each province of China (excluding Hong Kong, Macao, Taiwan, and Tibet) for the periods from 2011 to 2014, 2015 to 2017, and 2018 to 2021. The results reveal conspicuous spatial variations in carbon emissions among Chinese provincial regions. Notably, the colors of some provinces, such as Sichuan, Chongqing, and Guangdong, are light, as shown in Fig. 4. This indicates that carbon emissions in some provinces change over time, indicating an improvement environmental quality. Table 3 shows the clustering results of carbon emissions for the period from 2018 to 2021, which indicate that the carbon emission intensity levels in Ningxia, Shanxi, Inner Mongolia, and Xinjiang are higher than those in other provinces in China.


Regional division of average carbon emissions in China for the period from 2018 to 2021.
In this paper, the independent variables (in addition to fintech) include the following: openness degree, measured as the sum of exports and imports as a share of GDP; capital, measured by the share of fixed asset investment in GDP; foreign direct investment (FDI), measured by the ratio of FDI to GDP; government, measured by public budget expenditure to GDP; development, measured by log per capita GDP; population, measured by log the total population; green investment, measured by the ratio of investment in environmental pollution controlling to GDP; green support, measured by environmental protection expenditure to public budget expenditure; urbanization rate, measured by the ratio of urban population to total population; urban living standard (ULS), measured by per capita disposable income of urban areas; rural living standard (RLS), measured by per capita disposable income of rural areas; and employment structure upgrading (ESU), measured by the ratio of employment in the tertiary industry. The data for all these variables were collected from China's National Bureau of Statistics, China Energy Statistical Yearbook, China Statistical Yearbook of Environment, and carbon emission account & datasets (CEADs).
Empirical analysisMain resultsThis paper adopts a generalized elastic net Lp-norm support vector quantile regression (GLpSVQR) (Ye et al., 2022) to explore the heterogeneous relationship between fintech and carbon emissions among Chinese provincial regions. Define X=(fintech,Opendegree,⋯,Employmentstructure)' and β=(β1,β2,⋯,β13)'. The quantile parameter τ is chosen from the following cases: 0.25, 0.50, and 0.75.
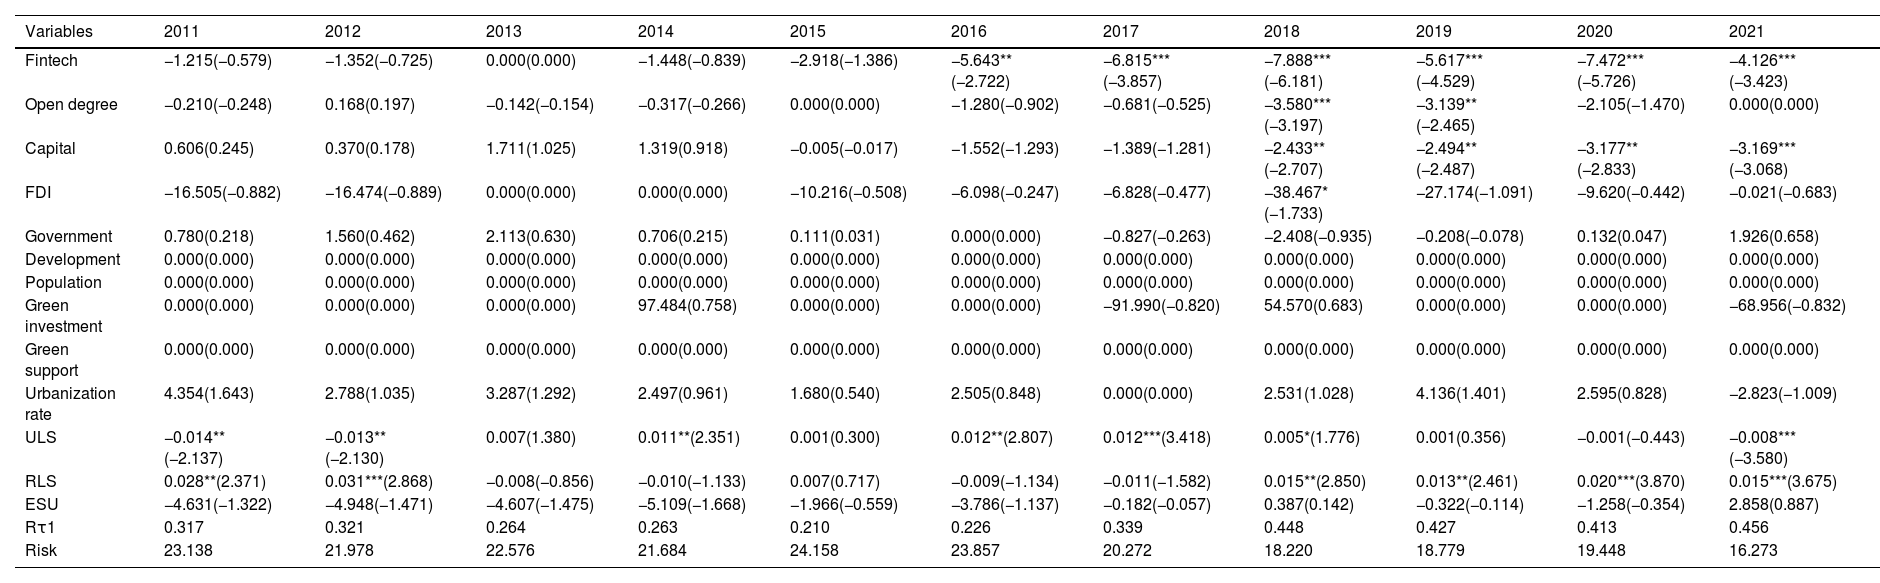
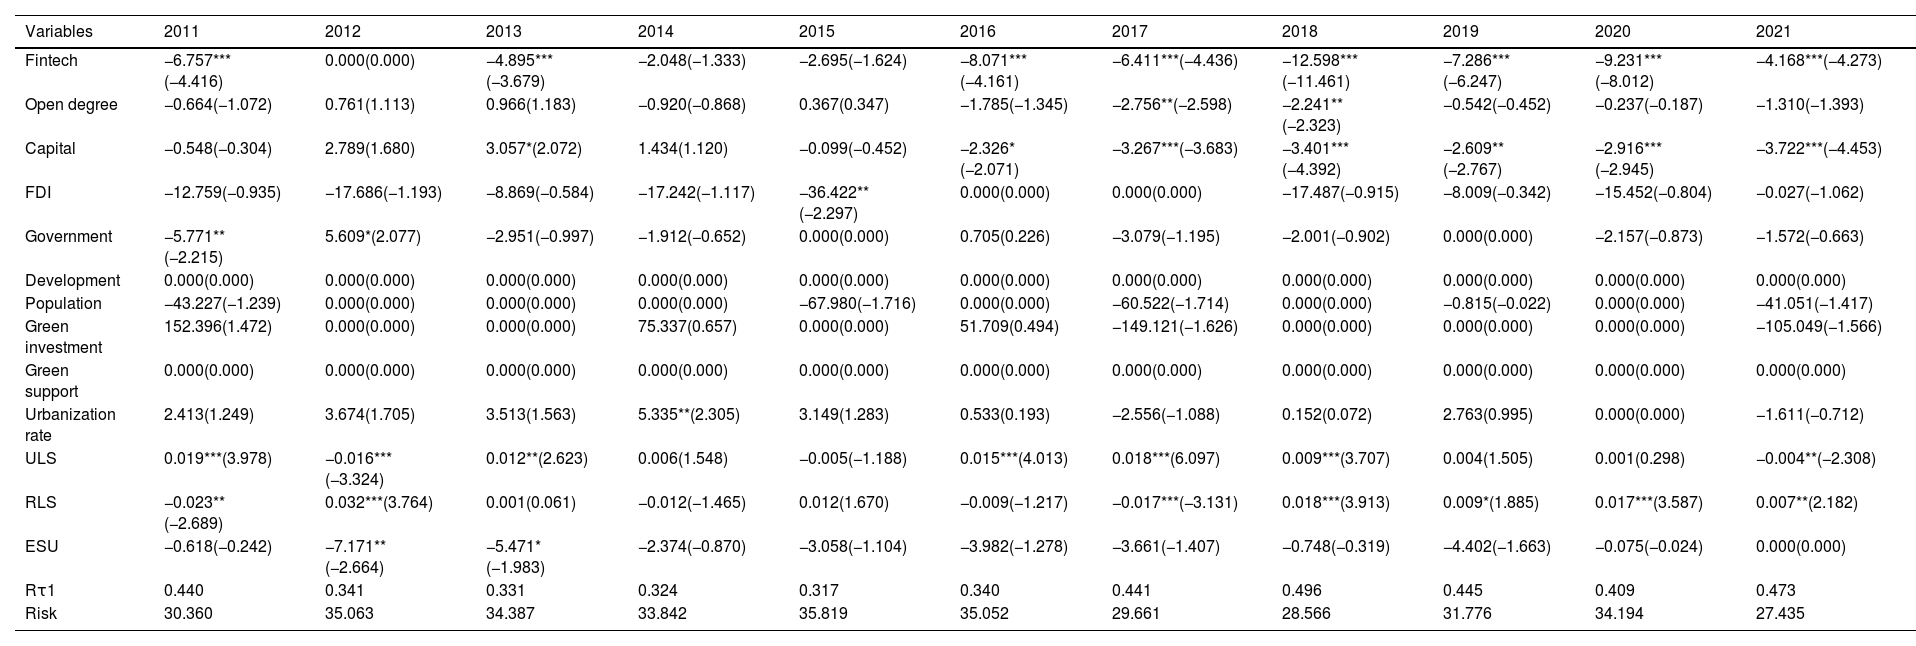
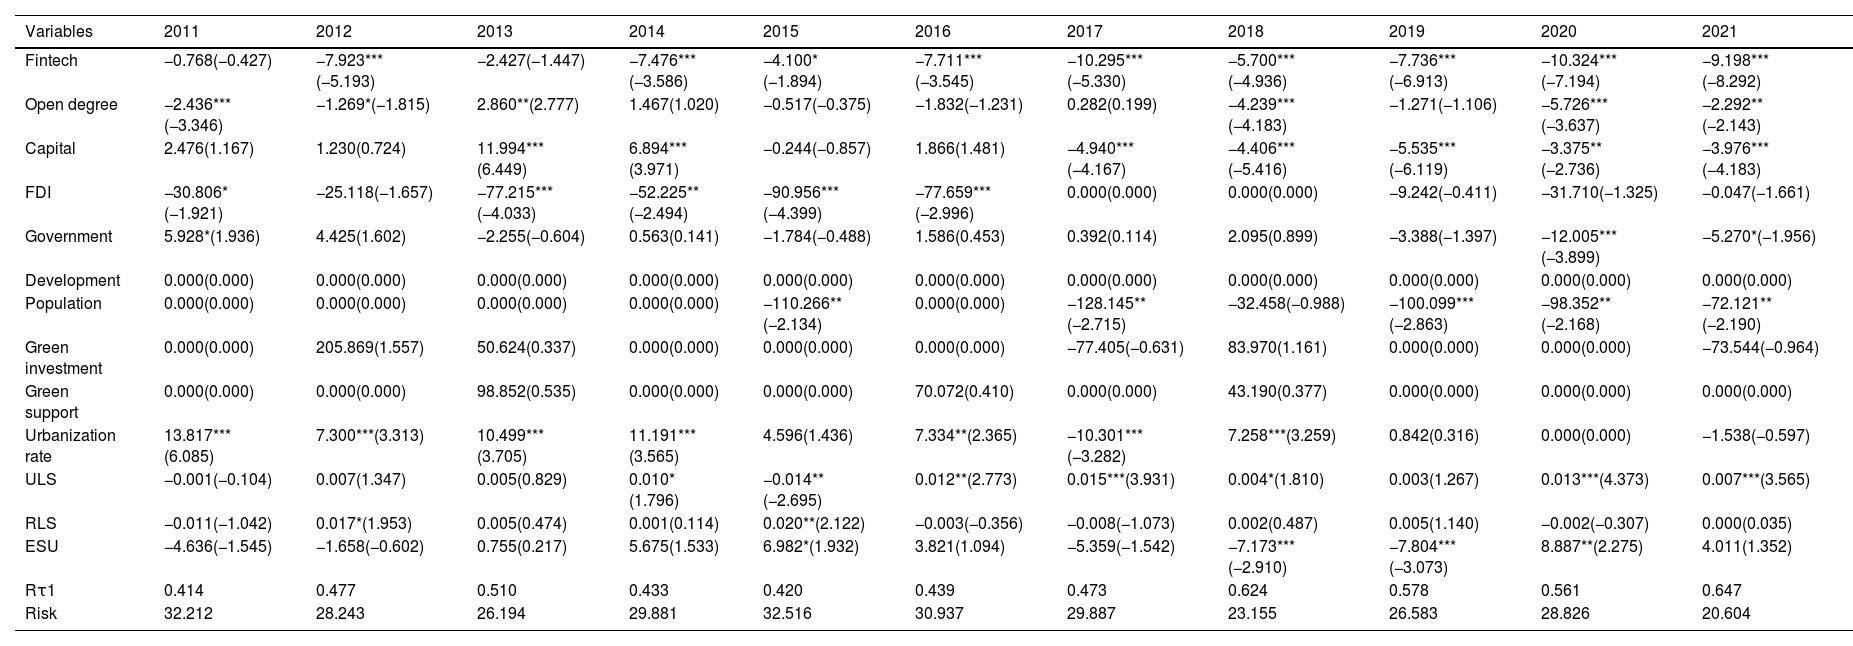
Tables 4-6 show the estimated regression coefficients Rτ1 and Riskτ when τ=0.25,0.50,and 0.75. Notably, some estimated regression coefficients exhibit exact zeros, indicating the sparseness of GLpSVQR. From Tables 4-6, we find that the GLpSVQR effectively selects the main influencing variables, including fintech, degree of openness, capital, FDI, government, urbanization rate, urban living standard, rural living standard, and employment structure. Furthermore, the negative coefficients of fintech at different quantile levels indicate that fintech reduces carbon emission intensity across all Chinese provinces. The reduction effect of fintech on carbon emissions at the 0.25th quantile level is significant beginning in 2016, which means that fintech in low-carbon regions has the ability to significantly reduce carbon emissions only when the development level of fintech reaches a certain degree. Compared with the regression results in Table 6, we find that the noticeable reduction effect of fintech on carbon emissions in high-carbon regions becomes significant after 2014. Therefore, the effect of fintech on carbon emissions reduction at high-carbon regions is greater than that in low-carbon regions.
Support vector quantile regression results at 0.25 quantile level.
*, **, and *** indicate significance at the 0.10, 0.05, and 0.01 levels, respectively.
Support vector quantile regression results at 0.50 quantile level.
*, **, and *** indicate significance at the 0.10, 0.05, and 0.01 levels, respectively.
Support vector quantile regression results at 0.75 quantile level.
*, **, and *** indicate significance at the 0.10, 0.05, and 0.01 levels, respectively.
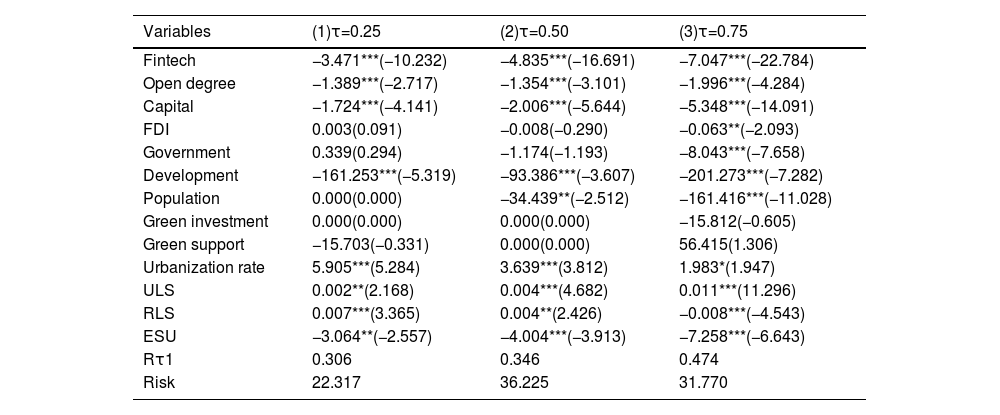
We introduce five dummy variables to control for time effects and subsequently employ the GLpSVQR to explore the heterogeneous relationship between fintech and carbon emissions across Chinese provinces from 2016 to 2021. The regression results are detailed in Table 7. Notably, the fintech coefficients across various quantile levels in Table 7 are negative and achieve statistical significance at the 1% level. This evidence indicates that fintech development plays a positive role in mitigating carbon emissions. Moreover, the reduction effects of fintech on carbon emissions across regions are heterogeneous. The results at the 0.25th, 0.50th, and 0.75th quantile levels represent the cases of low-effect provinces, moderate-effect provinces, and high-effect provinces, respectively. The estimated coefficient of fintech in Column (1), representing the results for low-effect provinces, suggests that a one-point increase in fintech results in a 3.471 decrease in carbon emission intensity. The estimated coefficient of fintech in Column (3), which represents the results for high-effect provinces, indicates that a one-point increase in fintech results in a 7.047 decrease in carbon emission intensity. As the quantile parameter increases, the impact of reducing carbon emissions becomes stronger, indicating that within provinces exhibiting higher carbon emissions, the development of fintech contributes more to the reduction in carbon emissions.
Support vector quantile regression results for the period from 2016 to 2021.
*, **, and *** indicate significance at the 0.10, 0.05, and 0.01 levels, respectively.
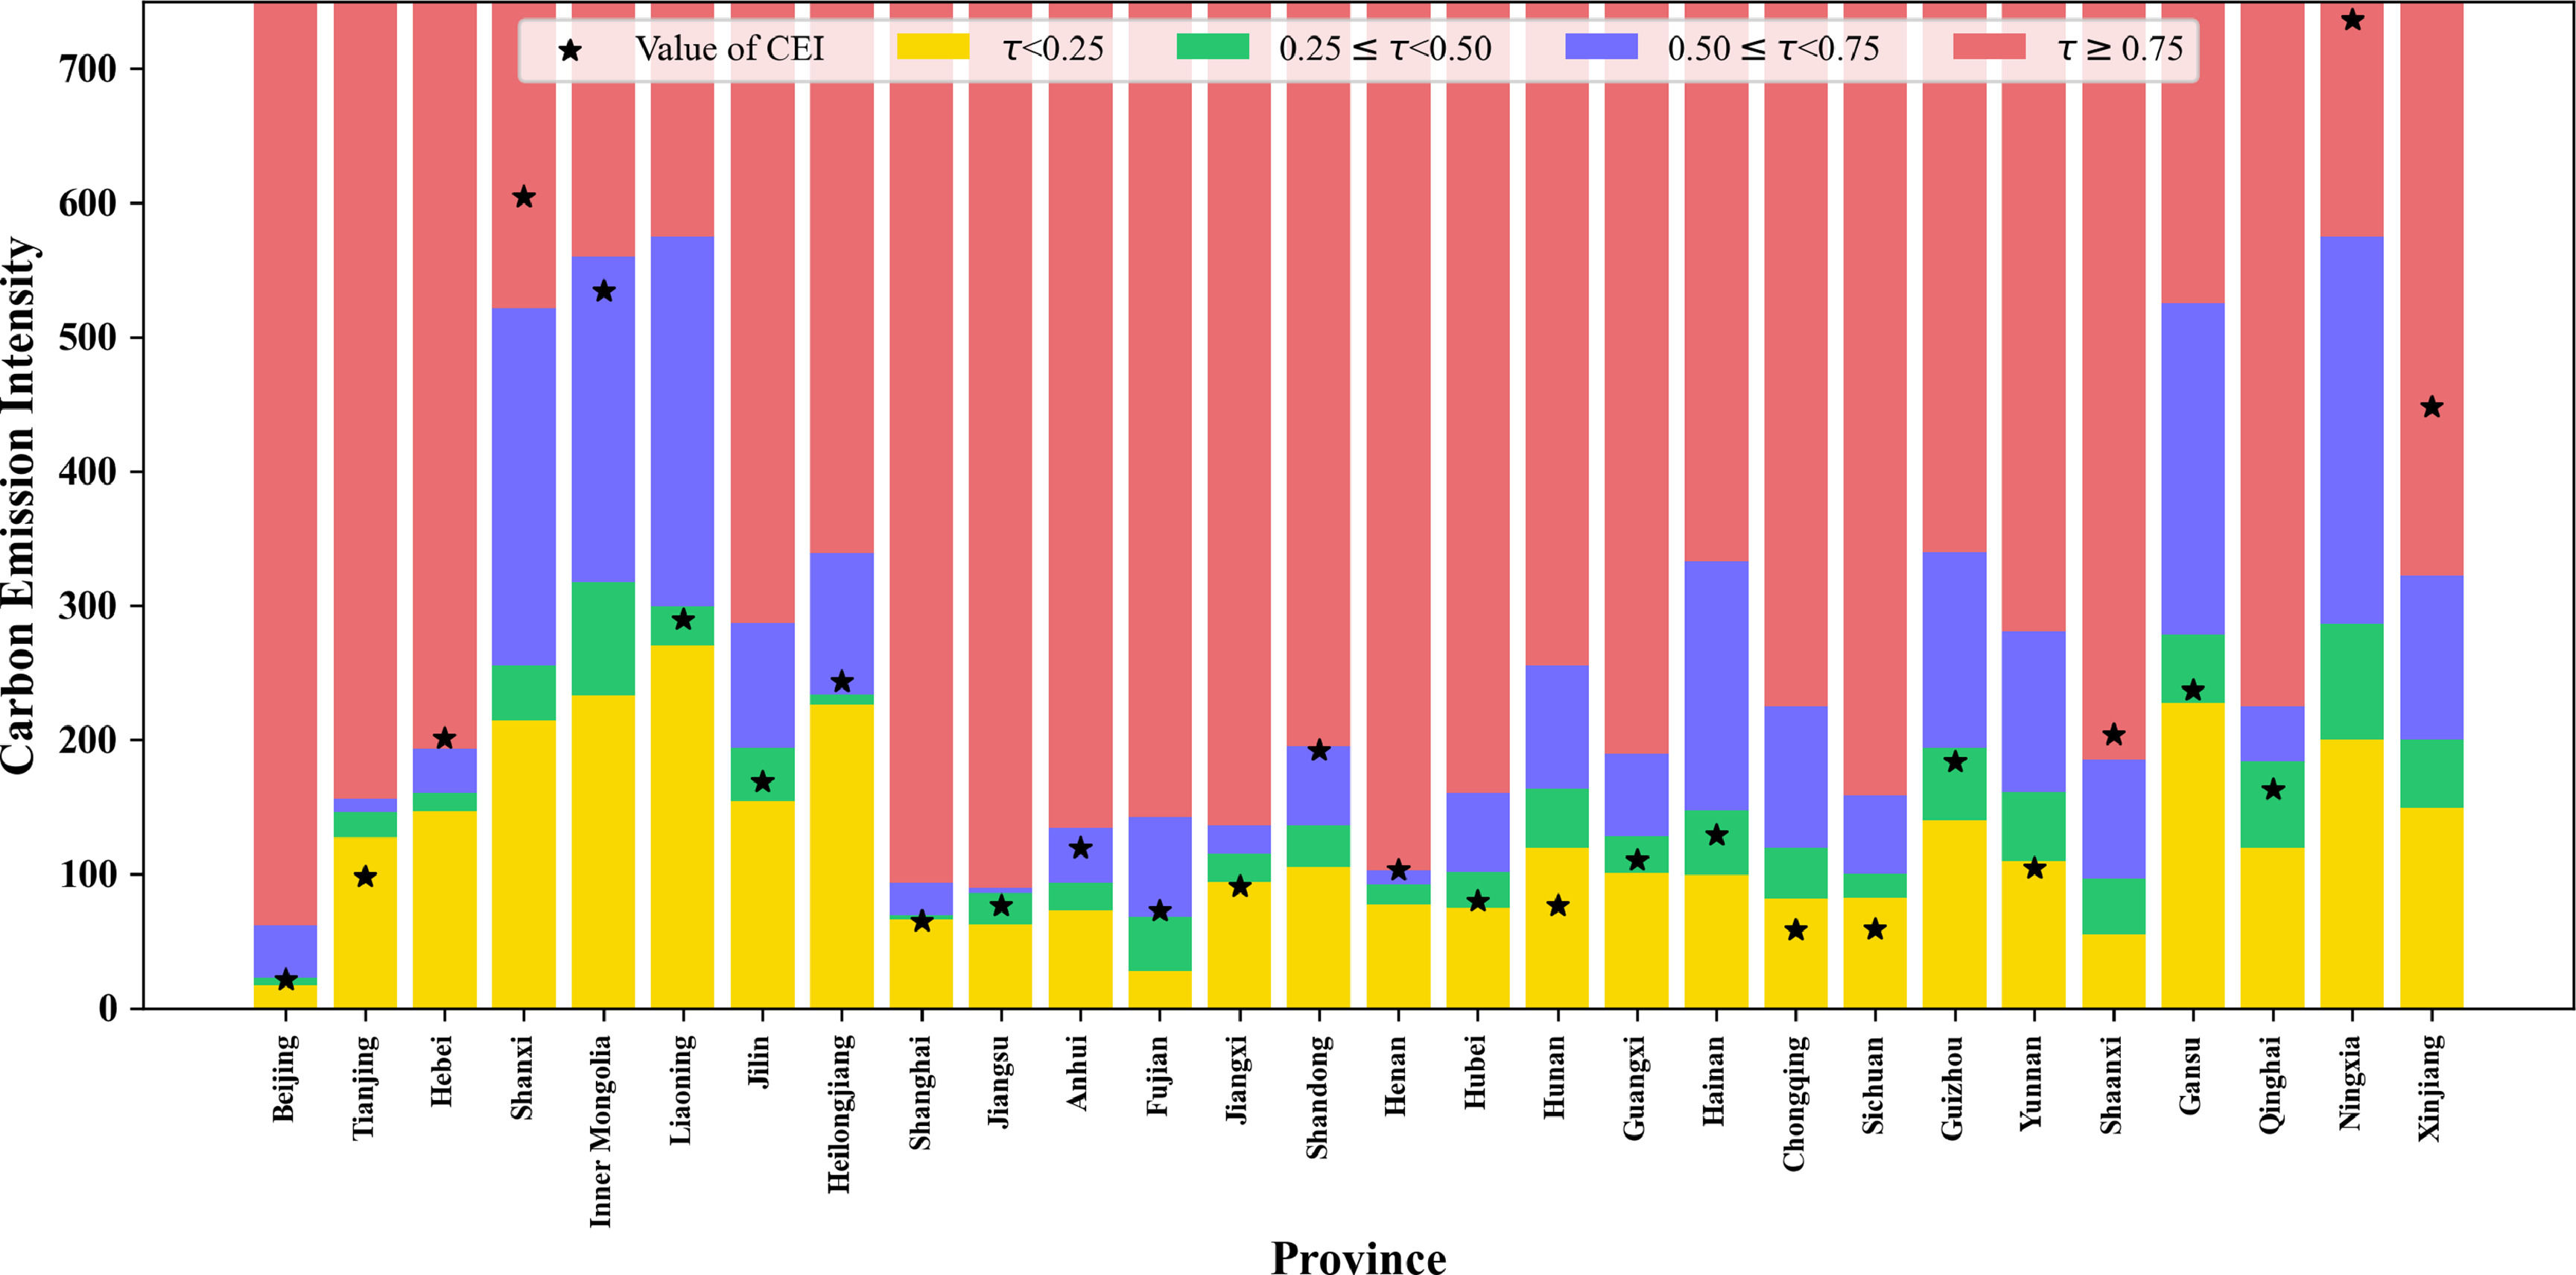
Based on the regression results at the three quantile levels shown in Table 7, we categorize the Chinese provinces (excluding Hong Kong, Macao, Taiwan, and Tibet) into four clusters, as illustrated in Fig. 5. The cluster results for Zhejiang and Guangdong are excluded in Fig. 5 since the difference between the forecast values of different quantile levels are not obvious. Moreover, the different zones in Fig. 5 represent different clusters of carbon emissions. The yellow zone represents the low-effect cluster, which included Chongqing, Sichuan, Yunnan, Jiangxi, Hunan, Shanghai, and Tianjin. The carbon emissions in Shanghai and Tianjin are relatively low for the advanced industrial system. The air quality in Chongqing, Sichuan, Yunnan, Jiangxi, and Hunan is high. The effect of fintech on carbon emission reduction in these provinces is relatively weak. The green zone represents the below-moderate-effect cluster, and includes Beijing, Liaoning, Jilin, Hubei, Guangxi, Hainan, Guizhou, Gansu, Jiangsu, and Qinghai. The blue zone represents the upper-moderate-effect cluster, and includes Fujian, Inner Mongolia, Heilongjiang, Anhui, and Shandong. The red zone represents the high-effect cluster, which included Shanxi, Hebei, Henan, Shaanxi, Ningxia, and Xinjiang. The provinces in the red zone included energy industry and have some heavy industrial parks. Carbon emissions in these provinces are high. Combining the results shown in Fig. 4 and Fig. 5, we find that the effect of fintech on carbon emission reduction in high-carbon provinces is much stronger than that in low-carbon provinces.
Robustness test
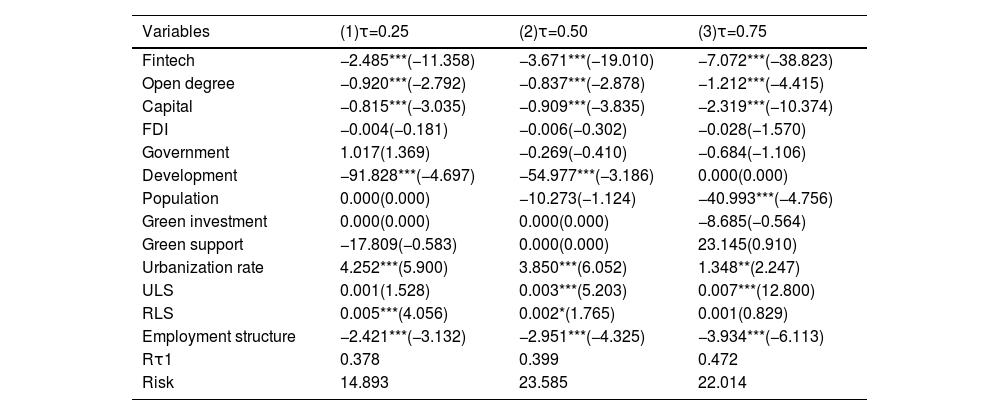
To test the robustness of the regression results of the GLpSVQR, we first replace the measure of carbon emissions with data collected directly from Carbon Emission Account & Datasets (CEADs). The test results for the period from 2016 to 2021 are shown in Table 8. The regression coefficient of fintech in Table 8 is significant at the 1% level, and the regression results for each independent variable are also basically consistent with the previously mentioned regression results. Additionally, the negative coefficients of fintech at different quantile levels indicate that an increase in the development of fintech is associated with a decrease in carbon emission intensity. Moreover, the positive effects of fintech on carbon emission reduction are much stronger in high-carbon provinces than in low-carbon provinces.
Re-estimation of regression results of GLpSVQR for the period from 2016 to 2021.
*, **, and *** indicate significance at the 0.10, 0.05, and 0.01 levels, respectively.
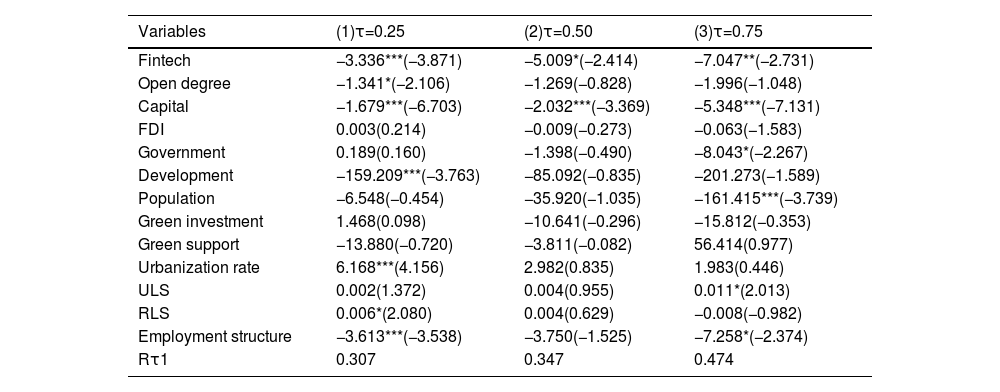
To further test the robustness of the regression results for GLpSVQR, we utilize classic quantile regression (Koenker & Bassett, 1978) to replace GLpSVQR, and the corresponding regression results are shown in Table 9. The negative coefficients of fintech in Table 9 indicate that fintech promotes environmental quality in Chinese regions, which is in line with the corresponding regression results in Tables 7-8. Moreover, the impact of fintech on carbon emissions becomes relatively stronger in the higher quantiles. For instance, a one-point increase in fintech leads to an approximately 3.336 decrease in carbon emissions at the 0.25 quantile, and a one-point increase in fintech leads to an approximately 7.047 decrease in carbon emissions at the 0.75 quantile. We further compare the regression results in Tables 6-8 and find that the sparseness of quantile regression (Koenker & Bassett, 1978) is relatively lower than that of GLpSVQR. The main reason is that quantile regression utilizes only the pinball loss function, while GLpSVQR adopts the sparse regularization technique, which is a great improvement in the quantile regression field.
Quantile regression results for the period from 2016 to 2021.
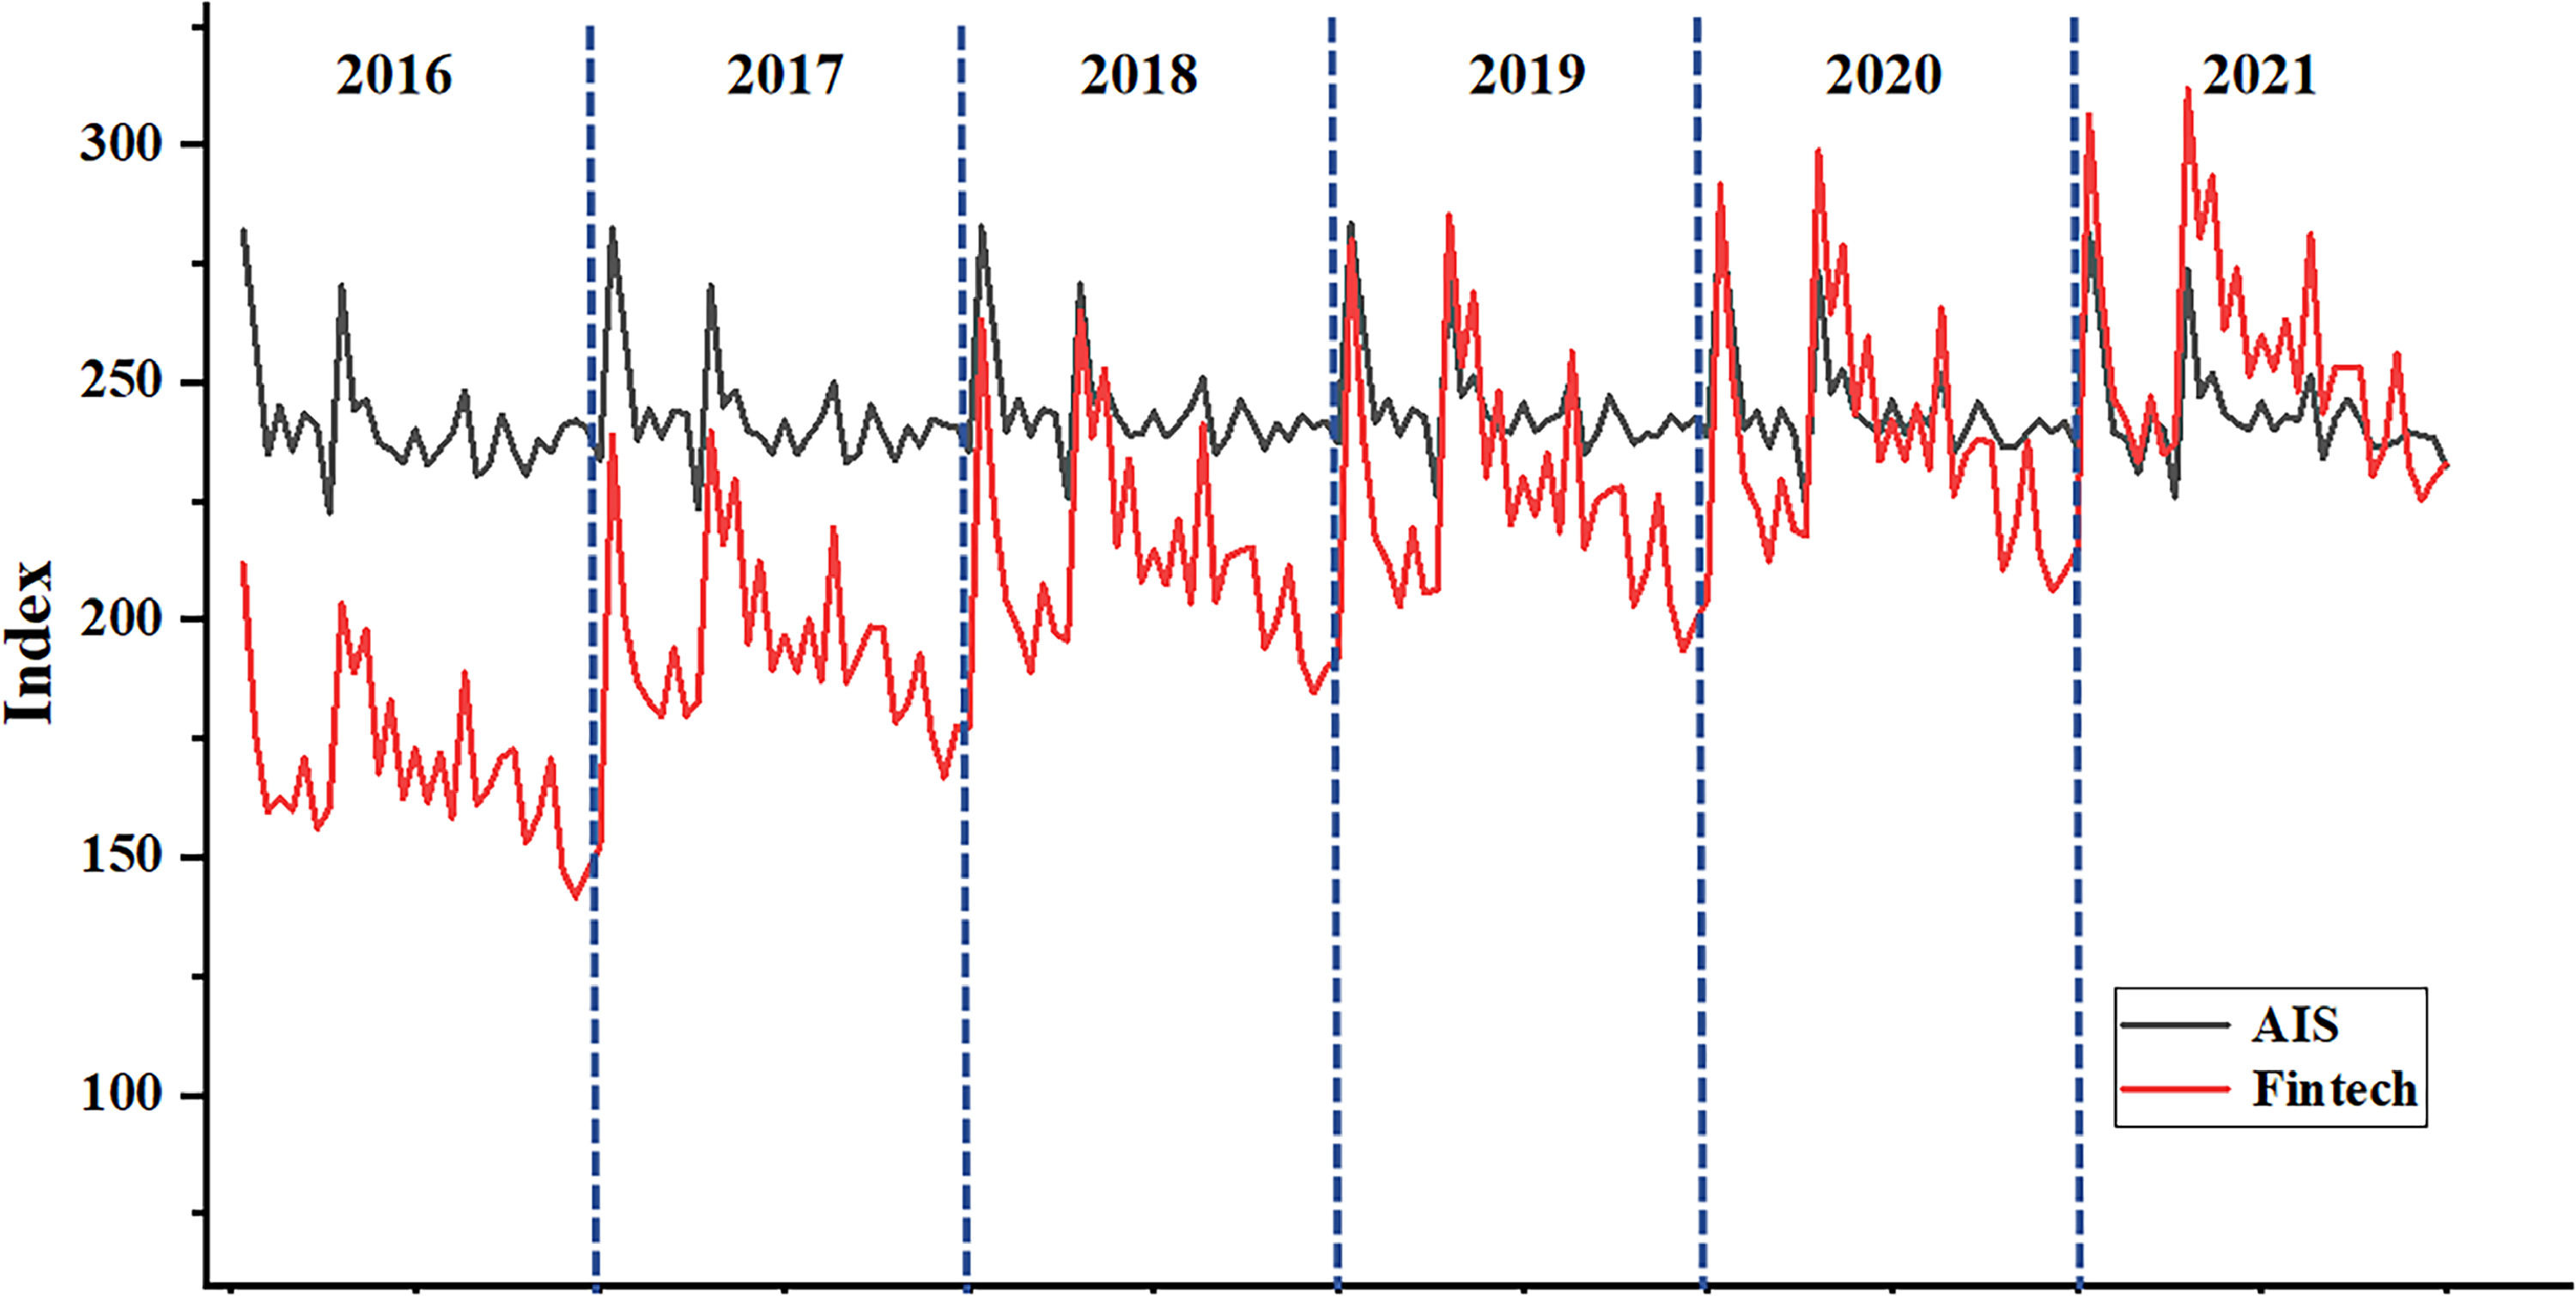
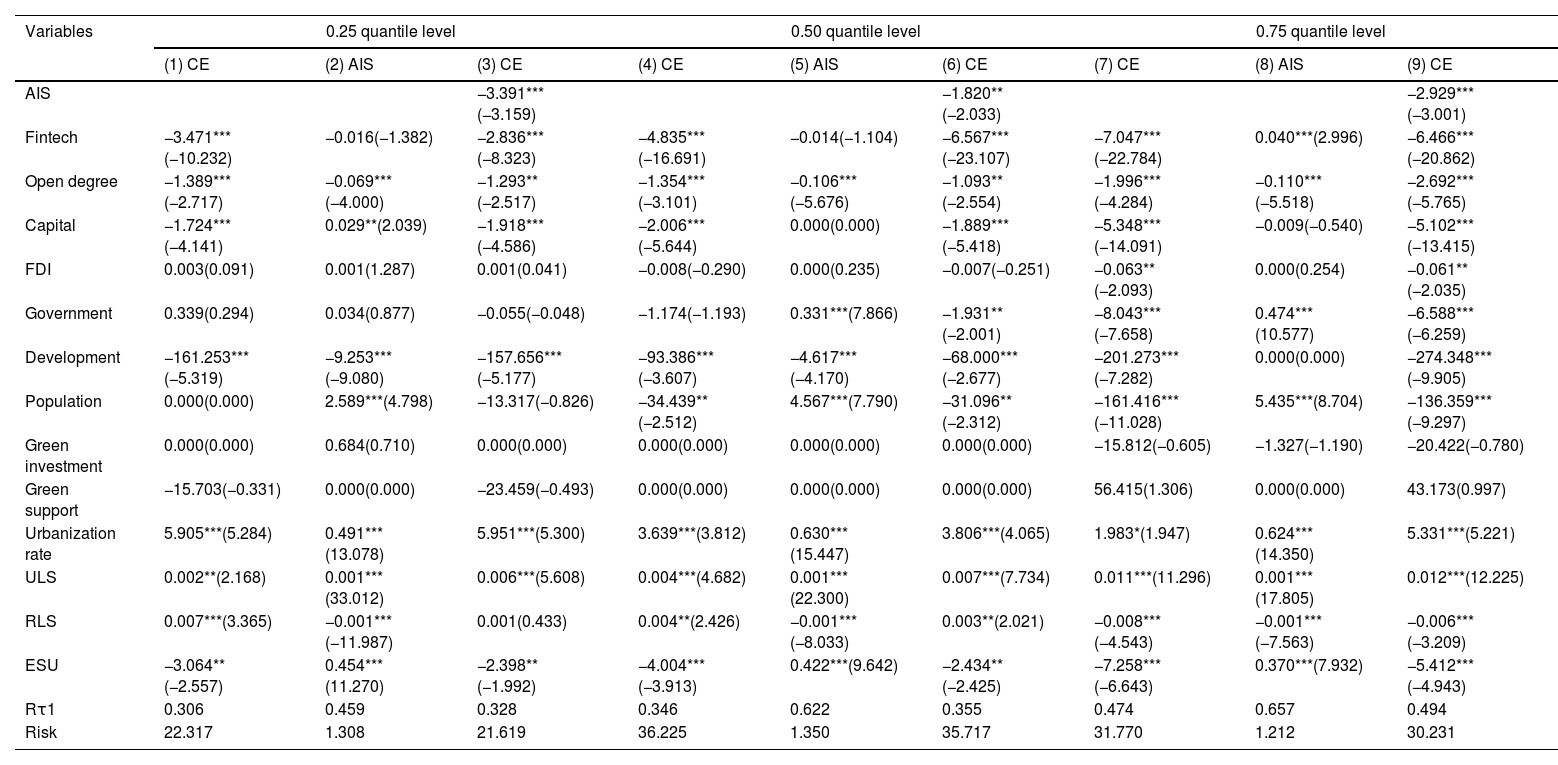
To examine the impact mechanism of fintech on carbon emissions, this paper selects industrial structure upgrading as the intermediary variable, which is measured by the advancement of the industrial structure (AIS). Fig. 6 illustrates the advancement of the industrial structure and fintech of Chinese provincial regions for the period from 2016 to 2021. From Fig. 6, we find that the trends in high-level fintech and high-level AIS are consistent, while those in low-level of fintech and AIS are opposite. The mechanism test results are shown in Table 10. In column (8) of Table 10, the regression coefficient of fintech is 0.040 and passes the significance test at the 1% level, indicating that there is a positive impact of fintech on industrial structure upgrading in high-development regions. Moreover, the regression coefficients of fintech in Columns (2) and (5) of Table 10 are negative but insignificant, revealing that there is no impact of fintech on the industrial structure upgrading in regions with low development. Comparing the regression results of fintech in Columns (2), (5), and (8), we find that the impact of fintech on industrial structure upgrading in high-development regions is stronger than that in other regions. The reason is that high-development regions are always the sources of financial innovations. The spreading and applying financial innovations in high-development regions is faster than that in other regions. Concerning the regression coefficients of the AIS in Columns (3), (6) and (9) of Table 10, we find that they are negative and significant at the 1% level, which indicates that industrial structure upgrading can reduce carbon emissions in Chinese provincial regions. Based on the regression results in Table 10, it is evident that the industrial structure upgrading has a partial mediating effect on the impact of fintech on carbon emission reduction in high-developed regions but has no intermediary effect in low-developed regions.

Mechanism test.
*, **, and *** indicate significance at the 0.10, 0.05, and 0.01 levels, respectively.
Amid the ambitious goals for carbon peak and carbon neutrality, this paper investigates the relationship between fintech and carbon emissions across Chinese provinces over the period from 2011 to 2021. To reflect the development level of fintech, we employ web crawler technology and word frequency analysis to create new variables and then combine the digital financial inclusion index of China (Guo et al., 2020) to construct a novel fintech index. Due to the unobserved heterogeneity property of imbalanced development among Chinese provincial provinces, we employed a generalized elastic net Lp-norm support vector quantile regression (Ye et al., 2022) to explore the heterogeneous impact of fintech on carbon emissions. The sparse Lp-norm support vector quantile regression utilizes a quantile parameter to completely capture the heterogeneous information in the variables. The empirical results indicate that fintech significantly reduces carbon emissions in all Chinese provincial regions. The positive effects of fintech on carbon emissions reduction are much stronger in high-carbon provinces than in low-carbon provinces. Furthermore, the mechanism analysis reveals that fintech contributes to carbon emission reduction by promoting industrial structure upgrading in highly developed provinces, but has no intermediary effect in less developed provinces.
Moreover, our analysis into the underlying mechanisms indicates that fintech aids in reducing carbon emissions predominantly through the enhancement of industrial structures in more developed provinces, whereas its effect is negligible in less developed regions, with eastern China showing more advanced fintech development compared to central and western China. Furthermore, provinces like Ningxia, Shanxi, Inner Mongolia, and Xinjiang report higher carbon emission intensities than others. Fintech has been a driver of carbon emission reduction in every province in China since 2016. However, the positive impacts of fintech on carbon emissions reduction exhibit obvious provincial heterogeneity and imbalance. Specifically, the reducing effects of fintech on carbon emissions in high-carbon provinces such as Shanxi, Hebei, Henan, Shaanxi, Ningxia, and Xinjiang, are stronger than those in other provinces.
Policy recommendationsBased on the above meaningful research results, we provide the following important policy recommendations:
- 1)
Addressing Imbalance and Heterogeneity in Fintech Development: Given the imbalanced and heterogeneous fintech development in Chinese provinces, policy-makers and practitioners should continue to increase investment in digital infrastructure and improve digital services to narrow the large gap between the eastern and western provinces, especially in Xinjiang, Gansu, Inner Mongolia, Guizhou, Ningxia, Xizang, and Qinghai. In addition, policy-makers and practitioners in western provinces should also promote digital data sharing system and comprehensively deepen data application. It is necessary to strengthen residents’ digital thinking, cultivate digital culture, and enhance digital literacy in western provinces.
- 2)
Mitigating Carbon Emissions: Although the average level of carbon emission intensity in China has decreased in recent years, the imbalance and heterogeneity in carbon emissions among China's provincial provinces are obvious. It is still a formidable task for us to achieve the goals of carbon peaking and carbon neutrality. Policy-makers and practitioners should supervise pollution emissions in high-carbon areas and encourage the use of renewable and sustainable energy, especially in Ningxia, Shanxi, Inner Mongolia, and Xinjiang provinces.
- 3)
A Heterogeneous Driver of Carbon Emission Reduction: This research reveals that the effect of fintech on carbon emission reduction in high-carbon provinces is stronger than that in low-carbon provinces. It is necessary to guide the flow and diffusion of emerging financial technology to high-carbon areas, such as Shanxi, Hebei, Henan, Shaanxi, Ningxia, and Xinjiang. Policy-makers and practitioners should actively encourage and support the utilization of fintech tools to control emissions in these provinces, thereby maximizing the potential benefits of fintech in carbon reduction efforts.
- 4)
Influencing Channel: The results of the mechanism test indicate that fintech contributes to carbon emission reduction through industrial structure upgrading in highly developed provinces. However, the intermediary effect of industrial structure upgrading is insignificant in provinces with low development. Therefore, policy-makers and practitioners should strengthen the development planning of fintech in low-development provinces and support the use of fintech in the process of upgrading the industrial structure.
This paper has several limitations that should be discussed. First, the measurement of technology level and innovation capability in this study relied on web crawler technology and word frequency analysis, primarily using keywords obtained from the Baidu index. Although the Baidu index is the largest search engine in China, fintech-related keywords from the Baidu index may not fully capture the comprehensive technology and innovation landscape. Second, this study focused solely on examining the impact of fintech on carbon emission reduction through the intermediary variable of industrial structure upgrading. Although this mechanism is found to be significant, it is important to recognize that there may be other transmission mechanisms through which fintech influences carbon emissions. Future research should explore and enrich these additional transmission mechanisms to gain a more comprehensive understanding of the multifaceted nature of the relationship between fintech and carbon emissions.
This work is supported by the National Natural Science Foundation of China (Nos. 12101552 and 61603338), the Natural Science Foundation of Zhejiang Province (No. LY21F030013), the National Social Science Foundation of China (No. 21BJY256), Philosophy and Social Sciences Leading Talent Training Project of Zhejiang Province (No. 21YJRC07-1YB), and Social Science Foundation of Zhejiang University of Technology (GB202303001).