


The widespread application of data technologies such as big data, artificial intelligence, and the Internet of Things plays an important role in promoting agricultural technology innovation. This article uses the 2022 survey data of farmers' economic behaviour in Hubei Province, China to construct an analytical framework and indicator system for the impact of digital technology adoption on farmers' grain production technology innovation. The relationship between digital technology adoption and farmers' grain production technology innovation is explored using binomial logistic regression models and multiple linear regression models, And use regression decomposition method to calculate the degree of impact of digital technology adoption on farmers' grain production technology innovation. The research has drawn the following conclusions: firstly, digital technology is conducive to enhancing technological innovation in grain production; The second is that innovation in grain production technology is the result of multiple factors such as digital technology, agricultural machinery and technology promotion, farmers' income, and skill training working together; The barriers and limitations of digital technology on innovation in grain production technology can be overcome by improving the service level of agricultural machinery and promoting agricultural technology training. This article believes that enhancing the innovation level of grain production technology requires attention to the adoption of digital technology and adopting diversified measures to enhance the innovation level of grain production technology amongst farmers.
Food is a basic necessity of human life, and the stability of grain production directly affects everyone's right to survival and health. It is crucial to ensure the basic living needs of the global population (Chin et al., 2024). As a populous country, China has always attached great importance to grain production. Since 2021, the Chinese government has set an annual grain production target of over 65 million tons for four consecutive years (Wang et al., 2024). China's total grain production remains the world's largest, maintaining a high level of over 600 million tons for nine consecutive years, effectively enhancing its grain production and reserve capacity. However, with the acceleration of urbanisation and industrialisation, arable land resources are becoming increasingly scarce, posing a threat to the stability and sustainability of grain production; In addition, with the upgrading of people's consumption structure and the continuous growth of food demand, the structural contradiction between food supply and demand is becoming increasingly prominent.
Therefore, promoting technological innovation in grain production and improving grain production efficiency and quality, has become an important issue that urgently needs to be addressed. Promoting technological innovation in grain production is conducive to the rational allocation of resources and provides guarantees for food security. The basic ability types of scientific and technological innovation indicators for grain production and the transformation ability of scientific and technological innovation achievements are the main indicators that affect grain yield, amongst which the investment in essential resources for scientific and technological innovation and the transformation of scientific and technological innovation achievements are the most important for improving grain yield (Zhang et al., 2021). Based on panel data on the input and output of China's three major staple grains, Zhu et al. (2022) found that progress in production technology can significantly and effectively reduce grain production costs. Li and Li (2022) found that grain production technology is the main factor in reducing the carbon emission intensity of grain production, and agricultural technology innovation and promotion should be strengthened. Lu et al. (2019) found that agricultural technology innovation can to some extent, alleviate the impact of climate change on agricultural water resources and China's grain production. Miao (2019) found that the progress of grain production technology has a biased evolution, which is conducive to improving overall social welfare. Starting from the current situation of the grain production cycle in the United States, Basso et al. (2021) discovered that through new agricultural digital, mechanical, and biotechnology technologies, as well as optimising land use selection and crop management, a closed-loop of nutrient and energy flow within farms could be achieved, transforming a ‘linear’ grain production system into a more circular and sustainable grain production system.
In recent years, digital technology has brought enormous historical opportunities for global change, and it has become the core driving force for China's economic growth. With the acceleration of digital infrastructure construction and the digital transformation of agriculture, the rapid development of digital technology has provided new possibilities for innovation in grain production technology, changing the development mode of the grain industry. Digital technology with the internet, big data, and cloud computing as the core provides strong technical support for the precision and intelligence of grain production and provides a new path, momentum, and vitality for the sustainable development of grain production. Specifically, digital technology can precisely control key factors such as soil, climate, and crop growth by collecting and analysing a large amount of data on grain production, thereby achieving precise input of factors and optimised resource allocation, reducing environmental pressure, and improving grain production efficiency. Digital technology can disseminate agricultural information amongst farmers, helping them obtain more market information and knowledge, and promoting agricultural technology (Aker et al., 2016). Innovation in grain production technology also has a significant promoting effect on total factor productivity. For example, Zhang et al. (2021) analysed the factors influencing grain production efficiency in China's 13 main production areas from the perspective of grain subsidies. They found that the changes in total factor productivity of grain production in China's main production areas are mainly determined by technological progress and changes in pure technological efficiency. Using time series data from various provinces in China, Zheng et al. (2023) found that technological advancements in grain production mainly drive the growth of total factor productivity in the grain sector.
Based on the above analysis, this article aims to explore the impact of digital technology adoption on technological innovation in grain production. Compared to other studies, this study has three unique contributions. Firstly, limited research has only focused on the impact of digital technology adoption on grain production, with few studies paying further attention to technological innovation in grain production. This study establishes a systematic theoretical analysis framework and thoroughly explores the relationship between digital technology adoption (whether adopted and to what extent) and innovation in grain production technology. Secondly, this study used micro survey data from 1046 households in the main rice producing areas of Hubei Province, China to test the theoretical analysis framework and examine the impact mechanism of digital technology adoption on technological innovation in grain production. A heterogeneity analysis was also conducted. Thirdly, previous studies have mainly used simple empirical methods, only demonstrating whether adopting digital technology affects technological innovation in grain production. This article further investigates how digital technology adoption affects technological innovation in grain production.
Literature reviewDigital technology utilises modern computer technology to convert traditional information resources (images, text, sound, images, etc.) into digits ‘0′ and ‘1′ that computers can recognise and perform operations, processing, storage, transmission, dissemination, and restoration. Digital technology is built on the ability to access the internet, and its essence is from the combination of digital and technology to the collection and intelligent action of information (Li, 2023). It requires the introduction and use of a large amount of information storage and processing technology (big data, cloud computing), the Internet of Things, end-to-end information technology, and network security technology (Irtyshcheva et al., 2020) to achieve automation and comprehensive automation of most processes and industries. Improving the level of informatisation, intelligence, and resource allocation efficiency of the entire society provides conditions for forming good relationships between the government, enterprises, and society (Chao, 2021). Digital technology mainly includes digital communication technology, digital image processing technology, digital audio technology, digital video technology, and digital signal processing technology (Mulgan, 1991; Irtyshcheva et al., 2020).
The development of digital technology has brought about tremendous social change and progress, such as human behaviour, social relationships, and understanding of life (Antonio et al., 2020; Chareonwongsak, 2002), and improving medical standards, scientific research, production processes, and social welfare. (Adenle et al., 2019; Brey, 2018; Chareonwongsak, 2002; Khansa et al., 2016; Shine, 2004; Sikhulumile, 2019). For example, the deep integration of digital technology in fields such as carbon footprint and carbon sequestration can promote digital monitoring, precise emission measurement and prediction, planning and implementation efficiency improvement in the energy industry, directly or indirectly reducing carbon emissions in the energy industry, and is the best tool to achieve carbon neutrality goals (Chao, 2021; Chen et al., 2022). The research and application of digital technologies such as virtual simulation technology, medical digital robots, micro electromechanical digital systems, digital medical equipment, and digital medical images in clinical medical services have enabled some clinical medical work to achieve digitisation, visualisation, and intelligence, achieving the goal of accurate diagnosis and effective treatment (Shine, 2004). Digital technology has brought innovation in drawing technology and precision in surveying and mapping technology (Barbarella, 2014). Computer-aided design (CAD) has replaced drawing boards, and the emergence of building information modelling (BIM) has replaced drawings with databases while integrating owners, designers, constructors, tradespeople, manufacturers, and suppliers and digitising building information (Ebekozien & Samsurijan, 2022). Digital technology integrates CAD and computer numerical control (CNC) processing into the production of parts in furniture, cabinets, machinery, and related industries, which can simplify many production processes (Wiedenbeck & Parsons, 2010). Some manufacturers introduce digital tools and technologies to integrate systems, capture and analyse data, and use 3D printing, automation, and robotics technology to meet growing business needs. The application of digital 3D anthropometry, 3D clothing-aided design, and simulation clothing design has adapted to people's requirements for clothing quality, adaptability, and personalisation (Dai, 2011); In addition, digital technology can change the inherent uncertainty in the entrepreneurial process and outcomes (Nambisan, 2017), improving the average skill level of young people (Holmes, 2007).
The achievement of high-quality agricultural development, consolidation of food security, and innovation in agricultural technology are closely related. The priority direction for developing of agricultural science and technology is the rational development of grain yield-increasing technology (Petukhova, 2022), and the technological progress of grain production is a crucial driving force for the sustained growth of grain production (Miao, 2019). Jiao et al. (2018) found that from 2006 to 2015, the growth rate of grain production exceeded the growth rate of fertiliser consumption, partly due to technological innovation. The detailed historical role of technological innovation and agricultural environmental policies on the sustainability of China's grain production was determined for the first time. To achieve the development of grain production and improve its competitiveness and efficiency, it is necessary to develop the achievements of technological progress further to improve production efficiency (Ibodullaevna et al., 2019). The innovation and integration of advanced technologies in grain production are becoming critical tools for the overall development of agricultural sectors such as sustainable agricultural production and crop management, helping to make precise decisions to increase food crop yields (Sarfraz et al., 2023).
Some scholars focus their research perspective on the micro level of grain production technology. For example, Jiao et al. (2019) proposed using technology backyards as a new method for agricultural technology innovation and dissemination in the field of small farmers. Developing innovative technologies based on the precise needs of farmers can promote innovation and exchange of agricultural technology, and achieve sustainable intensification in the field of small farmers. Adnan et al. (2018) psychologically measured the willingness of Malaysian rice farmers to adopt innovative green fertiliser technologies. Adnan et al. (2019) evaluated the role of Malaysian rice farmers in implementing green fertiliser technology decisions. They found that cost has an interactive effect on the relationship between farmers’ behavioural willingness and the adoption of innovative green fertiliser technology. Using provincial-level panel data in China, Gong et al. (2023) found that innovation in characteristic seed industries in different regions promotes green grain production. Seed industry innovation not only improves the production efficiency of green food, but also drives the promotion of production technology. Through research on Japan's intelligent rice production mode, Li and Li (2022) found that rice production is closely integrated with the planting structure of Japanese agriculture. Whether it is individual rice production technology innovation or mode, it is an important field for the research and application of intelligent agriculture.
From the perspective of the determination and constraints of technological innovation in grain production, agricultural land leasing is beneficial for applying new agricultural production technologies and management methods in wheat and corn production (Liu et al., 2019). Using inter provincial data in China, Lin et al. (2023) found that green growth in agriculture is driven by the digital transformation of agriculture, significantly promoting green technology innovation. The gender differences in adopting innovative production technologies for modern corn varieties stem from the gender differences in obtaining supplementary inputs (Doss & Morris, 2000). Taking 13 major grain producing regions in China as the research object, Deng et al. (2022) analysed the spatiotemporal correlation response of agricultural extensive level and agricultural transformation to grain production technology innovation. It was found that the comprehensive development of scientific and technological innovation showed a growing trend, and the level of coordinated development between the two systems significantly improved. However, there were differences in the development speed of each province. Herrero et al. (2020) evaluated the scope of innovation in grain production, land use and emissions, and improving food and waste management in the food system to assess the status of innovative technologies in grain production. In addition, under different agricultural management models, Luo et al. (2022) showed that farms will exhibit different technological advancements to match production factors and achieve optimal production conditions. Li and Lin (2023) found that the development and progress of green technologies in grain production should fully consider the resource endowment and economic development of different regions, as well as the applicability and adoption rate of green technologies.
Information agriculture based on digital technology is one of the forms of agricultural modernisation. The research on the impact of digital technology on agricultural (grain) production technology innovation mainly focuses on two directions: on the one hand, the use of advanced digital technologies such as the Internet of Things, big data, and remote sensing technology has optimised the allocation of existing production factors, and improved factor utilisation efficiency and agricultural productivity through technological progress (Tchamyou et al., 2019). On the other hand, the development and application of digital technology have made data a new factor of production, promoting the evolution of the order of production factors and the innovation of production methods (Thomas, 2006). The different allocation of production factors in various industries may be the reason for the differences in production efficiency between industries (Restuccia & Rogerson, 2008). The application of digital technology has added a new element — data element — to traditional agricultural production factors such as land, labour, and capital. As data enters the agricultural production function as a new element, various resource elements’ dependence and matching structures have fundamentally changed. Unlike traditional production factors, data elements have a marginal cost of 0 and are ‘non-competitive’. This means that data elements will not reduce the use of other industries or consume raw data due to the use of one industry (Goldfarb & Tucker, 2019). These characteristics of data elements enable them to reduce the average cost of agriculture and achieve strong economies of scale (Maurseth, 2018).
Data and information flow can be automated through digital technology, which creates a prerequisite for the automation technology of agricultural production. Data elements act on the entire process of agricultural production through real-time monitoring, real-time transmission, and scientific feedback, achieving precise allocation and continuous optimisation of various traditional resource elements, improving resource allocation and utilisation efficiency, and promoting the transformation of agricultural production from extensive to intensive (Nicholas, 1996). Digital technologies such as the Internet of Things and cloud computing improve the input structure of agricultural resource elements, strengthen the refined management of production processes, and achieve the goal of improving the efficiency of agricultural resource element allocation and reducing management costs in agricultural production processes (Yekimov et al., 2022). The non-competitiveness of digital technology can enable consumers and farmers in developing countries to access the same information as people in developed countries. Based on the non-competitive and non-exclusive characteristics of digital information, information technology can improve education in developing countries in the context of education (Kremer et al., 2013). Digital education is also expected to lead to a more equal distribution of educational resources (Acemoglu et al., 2014). Through digital technologies such as the Internet, farmers can access the latest agricultural production information and advanced agricultural production technologies, thereby accelerating the dissemination and application of new technologies and improving their production technology level.
Scholars have produced fruitful research results on digital technology and agricultural production, but the conclusions are inconsistent, and further research is still lacking. One is whether digital technology can improve the efficiency of grain production, and the other is to what extent digital technology impacts grain production efficiency. Few studies have used microdata for empirical analysis on these two issues. This article uses the 2022 survey data on farmers’ economic behaviour in Hubei Province, China to construct an analytical framework and indicator system for the impact of digital technology adoption on farmers’ grain production technology innovation. Regression and multiple linear regression models explore the relationship between digital technology adoption and farmers’ grain production technology innovation. The regression decomposition method calculates the degree of impact of digital technology adoption on farmers’ grain production technology innovation.
Theoretical analysis and research hypothesesTheoretical analysisAssume that the income per acre for farmers using old production techniques is R0, the number of land owned by farmers is A0, and the number of labour is L0. Now farmers are faced with a new production technology. This production technology is realised by combining three factors: land input A, innovative technology input K, and labour input L. The form of the production function is

This technology has the invariable nature of returns to scale; the production function per mu of this production technology can be changed to obtain the following:
q representing the yield per acre of new technology, the usage of innovative technology per acre, and the labour input per acre of production, respectively. The production function f satisfies fk>0, fkk>0, fl>0, fll>0, flk=fkl>0. Farmers pursue income maximisation by allocating the total land A0 to old and new technologies in A1 and A2, respectively. Under the condition that the labour force can flow, farmers engage in part-time production, with a portion of the labour force (L1) engaged in agricultural production and a portion of the labour force (L2) engaged in non agricultural production. The wage rate for agricultural production is ω1. The wage rate for non agricultural production is ω2, satisfying ω1<ω2.


Under the above initial condition, farmers are faced with the choice of A1 and A2, and the choice of the best innovative input k and labour input A1 after A2 to maximise income. p and c are recorded as the prices of products and inputs, respectively. Therefore, the optimisation problem for farmers is as follows:


This question is equivalent to:

Considering partial derivatives for A1, k, and l1, the following is obtained:


Eq. (10) indicates the requirements of farmers for the benefits of new technologies and the comparison of the benefits of new and old technologies under the condition of labour mobility. Considering Eqs. (10), (11), and (12), when available labour does not flow between two departments, the optimal input values for adopting new technologies are k* and l1*, and there is no difference in whether or not farmers adopt new technologies. Satisfying Eq. (10) yields no difference points (assuming no difference), and farmers adopt new technologies. Conversely, not adopting new technologies, as follows:

In this case, the output and production cost of adopting new technologies are as follows:
Research hypotheses

When a certain factor of production becomes scarce and causes a relative price increase or change, rational business entities will use other factors to replace the relatively scarce factors, thereby inducing the transformation and innovation of related technologies (Hellyer, 2019). Therefore, technological progress that replaces relatively scarce factors can eliminate the constraints of resource scarcity on economic growth. For the agricultural sector, the supply structure of agricultural production factors will change with the transfer of labour to non-agricultural sectors. Specifically, the price of labour factors will continue to rise relative to other factors. The rational choice of farmers is to use relatively inexpensive factors (such as data technology) to replace labour factors, thereby promoting the innovative development of agricultural production technology. For example, countries represented by the United States and Canada have abundant land resources but a shortage of labour resources, which has led to large-scale agricultural operations and mechanised development to improve labour productivity (Wolka et al., 2018); However, countries such as Japan and the Netherlands have relatively more people, less land, poor land resource endowments, and abundant labour resources, which mainly induce technological innovation such as biotechnology to improve land productivity (Abegaz, 2021).
The innovation caused by technological diffusion can promote industrial and technological progress, efficient allocation of production factors, and innovation in organisational and service models, thus generating economic and social benefits on a larger scale (Zhang &, Yan, 2022). The penetration and diffusion of new-generation information technologies, such as the Internet of Things, big data, blockchain, and artificial intelligence in the entire industrial chain of agricultural production, logistics, sales, and financial services, to name a few, promote the progress of agricultural production technology and optimise the allocation of production factors such as land, labour, capital, and information. They are continuously increasing the breadth and depth of farmers’ adoption of digital technology, improving agricultural production organisation models and service methods, and promoting agricultural production technology innovation. Production, processing, sales, and other independent and interrelated production and business together constitute an organic system for market entities to create value (Syahza et al., 2021). Therefore, innovation in agricultural production relies on integrating digital technology into all aspects of the entire agricultural industry chain, promoting its transformation, upgrading, and deep integration.
Generally, one can use the economic man hypothesis theory to explain the grain production behaviour of farmers. The proposal of the rational economic man hypothesis can be traced back to the economic theory of labour exchange proposed by the British economist Adam Smith. This theory believes that ‘self-interest’ is the motivation for human economic behaviour, and rational economic entities choose the optimal solution from all possible outcomes to make economic decisions out of the consideration of maximising their own interests. Rational economic men hope to exhaust the least possible cost or achieve the maximum gain. According to the Economic Man Hypothesis theory, farmers aim to maximise their own interests when making decisions on digital technology adoption in grain production, hoping to obtain the maximum possible benefits with the least amount of payment. The comparative benefits of grain production are low, planting costs are high, and production risks are high. Farmers are more likely to adopt digital technology to reduce production costs and improve production returns. This is the optimal economic decision made by farmers in pursuit of maximising benefits. Adopting digital technology provides individuals with diverse choices in production and lifestyle, directly changing their own paths in existing production behaviour and affecting grain production methods. Therefore, this article proposes the following research hypotheses.
Hypothesis 1 Under the premise that other conditions remain unchanged, adopting digital technology can improve the efficiency of grain production.
Hypothesis 2 Under the premise that other conditions remain unchanged, adopting digital technology has a greater impact on grain production efficiency than other factors.
The data used in this study is from a field survey conducted by the research group in Honghu City and Qichun County, Hubei Province, China, in 2022, targeting the economic behaviour of farmers. The survey mainly includes basic information on the population of farmers; a family's natural, social, financial, and material capital; land use situation, production and operation; and household income and expenditure.
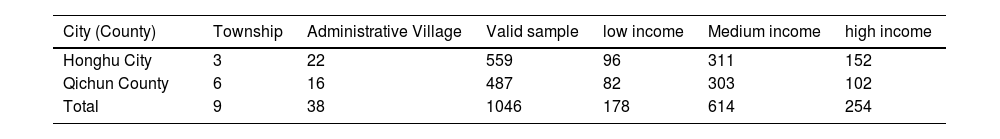
To ensure the representativeness of the survey samples, stratified and probabilistic random sampling methods were used to select the samples. Firstly, the sample cities and counties were identified. The research locations were Honghu City, Jingzhou City, Hubei Province, China and Qichun County, Huanggang City. The terrain of Qichun County is narrow and long, with high terrain in the north and low terrain in the south. The terrain is complex, with a mountainous area in the north, a hilly area in the middle, and a flat fan-enclosed area in the south. The altitude ranges from 12 metres to 1244.1 metres. The entire territory of Honghu is located in the Yangtze River floodplain, with a gently sloping terrain from northwest to southeast, forming a wide and flat terrain with high north-south and low middle. The altitude is mostly between 23 and 28 metres, and the agricultural land is 2.4872 million acres, accounting for 66.49 % of the land area of Honghu City. The agricultural planting area is wide. The terrain of the two regions includes plains, hills, and mountains, covering almost all the terrain of Hubei Province, which to some extent represents the agricultural planting status of Hubei Province. The second is to determine the sample towns. Based on the terrain distribution and economic development status of the sample cities and counties, three sample towns, Laowan Hui Township, Wulin Town, and Yanwo Town, were randomly selected in Honghu City. Six sample towns, Datong Town, Liuhe Town, Qizhou Town, Qingshi Town, Tanlin Town, and Zhulin Town, were randomly selected in Qichun County, and 9 sample towns were ultimately obtained. The third is to determine the sample village. Mainly considering the terrain conditions, economic development level, and distance from the town centre of each village, 2–9 sample villages were selected from each sample town, totalling 38 sample villages. Finally, sample farmers were selected. Each village randomly selected 30–40 households to conduct a survey, distributed 1100 questionnaires, and collected 1050 questionnaires. After removing missing data samples, 1046 valid samples were obtained.
Table 1 shows the distribution of samples. This paper also classifies rural households according to their income into three categories: low-income, middle-income, and high-income. Amongst them, farmers with per capita household income of less than 8000 yuan are low-income, those with per capita household income of 8000 yuan to 30,000 yuan are middle-income, and those with per capita household income of 30,000 yuan or more are high-income.
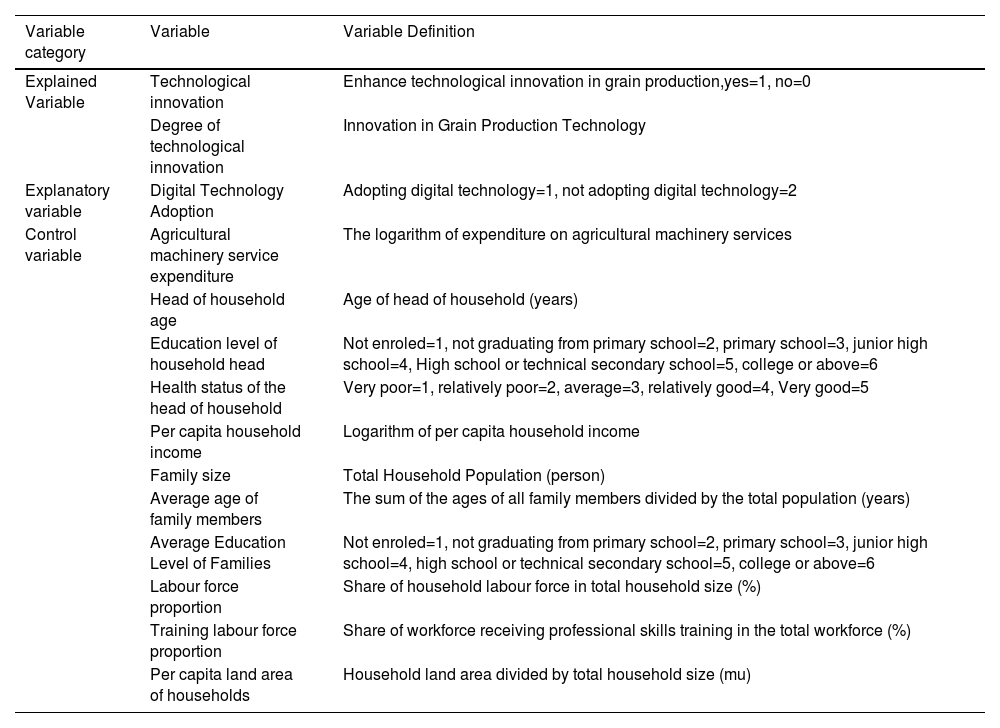
VariableTable 2 shows the explained variables are whether farmers promoted technological innovation in grain production and degree of technological innovation in grain production. Digital Technology Adoption were taken as the core explanatory variables. In addition, 11 control variables, including agricultural machinery service expenditure, age of the head of household, education level of the head of household, health status of the head of household, per capita income of the family, family size, average age of family members, average education level of the family, labour force proportion, training labour force proportion, and per capita land area of the family, were introduced.
Variables and meaning.
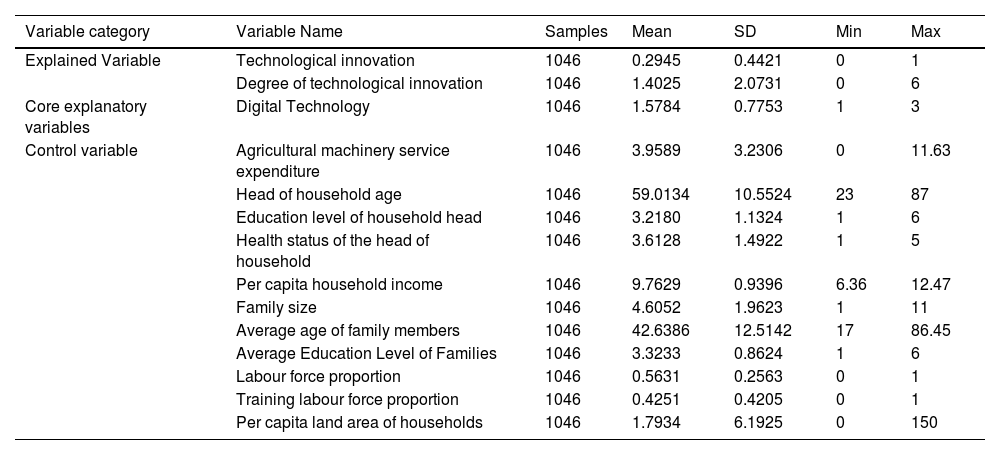
Table 3 shows descriptive statistics of the variables. Amongst the 1046 sample families, 29.45 % of farmers improve their grain production technology innovation. In the survey sample, most farmers spend less on agricultural machinery service, and the difference in agricultural machinery service expenditure is large. The average age of the head of household is 59 years old, and the overall health is relatively good. The average education level of household heads has not exceeded the nine-year compulsory education level. Most are concentrated in primary and junior middle schools, and their education level is still low. The per capita income of most of the rural households in the sample is at a moderate or high level. The average family size of the sample was 4.61, and the average age of the family members was 42.64 years old. The average educational level of households is 3.26, which does not exceed the nine-year compulsory education level, indicating that the educational level of rural households in the study area is low. The proportion of the labour force and the proportion of training labour force are 56.31 % and 42.51 % respectively, indicating that the coverage of skills training of the rural labour force in the study area is not high. The average per capita household land area was 1.98 mu, which is higher than the national per capita farmland area of 1.79 mu.
Descriptive statistics of variables.
Technological innovation in grain production is introduced as the explained variable to verify the research hypothesis of this paper. A core explanatory variable, data technology application, is introduced to ‘Is the Internet of Things, artificial intelligence, drones and other digital technologies used in production to improve the production management process and achieve precision production?’ to invert the variable. Based on control variables, including individual characteristics of household head, basic characteristics of the household, and household livelihood capital (human capital, natural capital, physical capital, social capital and financial capital), an analytical framework and index system of the relationship between digital technology and grain production were constructed. The first explained variable in this study is whether to improve the technological innovation of grain production Y1, assuming that the technological innovation of grain production is 1, and the technological innovation of grain production is 0. The dependent variables are 0 and 1, and the model is binomial Logistic. Therefore, the Logistic model form for studying the impact of digital technology on grain production is:

In the above formula, Pi is the probability of technological innovation improvement of the I-th household grain production; X1i is the core variable, the rest is the control variable, α, β1, β2,… β18 is the variable to be estimated, and ɛi is the disturbance variable. The second explained variable in this study is grain production technological innovation Y2, and the multiple linear regression model is constructed as follows:

In the above formula, Y2 is the explained variable, X1 is the core variable, and the rest are the control variables. α, β1, β2,… β18 is the variable to be estimated, and ε is the disturbance variable.
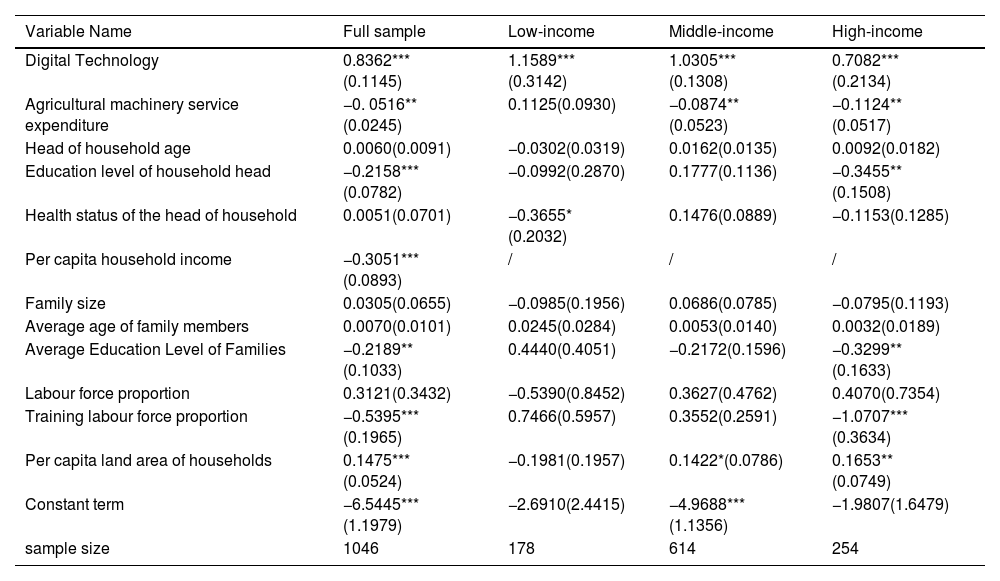
Analysis of empirical resultsBinomial logistic regression resultsTable 4 shows the results of binomial Logistic full sample regression and income-based sub-sample regression of digital technology and control variables on technological innovation improvement of grain production. In the full sample regression results, the regression coefficient of the core explanatory variable digital technology on the improvement of grain production technology innovation is 0. 8362, which is significantly positive at the 1 % statistical level, indicating that digital technology has a significant improvement effect on grain production technology innovation, and hypothesis 1 has been verified. Amongst the control variables of the whole sample, the regression coefficient of agricultural machinery service expenditure on grain production technology innovation is −0.0516, which is significantly negative at the 5 % level, indicating that farmers with more agricultural machinery service expenditure have less probability of improving grain production technology innovation, and the technical effect of agricultural machinery technology has been verified. The age of the head of household and the health status of the head of household do not have a significant effect on the improvement of technological innovation in grain production, indicating that the improvement of technological innovation in grain production has no strong correlation with the age and labour ability of the head of household. The education level of the household head, the average education level of the household and the proportion of trained labour force have a significant negative impact on the improvement of grain production technology innovation. The possible explanation is that farmers with higher education levels have higher insights and visions, a better ability to optimise the allocation of household production factors, and higher agricultural production efficiency. If farmers receive agricultural skills training, their agricultural production skills will be enhanced, positively impacting agricultural production efficiency. The per capita household land area positively impacts the improvement of grain production technology innovation, which may be due to the large and scattered land and the imperfect land transfer system, which can not be completely transferred and rationally utilised.
Binomial Logistic regression results and sub sample regression results.
Note: * * *, * * and * respectively indicate significant at the 1 %, 5 %, and 10 % statistical levels; The numbers in parentheses represent robust standard error; '/' indicates missing.
According to the regression results of the sub-samples of low-income, middle-income, and high-income households in the table, digital technology has a significant positive impact on the technological innovation of grain production in the three types of household samples. Amongst them, low-income households’ digital technology has the most significant impact on grain production technology innovation, and high-income households’ grain production technology innovation is least affected by digital technology. In low-income households, the impact of agricultural machinery service expenditure on grain production technology innovation is not significant, which may be due to the small production scale of low-income farmers, the small demand for agricultural machinery services, and the small technical effect of agricultural machinery technology on low-income households. In the sample of middle-income and high-income households, the expenditure on agricultural machinery services has a significant negative impact on the technological innovation of grain production at the level of 5 %. The resource endowment of middle-income and high-income farmers is better than that of low-income farmers, the scale of agricultural production is relatively large, and the demand for agricultural machinery services is also large. The use of agricultural machinery services improves agricultural production efficiency. In summary, if other conditions remain unchanged, farmers’ technological innovation in grain production is significantly different with the difference in the degree of adoption of digital technology, and the adoption of data technology can improve technological innovation in grain production. Simultaneously, the expenditure of household agricultural machinery services, the education level of the household head, the average education level of the household, the proportion of trained labour force, the per capita income of the household and the per capita land area all have an impact on the technological innovation of grain production to a certain extent.
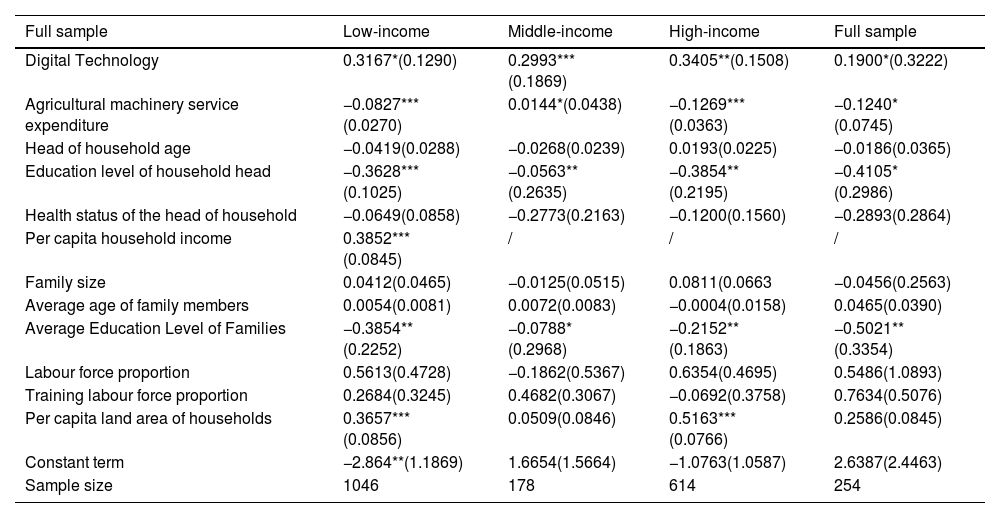
Multiple linear regression resultsTable 5 shows the results of multiple linear full sample regression and income-based sub-sample regression of digital technology, control variables and technological innovation in grain production. In the whole sample, the regression coefficient of digital technology on grain production technology innovation is 0.3167, which is statistically significant at the 10 % level, indicating that the larger the grain production technology innovation of farmers adopting digital technology. Thus, hypothesis 2 is verified. In the control variables of the whole sample, the regression coefficient of agricultural machinery service expenditure on grain production technology innovation is −0.0827, which is significantly negative at the level of 1 %, indicating that farmers with more agricultural machinery service expenditure will have less grain production technology innovation, and the technical effect of agricultural machinery technology has been verified. The age of the head of household and the health status of the head of household had no significant influence on the technological innovation of grain production, indicating that the technological innovation of grain production had no strong correlation with the age and labour ability of the head of household. There is a significant negative correlation between the education level of the head of household and the average education level of the family and the technological innovation of grain production. The possible explanation is that farmers with higher education levels have higher insights and visions, stronger ability to optimise the allocation of household production factors, higher agricultural production efficiencies, and greater use of land resources. The per capita household land area has a significant positive impact on the technological innovation of grain production, possibly due to the large and scattered land and the imperfect land transfer system.
Multiple linear regression results and sub sample regression results.
Note: * * *, * * and * respectively indicate significant at the 1 %, 5 %, and 10 % statistical levels; The numbers in parentheses represent robust standard error.
According to the regression results of the sub-samples of low-income, middle-income, and high-income households in the table, digital technology has a significant positive impact on the technological innovation of grain production in the three types of household samples. Amongst low-income households, agricultural machinery service expenditure significantly correlates with technological innovation in grain production. The reason may be that low-income farmers have small production scale and poor natural resource endowments, and it is difficult for agricultural machinery technology to produce scale effects on their agricultural production, thus reducing technological innovation in grain production. In the samples of middle-income and high-income households, agricultural machinery service expenditure has a significant negative impact on the technological innovation of grain production. The possible explanation is that middle-income and high-income farmers have better resource endowments than low-income farmers, relatively large-scale agricultural production, and greater demand for agricultural machinery services. The use of agricultural machinery services improves agricultural production efficiency to encourage greater use of land.
In summary, other conditions remaining unchanged, the higher the degree of digital technology adoption, the higher the technological innovation in grain production. Simultaneously, the agricultural machinery service expenditure, the education level of the household head, the per capita income of the household, the average education level of the household, the per capita land area of the household and other factors will have an impact on the technological innovation of grain production to some extent.
Robustness testTo ensure the robustness of the research hypothesis in this paper, a Tobit regression model was constructed to analyse the index system mentioned above. The Tobit regression model is as follows:

In the above formula, Y represents the technological innovation of grain production and whether the technological innovation of grain production is improved, Xi represents the digital technology; control is a series of control variables; and a and ɛi represent constant and random disturbance terms, respectively.
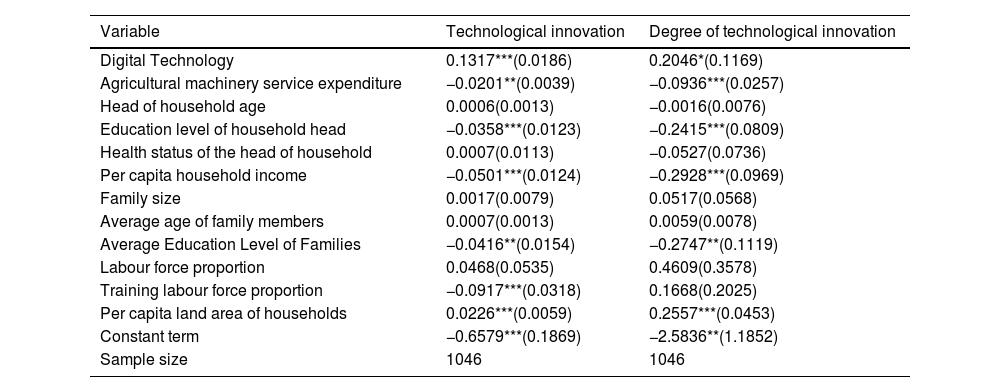
The regression results are shown in Table 6 below. Digital technology has a significant positive impact on the technological innovation of grain production at the statistical level of 1 %; that is, farmers who adopt digital technology have improved the technological innovation of grain production, which again verifies the research hypothesis 1. There is a significant positive correlation between digital technology and grain production technology innovation at the level of 10 %, and the higher the adoption of digital technology, the higher the grain production technology innovation, which again verifies the research hypothesis 2. Tobit regression verifies the hypothesis again, and the conclusion is robust.
Tobit estimation results of digital technology on technological innovation.
Note: * * *, * * and * respectively indicate significant at the 1 %, 5 %, and 10 % statistical levels; The numbers in parentheses represent robust standard error.
The above model parameter estimation results only test the impact of digital technology on technological innovation of grain production, and the specific contribution rate of digital technology on technological innovation of grain production, which factors are the key factors affecting technological innovation of grain production, and the degree of barrier effect, income effect and technological effect of digital technology on technological innovation of grain production. These need to be measured further. Based on the estimation results of models 1 and 2, the regression decomposition method improved by Wan (2002) was used to estimate the contribution rate of each variable to the technological innovation of grain production. Specific calculation methods and models are as follows:

Amongst them, Vulirepresents the grain production efficiency of farmers, α represents a constant term, Xi represents an explanatory variable, and ɛi represents a residual term. After estimating the parameters of Eq. (4), the estimated value of βi is obtained, and then the estimated value Vuli of Vi^ and the estimated value Vi^′ of Vuli without considering the constant term is calculated, namely:


Then, regression decomposition is performed in the following. Step 1: Use CV(*)to represent the coefficient of variation and calculate the contributions of residual and constant terms to Vuli, Cɛ and Cα:


Step 2: Calculate the contribution of each variable to CV(V^). The contribution of each variable to CV(V^) can be calculated using the Sharply valued theoretical decomposition proposed by Shorrocks (2013). Generally, different farmers have different values for x, and replacing x with the sample mean of Xi can eliminate the difference in Xi. The calculated V value after replacement is denoted as Vi (excluding constant terms), thus obtaining the coefficient of variation CV(V), which depends on the difference after x eliminates Xi. Similarly, replacing Xi and Xj with the sample mean of Xi and XJ can eliminate the difference between Xi and Xj. The calculated V value after replacement is denoted as Vi, resulting in the coefficient of variation CV(V). Through analogy, more differences in X can be eliminated.
Using Cimm to represent the n contribution of variable i to the coefficient of variation in the m order, the calculation formulas for each time are as follows:


The contribution of variable i to the coefficient of variation at the m th time is:


In Eq. (27), Cim represents the contribution of variable i to the coefficient of variation at the m time. The contribution of variable i to the difference in the impact of technological innovation on grain production is as follows:

Step 3: Calculate the contribution rate of each variable to the technological innovation of grain production.


Where CDɛ, CDα, and CDi represent the contribution rates of residual term, constant term, and variables to the difference of technological innovation in grain production, respectively.
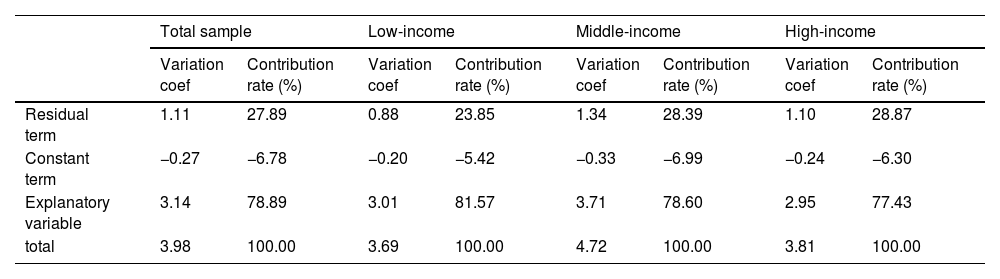
Table 7 shows the contribution rates of residual term, constant term, and explanatory variables to technological innovation in grain production. Although the regression decomposition method cannot identify the contribution of unincluded explanatory variables, these unidentified variables can be reflected in the residual term. In this paper, the contribution rate of the residual term to the technological innovation of grain production is 27.89 %, and the contribution rate of explanatory variables to the technological innovation of grain production is 78.89 %. According to the sample data of different groups, the contribution rates of residuals and explanatory variables to the impact of technological innovation on grain production are roughly the same: the contribution rates of residuals and explanatory variables to the impact of technological innovation on grain production of low-income households are 23.85 % and 81.57 %, respectively. The contribution rates of residuals and explanatory variables to the impact of technological innovation on grain production were 28.39 % and 78.60 %, respectively. The contribution rates of residuals and explanatory variables to the impact of technological innovation in grain production of high-income households are 28.87 % and 77.43 %, respectively. Therefore, even if unobservable factors are not included in the regression model, the explanatory variables selected in this paper can still explain the impact of technological innovation on grain production to a large extent.
Contribution rates of residual terms, constant terms, and explanatory variables to technological innovation of grain production.
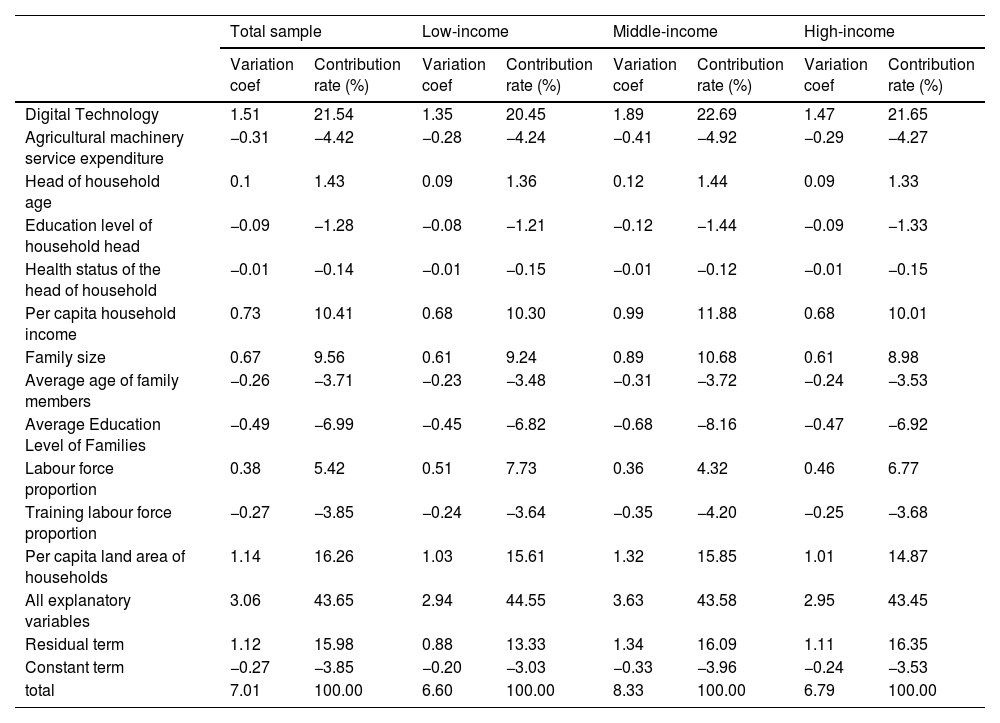
Further, the regression decomposition method is used to estimate the contribution rate of each explanatory variable to the impact of technological innovation on grain production, and the results are shown in Table 8. It is not difficult to identify in Table 8 that amongst all factors, digital technology contributes the most to the impact of technological innovation on grain production, reaching 21.54 %. The results of subgroup samples showed that the contribution rate of digital technology in low-income, middle-income and high-income households to the impact of technological innovation in rural grain production was 20.45 %, 22.69 %, and 21.65 %, respectively. Amongst all explanatory variables in each group of samples, the contribution rate of digital technology on the impact of technological innovation in grain production was the largest. This further validates the conclusion that digital technology is the main factor affecting technological innovation in grain production. In addition to digital technology, other factors have a more significant impact on grain production technology innovation, amongst which is the contribution rate of per capita household land area to the impact of grain production technology innovation reached 43.65 %, second only to digital technology. Simultaneously, the family's per capita net income, the family's size, the family's average education level, and the proportion of the labour force also affect the technological innovation of grain production to a certain extent. Agricultural machinery service expenditure, age of the household head, education level of the household head, average age of family members, average education level of the household, and the proportion of trained labour force have negative contribution rates to the impact of technological innovation in grain production, indicating that these factors hinder technological innovation in grain production and can promote the effective use of land. The results of grouped samples also support this finding.
Contribution of each explanatory variable to grain production efficiency.
This article utilises the economic behaviour data of farmers in Hubei Province, China, in 2022, with grain production technology innovation as the explanatory variable and digital technology adoption as the core variable. Relevant control variables are introduced, and an analytical framework and indicator system are constructed to assess the impact of digital technology adoption on grain production technology innovation. Descriptive statistical methods are used to organise and analyse household data, binomial logistic regression models and multiple linear regression models are used to explore the impact of digital technology on technological innovation in grain production, Tobit regression models are used for robustness testing, and regression decomposition methods are used to measure the contribution of each variable to the impact of technological innovation in grain production.
Compared with similar studies, the marginal contributions of this article are as follows: Firstly, existing research focuses more on the impact of digital technology on the spatial distribution, dynamics, and agricultural production layout of cultivated land, and there is limited quantitative and systematic research on the correlation between digital technology and innovation in grain production technology. This study specifically analyse the impact of digital technology on technological innovation in grain production to provide new ideas for improving technological innovation in grain production and optimising agricultural policies. Secondly, existing research on the impact of digital technology on technological innovation in grain production mostly utilises geographic information technology to statistically analyse the dynamic changes in regional cultivated land area, and there is less statistical analyse of farmers’ technological innovation behaviour in grain production. This study uses field survey data on the economic behaviour of farmers in Hubei Province in 2022 for empirical analysis. Thirdly, existing research on the impact of digital technology on technological innovation in grain production mainly focuses on analysing whether digital technology has an impact on technological innovation in grain production, and there is relatively little research on the degree of its impact. Based on empirical analysis of the impact of digital technology on technological innovation in grain production, this article uses the regression decomposition method to measure the degree of impact of digital technology on technological innovation in grain production.
This study also has certain shortcomings. Firstly, due to limitations in the field research area and data, the correlation between digital technology and farmers’ innovative behaviour in grain production technology in other regions has not been fully considered, and the research results have a certain regional significance. Secondly, due to research conditions and technological limitations, digital technology data could not be accurately classified into specific categories, nor could digital technology analysis be accurately described as technical features. This can be supplemented in future research to form a more accurate research system.
Conclusion and recommendationConclusionThe adoption of digital technology has a significant impact on technological innovation in grain production, and the adoption of digital technology can enhance the level of innovation in grain production. This article's descriptive statistical analysis and empirical analysis support this conclusion. It can be seen that the adoption of digital technology has a significant driving effect on the innovation of grain production technology. It is necessary to further promote the digital adoption level of grain planting farmers to enhance the innovation of grain production technology and ensure the stability of global grain production. Meanwhile, this research also found that different income types of households have differences, and the adoption of digital technology has the greatest impact on the innovation of grain production technology for low-income farmers, followed by middle-income households and a minor impact on high-income farmers. Therefore, how to promote the digital adoption of low-income farmers is the focus of future digital technology promotion. Essentially, innovation in grain production technology is the result of multiple factors such as digital technology, agricultural machinery and technology promotion, farmers’ income, and skill training. This article further demonstrates the impact of digital technology adoption on technological innovation in grain production. The results of the regression decomposition method show that digital technology is the main factor affecting technological innovation in grain production. The application of digital technology in grain production has significantly improved technological innovation. Additionally, the barriers and limitations of digital technology on innovation in grain production technology can be overcome by improving the level of agricultural machinery services and promoting agricultural technology training. It is necessary to attach importance to the adoption of digital technology and take diversified measures to enhance the innovation level of grain production technology and to improve the innovation level of grain production technology amongst farmers.
RecommendationChina is a major agricultural country, and grain production is an important part of agriculture. However, with the rapid development of China's economy and the acceleration of industrialisation and urbanisation, digital technology has promoted increased grain production. Innovation in grain production technology has become an important means to improve grain production. It is particularly important to analyse the impact and mechanism of digital technology on innovation in grain production technology to promote the effective utilisation of digital technology and improve the efficiency of grain production. This study empirically analyse the impact of digital technology on technological innovation in grain production, which can provide some beneficial insights for improving the application level of digital technology, improving grain production systems, and optimising agricultural policies, as shown below:
In recent years, the importance of data technology in various industries has become increasingly evident. One sector that significantly benefits from the advancements in data technology is grain production. With the increasing global population and the need to ensure food security, data technology has played a pivotal role in improving grain production efficiency, productivity, and sustainability.
One of the critical aspects where data technology significantly impacted is precision agriculture. Precision agriculture involves using data-driven tools and technologies to optimise crop production. Farmers can monitor the health and growth of their crops through satellite imagery, drones, and sensors in real-time. This data allows them to make informed decisions regarding irrigation, fertilisation, and pest control, leading to better yields and cost savings.
Data technology also enables farmers to utilise predictive analytics to anticipate potential issues and make proactive decisions. Farmers can predict crop diseases, yield fluctuations, and market demand by analysing historical data, weather patterns, and soil conditions. This helps them manage risks, plan for contingencies, and maximise profitability. Moreover, data technology allows for optimal resource allocation, ensuring that inputs such as water, fertilisers, and pesticides are used efficiently, reducing waste and environmental impact.
The importance of data technology in grain production is further highlighted by the concept of smart farming. Smart farming combines various data-driven technologies, such as artificial intelligence, Internet of Things (IoT), and robotics, to create an interconnected and automated farming system. This allows for real-time monitoring, decision-making, and control of farming operations, leading to increased efficiency, reduced labour costs, and improved productivity.
In conclusion, data technology has significantly enhanced grain production by enabling precision agriculture, predictive analytics, supply chain management, research and development, and smart farming. The use of data-driven tools and technologies has revolutionised how farmers approach grain production, leading to increased efficiency, improved productivity, and sustainable practices. As the global population continues to grow, the importance of data technology in ensuring food security and meeting the demands for grain production cannot be overstated.
CRediT authorship contribution statementWei Wang: Writing – review & editing, Writing – original draft, Resources, Methodology, Funding acquisition, Formal analysis, Conceptualization. Zeng Huang: Validation, Project administration, Methodology, Formal analysis. Zhuoying Fu: Visualization, Project administration, Investigation, Data curation. Lu Jia: Supervision, Resources, Project administration, Investigation. Qinghai Li: Visualization, Validation, Supervision, Resources, Data curation. Jiahao Song: Writing – original draft, Visualization, Validation, Formal analysis, Data curation, Conceptualization.
Supported by Sichuan Provincial Social Science Fund [Grant number 23GL262], Chengdu Philosophy and Social Science Planning Project [Grant number 2023BS028], Sichuan Provincial Social Science Foundation Major Project [Grant number SCJJ23ND05] and Sichuan Province Philosophy and Social Science Planning Major Project [Grant number SC22ZDYC09].