


Edited by: Abbas Mardari
More info
This century's biggest challenges include boosting urban air quality, halting climate change, ensuring energy security and mitigating human health issues associated with air pollution. The transportation industry certainly contributes to these issues (Fan et al., 2018). The Intergovernmental Panel on Climate Change reported (Intergovernmental Panel on Climate Change, 2015) that 14% of global greenhouse gas emissions resulted from the transportation industry. According to the World Health Organization (Health Organization, 2016), urban air pollution is responsible for 3 million deaths and 85 million disabilities. The governments identified electric vehicle (EV) diffusion as a potential solution to these issues (He & Wang, 2022; Khan et al., 2020; Liao et al., 2017). Consideration must be given to the fact that transportation systems are multidimensional and that their problems emerge from their underlying structure.
This multidimensionality relates to the various parties and their objectives and interests in the transportation system, as well as the different sectors involved (Lopez-Arboleda et al., 2019). These parties can be categorised according to their role in the transportation industry and the diffusion process of EVs into the supply and demand sides. On the supply side of the market, vehicle producers, fuel distributors, fuel producers and vehicle dealers who offer fuels, vehicles and technical services are included. On the demand side of the market, consumers who require technical services, fuels, vehicles and infrastructure are involved. Furthermore, governmental actors develop regulations and policies to manage the relationships between the supply and demand sides and to encourage a certain technology or behaviour based on the political agenda of each nation (Kanger et al., 2019; Trencher, 2020).
In recent years, increasing emphasis has been placed on modelling the integration of the supply–demand and sustainability in the context of Industry 5.0 interactions for the passenger EV diffusion. The concept of sustainable development was defined as the “development that meets the needs of the present without compromising the ability of future generations to meet their own needs. While the social- and human-related issues are an integral part of this concept, they are merely discussed within human-centricity in the context of Industry 5.0″ (Jafari et al., 2022). In terms of supply–demand interactions, the criteria that consumers use to select a technology for purchase must be evaluated, and the diffusion process defines the options of several consumers. In addition, most studies focused on sustainability in the context of Industry 5.0 as an endpoint indicator rather than analysing how this indicator interacted with the transportation system (supply–demand) or how it interacted with other sustainability factors in the context of Industry 5.0 (e.g. economic, environmental and social) (Kanger et al., 2019; Kieckhäfer et al., 2017; Onat et al., 2017; Sen et al., 2017; Shafiei et al., 2018; Trencher, 2020).
The literature identifies multiple approaches to modelling the system in an integrative manner. However, most of these approaches do not account for the connection between the sustainability factors in the context of Industry 5.0, which may affect the evaluation's performance (Fraga-Lamas et al., 2021; Maddikunta et al., 2022; Yuan et al., 2017). The integrated sustainable transportation modelling approaches (ISTMA) for electronic passenger vehicle (EPV) can be evaluated and benchmarked to identify the most and least sustainable in the context of Industry 5.0 approaches. Thus, further investigation is required to identify the research gap, challenges and issues associated with evaluating and benchmarking ISTMA for EPV in the literature.
This paper is structured as follows: Section 2 includes related work, including two aspects: research gap, challenge and issues and theory justifications. Section 3 presents the research methodology used to evaluate and benchmark ISTMA for EPV. Section 4 provides the discussion and results. Section 5 presents the evaluation and validation of the proposed method using sensitivity and comparison analyses. Section 6 presents the conclusions and future work.
Related workThe related work is discussed in two subsections. Section 2.1 highlights the research gap, challenges and issues Section 2.2 discusses the theory justifications.
Research gap, challenge and issuesThe evaluation and benchmarking ISTMA for EPV to identify the most and least sustainable in the context of Industry 5.0 approaches is challenging because of the multidimensionality of the available criteria (Abubakar et al., 2019; Guaita Martínez et al., 2019; Yue, 2022). Many ISTMAs for EPV exist in the literature such as (Kieckhäfer et al., 2017; Onat et al., 2017; Sen et al., 2017; Shafiei et al., 2018). However, no superior ISTMA for EPV simultaneously meets all the necessary criteria, including the performance indicators for sustainable transportation Industry 5.0. Therefore, Evaluating the existing ISTMAs for EPV from a single vantage point would be inappropriate. To fill this research gap, four evaluation issues must be addressed (Alamoodi et al., 2022a, 2022b; Albahri et al., 2022a; Krishnan et al., 2021):
- (i)
Different evaluation criteria exist for evaluating and benchmarking ISTMAs for EPV because they indicate the ISTMAs’ for EPV sustainability in the context of Industry 5.0. For instance, the three main criteria (Supply Side (SS), Demand Side (DS), and Sustainability (Sus)) of ISTMAs for EPV are measured by sub levels of criteria supportive industry 5.0. The DS criterion is measured by the first level of criteria (consumer modelling (CM) and market share (MS)); CM criterion is measured by second level of criteria (financial attributes (FAttributes), technological attributes (TechAttributes), and FAvailability); FAttributes and TechAttributes criteria are measured by the third level of criteria (price, fuel cost (FCost) maintenance cost (MCost), and battery cost (BCost)) and (range, environmental performance (EPerformance) and vehicle performance (VPerformance)). This example shows the complexity of evaluating the ISTMAs for EPV based on one of the main criteria.
- (ii)
The priorities of these criteria are varied and should be considered.
- (iii)
The presence of several levels of criteria diminishes the weight of criteria with sub-criteria. For instance, when the CM and MS weight values are 0.5093 and 0.4907, respectively. The weight of CM (0.5093) will be divided amongst the three criteria of CM (i.e. FAttributes, TechAttributes, and FAvailability), and the weight values will be further divided on the sublevel of FAttributes and TechAttributes. At the end of this procedure, the benchmarking of ISTMAs for EPV will be determined by the actual weight value of MS and the tiny weight values of the criteria at the final level of CM, which are deemed unreasonable.
- (iv)
The ISTMAs’ for EPV performance evaluation is influenced by trade-offs amongst the evaluation criteria in the context of Industry 5.0. For example, increasing the economic criterion is a logical consequence of improving the environmental criterion.
- (v)
Another issue that needs to be considered whilst evaluating the ISTMAs for EPV is the variance in data. A change in one criterion may affect the value of others.
Therefore, finding the most and least sustainable ISTMAs for EPV in the context of Industry 5.0 is a challenging multicriteria decision-making (MCDM) problem. Scholars have developed a range of MCDM techniques for determining the optimal alternative. Therefore, an MCDM method is necessary to bridge this gap and solve the complexity of the problem.
Theory justificationsThe origins of MCDM can be traced back to operations research, which covers a wide range of methods and applications in fields, such as healthcare, education, transportation, management, investment, environment, immigration and military. Multiple MCDM ranking methods, including ELECTRE, TOPSIS and VIKOR, have been applied in the literature. In contrast, the multiplicative multi-objective optimisation by ratio analysis (MULTIMOORA) is superior to these methods (Hafezalkotob et al., 2019). In addition, MULTIMOORA is more straightforward and stable than ELECTRE, TOPSIS and VIKOR. It also demands the least amount of processing time and mathematical calculations (Brauers & Zavadskas, 2012). Nevertheless, MULTIMOORA must be integrated with another MCDM weighting method to prioritize the list of the criteria. To obtain such outcomes, AHP, BWM and ANP are employed in the literature. The main limitation of these methods is the inconsistency that resulted from pairwise comparisons.
Recently, Ref. Mohammed et al. (2022) proposed the fuzzy-weighted zero-inconsistency (FWZIC) method to overcome this limitation. However, the original version of FWZIC was extended under triangular fuzzy environment, which could not manage the ambiguity, uncertainty and vagueness of information that resulted from the uncertainty of experts adequately. Later, FWZIC has been integrated with cubic Pythagorean fuzzy sets (Alamoodi et al., 2022a), neutrosophic fuzzy sets (Alamoodi et al., 2022b), interval type 2 trapezoidal‐fuzzy sets (Krishnan et al., 2021), Pythagorean fuzzy sets (Albahri et al., 2022b), q-rung orthopair fuzzy sets (Albahri et al., 2022c), Pythagorean m-Polar Fuzzy sets (Albahri et al., 2022b), spherical fuzzy sets (Qahtan et al., 2022), T-spherical fuzzy sets (Alsalem et al., 2021) and dual-hesitant fuzzy sets (Al-Humairi et al., 2022) to address these issues. Despite all these remarkable efforts, the ambiguity, uncertainty and vagueness of information still open issues.
Acquiring sufficient and reliable data for practical decision making is challenging due to the extreme ambiguity, uncertainty and vagueness of information. Consequently, dealing with these issues in actual decision-making processes is vital. Fuzzy set theory (Zadeh, 1965) stands out for this purpose and has been widely adopted in many areas. Hesitant fuzzy set (HFS) (Torra, 2010) is a promising addition to the traditional fuzzy set that enhances MCDM by managing uncertainty efficiently. Rodríguez et al. (2014) conducted a comprehensive review on HFS. Evidently, the review shows that (i) HFS is a generic and more flexible preference structure with the potential to reduce uncertainty; (ii) HFS also facilitates the preference elicitation of experts; (iii) it gradually showed up the serious loss of information, and (iv) the probability of each element's occurrence is ignored. In 2014, Zhu (2014) proposed probabilistic hesitant fuzzy set (P-HFS) that added the probability into the HFS. This innovative research could address the shortcoming of HFSs successfully. In addition, P-HFS not only permits many perspectives but also assigns an occurrence probability to each perspective, thereby increasing the information's reliability (Zhang et al., 2017). Later, Zhang (2014) examined several P-HFS operations and provided MCDM with their application. Zhang et al. (2017) improved the definition of P-HFS and proposed some P-HFS properties and operations. All these research bring the study of P-HFS to a new level. Therefore, we are inspired to extend FWZIC with the P-HFS in this study to overcome the aforementioned issues. Furthermore, motivated by the research challenges, the main objective contributes by proposing a feed-forward and backward procedures to benchmark the ISTMAs for EPV in the context of Industry 5.0 based on the extension of probabilistic hesitant fuzzy set and multi criteria decision making. Several novel contributions have been made as follows.
- 1.
This study established decision matrices based on the intersection of the sub-levels of criteria with ISTMAs for EPV using FFDP and BSP procedures in the context of Industry 5.0.
- 2.
This study established a scoring decision matrix based on the intersection between the sustainability and other main criteria with ISTMAs for EPV in the context of Industry 5.0 on the basis of the established DMs.
- 3.
This study extended FWZIC method with the P-HFS, hereafter called P-H-FWZIC, to accomplish multiple functions, including the evaluation of MS criterion and weighting the criteria.
- 4.
This study utilized the MULTIMOORA method to accomplish multiple functions, including the establishing of scoring decision matrix and the benchmarking of ISTMAs for EPV in the context of Industry 5.0.
- 5.
This study proposes a novel ISTMAs for EPV benchmarking in the context of Industry 5.0 based on the established scoring decision matrix by employing MULTIMOORA and P-H-FWZIC methods.
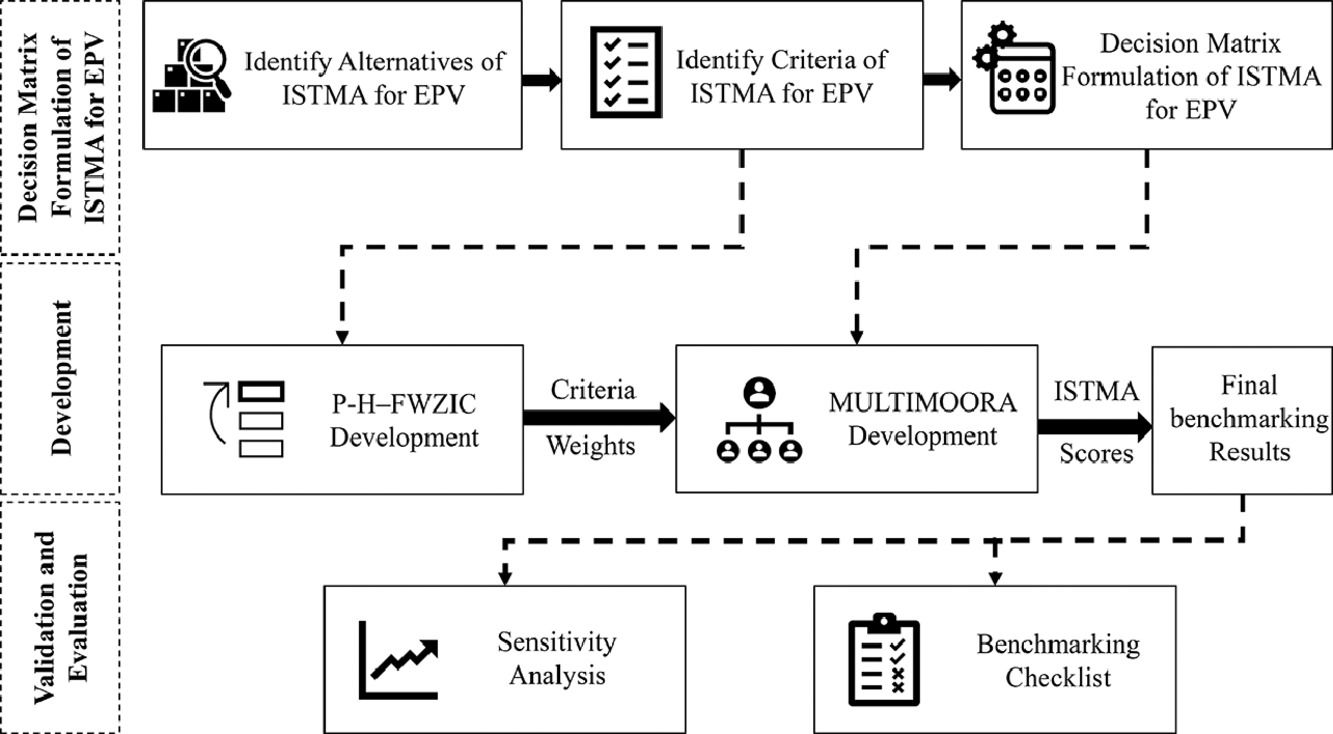
In this section, ISTMAs for EPV benchmarking that integrate P-H-FWZIC and MULTIMOORA methods-based decision matrices formulation of ISTMA for EPV in the context of Industry 5.0 is presented. After identifying the ISTMA for EPV alternatives and evaluation criteria, as well as formulating the ISTMA for EPV decision matrix, the P-H-FWZIC is initially used to determine the weight of the evaluation criteria as the main function. Then, the MULTIMOORA method is utilised to determine the ISTMAs for EPV that is the most sustainable as the main function. The proposed methodology consists of two main stages (ISTMA for EPV decision matrix formulation and development) in the context of Industry 5.0, which will be explained as follows.
Stage I: decision matrix formulation of ISTMA for EPV in the context of industry 5.0This stage includes three primary steps:
Step 1: An alternative list of ISTMA is identified and defined for EPV. In this regard, 11 ISTMAs for EPV are identified (Lopez-Arboleda et al., 2019).
Step 2: The evaluation criteria list of ISTMA for EPV in the context of Industry 5.0 is identified and defined based on the systematic review conducted by Lopez-Arboleda et al. (2019). In this context, three main criteria are used to evaluate the identified ISTMA, namely, SS, DS and Sus. The SS consists of two levels of criteria; the first level has the FS and VS criteria; the second level has research and development (R&D), fuel produced (FProd), fuel production cost (FpCost), fuel demand (FDemand), fuel price (FCost) and fuel availability (FAvailability) under FS criterion; and R&D, quantity produced (QProd), vehicle production cost (VpCost), vehicle technical attributes (TecAtt), dealer cost (DCost), expected demand (EDemand), Sales, and retail price (RPrice) under VS criterion. The DS consists of three levels of criteria; the first level has the CM and MS criteria; the second level has FAttributes, TechAttributes, and FAvailability under CM criterion; the third level had price, FCost, MCost, and BCost under FAttributes criterion; and range, EPerformance, and VPerformance under TechAttributes criterion. Finally, The Sus consists of two levels of criteria; the first level has the economic (ECO), environmental (ENV), and social (SOC); the second level has market share composition (MSC), fuel consumption (FC), total cost (TC), gross domestic product (GDP), and environmental damage cost (EDC) under ECO criterion; and energy use (Euse), using GHG emission (GHG use), using VOC emission (VOC use), using PM emission (PM use), using NOx emission (NOX use), production GHG emission (GHG Prod), production VOC emission (VOC Prod), production PM emission (PM Prod), production NOx emission (NOX Prod), and water footprint (WF) under ENV criterion. Fig. 1 depicts the structure of the identified criteria.
Step 3: The decision matrices (DMs) of ISTMA for EPV in the context of Industry 5.0 are derived from the crossover of the identified alternative list (Step 1) and their evaluation criteria (Step 2). The feed-forward data presentation (FFDP) of the first main criterion (SS) is presented by FS and VS (see Fig. 1). The FFDPs of FS and VS are presented by (R&D, FProd, FpCost, FDemand, FCost, and FAvailability) and (R&D, QProd, VpCost, TecAtt, DCost, EDemand, Sales, and RPrice), respectively. The FFDP of the second main criterion (DS) is presented by CM and MS. The FFDP of CM is presented by FAttributes, TechAttributes and FAvailability, whilst the FFDPs of FAttributes and TechAttributes are presented by (price, FCost, MCost, and BCost) and (range, EPerformance and VPerformance), respectively. Finally, the FFDP of the third main criterion (Sus) is presented by ECO, ENV and SOC. Similarly, the FFDPs of ECO and ENV are presented by (MSC, FC, TC, GDP and EDC) and (Euse, GHG use, VOC use, PM use, NOX use, GHG Prod, VOC Prod, PM Prod, NOX Prod and WF), respectively. Table A.1 in the appendix presents the DMs of ISTMA for EPV.

In the following stage, the identified criteria of the ISTMA for EPV in the context of Industry 5.0 are firstly weighted as the main function using the proposed P-H–FWZIC. These weights and the formulated DMs are fed to MULTIMOORA method to benchmark the ISTMAs and determine the most sustainable one for EPV as the main function.
Stage II: development and integrationThe evaluation and benchmarking of the ISTMA for EPV in the context of Industry 5.0 is accomplished by the novel integration of weighting and ranking MCDM techniques. In the subsections that follow, the proposed integration is outlined in depth.
Development of P-H–FWZIC weighting methodIn this paper, the P-H–FWZIC method is developed to perform two functions. The first and main task is to apply weights to the specified ISTMA for EPV evaluation criteria, and the second task is to evaluate the values of the MS criterion in the context of Industry 5.0. The step-by-step procedure of P-H–FWZIC is given as:
Step 1: The pre-set ISTMA’ evaluation criteria for EPV are examined and presented in this step (Stage 1).
Step 2: The identification and nomination of at least three experts in the relevant study field are performed in this step. Subsequently, the data collecting form is established and confirmed by the chosen experts for assessment purposes. Table 1 contains the linguistic expressions that the experts are supposed to use when expressing their opinions on each of the ISTMA for EPV criteria.
Step 3: The expert decision matrix (EDM) is created in this step by crossing the ISTMA for EPV criteria with the chosen experts, as indicated in Eq. (1). For further analysis, the linguistic expressions extracted from the data collecting form in the preceding step are replaced with a numeric scale.
Step 4: This step involves the application of P-HFS to transform EDM into P-HFS–EDM. This transformation is accomplished using probabilistic hesitant fuzzy numbers (P-HFNs) (Table 1) that replace the crisp values (numeric scale) in the EDM. This part of the proposed method is crucial because it manages expert uncertainty and obtains confidence for each element that could serve as potential information for MCDM (Krishankumar et al., 2021). The following is the definition of P-HFS and P-HFNs, which indicate probabilities in hesitant fuzzy information.

Definition (1) (Xu & Zhou, 2017) Let F be a fixed set. The P-HFS on F can be represented as follows:

Step 5: The P-HFS–EDM derived in the preceding step is utilised to generate the weight values of each criterion used to evaluate ISTMA for EPV. Firstly, the P-HFNs for each criterion across the three experts within the P-HFS–EDM are aggregated using the probabilistic hesitant fuzzy weighted average (PHFWA) operator (Jiang & Ma, 2018) shown in Eq. (2).

Then, the resulting fuzzy weight values are defuzzied using Eq. (3) (Xu & Zhou, 2017) and converted into crisp weight values.

Finally, the summation of the weights for the main criteria and each sub-level must equal 1. If this criterion was not met, then the values are rescaled using Eq. (4).
where sj represents the weight value for each criterion.
Notably, the five preceding steps are performed separately on the main criteria and each level's criteria. The weights are calculated in this manner because the weight value of the criterion with multiple sub criteria does not reflect the actual weight of that criterion compared to the criterion with no sub criteria. Therefore, the weight values of the criteria are determined at each level independently, and the backward scoring process (BSP) is used to benchmark each ISTMA for EPV in the context of Industry 5.0 a reasonable manner, as explained in detail in the following section. Algorithm 1 illustrates the pseudocode of the P-H–FWZIC weighting method.
Employment of MULTIMOORA ranking methodIn this section, the DMs (Section 3.1) and the weight values of the criteria (Section 3.2.1) are used to benchmark the ISTMAs for EPV. The MULTIMOORA method is used to perform two functions: creating the DMs and benchmarking ISTMAs for EPV in the context of Industry 5.0 as main function, as shown in the following steps (Hafezalkotob et al., 2019):
Step 1: Before applying MULTIMOORA, the DMs produced from Stage I must be normalised. Normalisation is used to unite the different dimensions of the criteria to conduct the benchmarking process. In MCDM approaches, various normalising schemes have been implemented. According to Ref. Brauers et al. (2008), vector normalisation is the most robust option for use in MULTIMOORA. Therefore, Eq. (5) is employed to normalise the formulated DMs.
Step 2: The ratio score system is utilised to compute the ranking value (y1) of the ISTMAs for EPV regarding the criteria at each level using Eq. (6).


Step 3: The reference point system is utilised to compute the ranking value (zi) of the ISTMAs for EPV regarding the criteria at each level. Firstly, the maximal objective reference point (MORP) vector is calculated using Eq. (8). Subsequently, the distance between the weighted value of each MORP vector member and the weighted alternative rating is calculated using Eq. (9).


Eq. (10) is utilised to compute the zi by maximizing the distance presented in Eq. (9) as follows:

The superiority of an alternative increases as its ranking value decreases. The alternatives are listed according to the ascending order of their ranking values (zi), as shown in Eq. (11).

Step 4: The full multiplicative form system is used to compute the ranking value (ui) of the ISTMAs for EPV regarding the criteria at each level using Eq. (12).

The superiority of an alternative increases with its ranking value. Consequently, the alternatives can be arranged in descending order of their respective ranking values (ui), as shown in Eq. (13).

Step 5: The scores and ranks of the ISTMAs for EPV that are calculated in Steps 2, 3 and 4 are aggregated using rank position method (RPM) to generate the final scores and ranks of the ISTMAs for EPV, as shown in Eq. (14).

The best ISTMAs for EPV based on RPM has the minimum value of RPM(Ai).
The above five steps of MULTIMOORA are performed on each DM in BSP manner as follows:
- a)
The ISTMAs for EPV in the context of Industry 5.0 are scored on the basis of the DMs of the second level of the SS. The scores of these DMs are returned to the first level of the SS criterion (FS and VS). The resulting matrix represent the DM of the first level of the SS criterion, which is used to rank the ISTMAs for EPV based on their weighting criteria (i.e. FS and VS). The resulting scores (BSPv) are returned to the first main criterion, which represents the SS criterion (see Fig. 1).
- b)
The ISTMAs for EPV in the context of Industry 5.0 are scored on the basis of the DMs of the third level of the DS criterion (price, FCost, MCost, and BCost) and (range, EPerformance, and VPerformance). The scores of these DMs are returned to the second level of the DS criterion (FAttributes and TechAttributes). The resulting matrix plus the value of the FAvailability criterion represent the DM of the second level of the DS criterion, which is used to rank the ISTMAs for EPV based on their weighting criteria (i.e. FAttributes, TechAttributes, and FAvailability). The resulting scores are returned to the first level of the DS criterion. To build the DM of the second main criteria (DS), P-H–FWZIC is used to evaluate the values of the MS criterion. The resulting scores are combined with scores of CM to generate the DM of DS criterion (see Fig. 1).
- c)
The ISTMAs for EPV in the context of Industry 5.0 are scored on the basis of DMs of the second level of the Sus criterion. The scores of these DMs are returned to the first level of the Sus criterion (ECO and ENV). The resulting matrix plus the value of the SOC criterion represent the DM of the second level of the Sus criterion, which is used to rank the ISTMAs for EPV based on their weighting criteria (i.e. ECO, ENV, and SOC). The resulting scores are returned to the third main criterion, which represents the Sus criterion (see Fig. 1).
- d)
The scoring decision matrix that supportive industry 5.0 is built on the basis of scores returned from the Steps A, B and C above (see Fig. 1). This matrix is used with weights of the main criteria (SS, DS, and Sus) to calculate the final benchmarking results of the ISTMA for EPV in the context of Industry 5.0.
After defining and identifying the lists of ISTMA for EPV and their evaluation criteria, the DMs are derived from their intersection in the context of Industry 5.0. In the appendix, Table A.1 depicts the proposed DMs that serve as the basis for benchmarking ISTMAs for EPV in the context of Industry 5.0. (1) indicates the presence of the criterion in the ISTMA for EPV in the context of Industry 5.0, whereas (0) indicates the absence of the criterion in the ISTMA for EPV. At Level 3, two DMs are constructed to evaluate ISTMAs for EPV in the context of Industry 5.0 based on (price, FCost, MCost, and BCost) and (range, EPerformance, and VPerformance) criteria. At Level 2, five DMs are constructed to evaluate ISTMAs for EPV in the context of Industry 5.0 based on (R&D, FProd, FpCost, FDemand, FCost and FAvailability), (R&D, QProd, VpCost, TecAtt, DCost, EDemand and RPrice), (FAvailability), (MSC, FC, TC, GDP and EDC) and (Euse, GHG use, VOC use, PM use, NOX use, GHG Prod, VOC Prod, PM Prod, NOX Prod and WF) criteria. At Level 1, two DMs are constructed to evaluate ISTMAs for EPV based on MS and SOC criteria, respectively. It is worth to mention that MS criterion is evaluated using P-H–FWZIC method with the assistance of three experts. The MULTIMOORA used these matrices to generate the remaining DMs in BSP manner in the context of Industry 5.0.
ISTMA for EPV criterion weighting results in the context of industry 5.0The ISTMA criteria identified in Section 3.2.1 for the selection of the ISTMA for EPV in the context of Industry 5.0 are weighted using the P-H–FWZIC technique, and the results are provided in this section. Importantly, no inconsistencies were observed in the calculated weights, which is one of P-H–FWZIC's main benefits. The P-H–FWZIC method is implemented in five steps, as outlined in Section 3.2.1. The initial step of P-H–FWZIC focuses on defining and investigating the main and three levels of criteria. In the second step, the nominated experts use five linguistic expressions to evaluate each criterion using data collecting form. In the third step, these five expressions are replaced with five numeric scales to create the EDM (Table A.2 in the appendix). In the fourth step, P-HFNs are used to create the P-HFS–EDM by applying the P-HFS membership function on the EDM. In the last step, each ISTMA for EPV criterion P-HFNs within the P-HFS–EDMs of three experts are aggregated and defuzzied to produce the final weight values (see Table 2).
Criterion weight results.
The weight values at Levels 1–3 are employed by MULTIMOORA to produce the remaining DMs in BSP manner. However, the weight values of the main criteria will be used as benchmark ISTMAs for EPV in the context of Industry 5.0. According to Table 2, the Sus (Sustainability) criterion obtained the highest weight value of 0.4722, followed by the SS (Supply Side) criterion with the weight value of 0.3667. Meanwhile, the DS criterion (Demand Side) had the lowest weight value of 0.1612.
ISTMA benchmarking results for Epv in the context of industry 5.0 based on MULTIMOORAISTMA benchmarking results for EPV in the context of Industry 5.0 are reported in this section. As mentioned in Section 3.2.2, the data within the DMs (Table A.1 in the appendix) are normalised in the first step. Subsequently, the ratio score system (yi) is utilised to compute the ranking value of the ISTMAs for EPV, followed by the reference point system (zi) and full multiplicative form (ui) calculations. The resulting scores and ranks are aggregated using RPM method to produce the final ranking results of ISTMAs for EPV in the context of Industry 5.0. The MULTIMOORA method is employed to perform two functions. Firstly, it used to generate the DMs of ISTMAs for EPV in BSP manner. In this context, the DMs at level 3 (see Table A.2 in the appendix) are used to produce scores for FAttributes and TechAttributes criteria at Level 2, as shown in Table A.3 in the appendix. Similarly, the DMs at Level 2 are utilized by MULTIMOORA method to generate scores for the criteria at Level 1 (e.g., FS, VS, CM, ECO and ENV) in the context of Industry 5.0. The generated scores were used to construct the DMs at Level 1, which were then used to form the final scoring decision matrix (see Fig. 1). The final ranking results of the ISTMAs for EPV are given in Table 3.
Scoring decision matrix and ISTMAs for EPV benchmarking results in the Context of Industry 5.0.
| ISTMAs for EPV | Scoring decision matrix | yi | zi | ui | RPM aggregation | ||||||
|---|---|---|---|---|---|---|---|---|---|---|---|
| SS | DS | Sus | Score | Rank | Score | Rank | Score | Rank | Score | Rank | |
| ISTMA1 (Shafiei et al., 2013) | 0.3333 | 0.3333 | 1.2727 | −0.1509 | 1 | 0.0785 | 4 | 9.2401 | 1 | 0.4444 | 1 |
| ISTMA2 (Greene et al., 2014) | 1.3636 | 1.0909 | 0.9677 | −0.1937 | 2 | 0.0552 | 2 | 5.1824 | 3 | 0.7500 | 3 |
| ISTMA3 (Shafiei et al., 2015) | 0.9677 | 1.7143 | 1.2727 | −0.2170 | 5 | 0.0785 | 4 | 4.8011 | 5 | 1.5385 | 5 |
| ISTMA4 (Günther et al., 2015) | 3.4138 | 3.4138 | 0.6522 | −0.3264 | 10 | 0.1651 | 10 | 3.7109 | 10 | 3.3333 | 10 |
| ISTMA5 (Onat et al., 2016a) | 3.1034 | 3.0000 | 0.4762 | −0.2828 | 8 | 0.1485 | 8 | 4.5519 | 6 | 2.4000 | 8 |
| ISTMA6 (Onat et al., 2016b) | 3.1034 | 3.0000 | 0.4762 | −0.2828 | 8 | 0.1485 | 8 | 4.5519 | 6 | 2.4000 | 8 |
| ISTMA7 (Pasaoglu et al., 2016) | 0.8000 | 2.6667 | 1.0000 | −0.2032 | 3 | 0.0541 | 1 | 5.3725 | 2 | 0.5455 | 2 |
| ISTMA8 (Onat et al., 2017) | 2.0588 | 0.6667 | 1.3846 | −0.2622 | 6 | 0.0925 | 6 | 4.0732 | 8 | 2.1818 | 6 |
| ISTMA9 (Sen et al., 2017) | 2.0588 | 0.6667 | 1.3846 | −0.2622 | 6 | 0.0925 | 6 | 4.0732 | 8 | 2.1818 | 6 |
| ISTMA10 (Kieckhäfer et al., 2017) | 1.7143 | 1.8421 | 3.4138 | −0.4708 | 11 | 0.2893 | 11 | 2.4150 | 11 | 3.6667 | 11 |
| ISTMA11 (Shafiei et al., 2018) | 0.9677 | 1.7143 | 1.2000 | −0.2098 | 4 | 0.0713 | 3 | 4.9363 | 4 | 1.2000 | 4 |
Firstly, the scoring decision matrix is used to calculate yi scores and ranks of the ISTMAs for EPV in the context of Industry 5.0 with respect to the generated weight values. The alternative with the higher score value is better. The ISTMA1 earned the highest rank (rank = 1) with score value of (−0.1509), followed by ISTMA2 (rank = 2) and ISTMA7 (rank = 3) with score values of (−0.1937) and (−0.2032), respectively. Meanwhile, ISTMA10 received the lowest rank (rank = 11) with score value of (−0.2098). The rankings of the remaining ISTMAs for EPV were distributed between the highest and lowest ranks. Secondly, the scoring decision matrix is used again to calculate the zi scores and ranks of the ISTMAs for EPV. The alternative with the lowest score value is better. The ISTMA7 obtained the lowest score value of (0.0541) and ranked first. The ISTMA2 and ISTMA11 received the second and third ranks with score values of (0.0552) and (0.0713), respectively. According to zi, the lowest rank is given to the ISTMA10 with a score value of (0.2893). The remaining ISTMAs’ for EPV rankings in the context of Industry 5.0 are distributed between the greatest and lowest rankings. The scoring decision matrix is used for the third time to calculate the ui scores and ranks of the ISTMAs for EPV in the context of Industry 5.0. The alternative with the greatest score value is better. ISTMA1, ISTMA7 and ISTMA2 are the top three alternatives according to ui, with scores of (9.2401), (5.3725) and (5.1824), respectively. Similar to yi and zi, ISTMA10 ranked last with the score value of (2.4150). The remaining ISTMA for EPV rankings in the context of Industry 5.0 are spread between the first and last ranks. Finally, the RPM aggregated the scores and ranks of the alternatives across the yi, zi and ui. The alternative with minimum score value is better. The ISTMA1 achieved the first rank with score valued of (0.4444), followed by the ISTMA7, ISTMA2, ISTMA11 and ISTMA3 with score values of (0.5455), (0.7500), (1.2000) and (1.5385). ISTMA8 and ISTMA9 ranked 6th with score value of (2.1818). Similarly, ISTMA5 and ISTMA6 ranked 8th with a score value of (2.4000). ISTMA4 and ISTMA10 ranked last (10th and 11th) with score values of (3.3333) and (3.6667), respectively.
Validation and evaluation of the proposed methodThe proposed method is validated in this section by performing sensitivity analysis (see Section 5.1). Following that, a comparison analysis is used to evaluate the proposed method considering the benchmark study (see Section 5.2).
Sensitivity analysisIn the literature, several researchers (Alamoodi et al., 2022a, 2022b; Al-Humairi et al., 2022; Qahtan et al., 2022) have utilised sensitivity analysis to evaluate their findings. A comprehensive sensitivity analysis was conducted to assess the stability of the integration of the proposed novel MCDM techniques. The aim is to determine whether the ideal alternative alters when the weights of the major criteria are increased or decreased. The following steps were used to perform sensitivity analysis (Pamucar et al., 2020):
Step 1: The most important criterion is select from the list. The Sus (Sustainability) criterion in the context of Industry 5.0 is identified as the most important criterion because it has the highest weight value (wSus=0.4722).
Step 2: The boundaries Δx for altering the weight of Sus criterion were determined based on the interval [−0.47217, 0.527831], and it is calculated as follows:

Step 3: The elasticity coefficient αc of Sus criterion is used to calculate the extent to which each criterion departs, and it is calculated as follows:

Step 4: Nine scenarios are created by splitting the predefined interval Δx, and the new weights of all the main criteria are calculated using Eq. (17). These new calculated weights must satisfy the condition ∑wc=1.

Fig. 2 illustrates the changing of the main criterion weights the in nine scenarios. These weights will be used by MULTIMOORA to benchmark ISTMAs for EPV.
Step 5: The new benchmarking results of ISTMAs for EPV across the nine scenarios are compared with the original one. The observed results demonstrate that the weights of the criteria have a considerable effect on the benchmarking of the alternatives. The benchmarking results of the 11 ISTMA for EPV alternatives in the context of Industry 5.0 by 9 scenarios are shown in Fig. 3.


The proposed methodology is robust and stable in the majority of the nine scenarios. As shown in Fig. 3, ISTMA1 maintained its first ranking in six scenarios (S1–S6), which represent 67% of the ranking in nine scenarios but dropped to the 4th, 6th and 7th ranks in S7–S9, respectively. The second-best alternative (ISTMA7) according to the proposed method fell in all scenarios, whilst the third-best alternative (ISTMA2) maintained its ranking in one scenario (S7). The ISTMA2 raised to the 2nd rank in S5 and S6 but dropped to the 4th and 5th ranks in (S4, S8, and S9) and (S1-S3), respectively. Lest alternative (ISTMA10) maintained its 11th rank in six scenarios, which represent 67% of the ranking in nine scenarios but raised to 8th and 10th ranks in (S1-S2) and S3, respectively. The ISTMA11, ISTMA3 and ISTMA4 ranks based on the proposed method and the nine scenarios’ similarities were 11%, 22% and 22%, respectively. ISTMA8 and ISTMA9 maintained their rankings (rank = 6) in five scenarios (S1–S5), which represent 56% of the ranking in nine scenarios but fell in the remaining scenarios to the 9th rank. In addition, the rankings of ISTMA5 and ISTMA6 are maintained in three scenarios (S3-S5) but elevated in S6-S9 and decreased in S1-S2. The analysis confirmed that the weights assigned to each criterion have a considerable effect on the ISTMAs' for EPV final ranking outcomes in the context of Industry 5.0. For instance, the best alternative (ISTMA1) according to the proposed method (rank = 1) dropped to the 7th rank in S9 when the weight value of the most important criterion (Sus) was set to 1, and the weight values of the two other criteria were set to 0. In addition, lest alternative (ISTMA10) according to the proposed method (rank = 11) raised to the 8th rank in S1 when the weight value of the most important criterion (Sus) was set to 0.
Finally, the relationships between ranking results based on the proposed method and the nine scenarios were analysed using a Spearman correlation coefficient (SCC). As seen in Fig. 4, the correlation coefficients reveal a moderate and positive association between rankings.

A strong and positive relationship existed between the ISTMAs for EPV rankings in the context of Industry 5.0 according to the suggested technique and five of the nine situations (S1 to S5), as shown in the correlation analysis in Fig. 4, with SCC values of 0.8 (S1- S2), and 0.9 (S3-S5). A moderate and positive correlation between rankings is presented in S6 with SCC value of 0.6. In S7, the correlation between rankings was weak and positive, with a SCC value of 0.2, whereas it was weak and negative in S8 and S9, with SCC values of −0.01 and −0.04, respectively. The average correlation coefficient across all scenarios is 0.6, which indicates a moderate and positive relationship.
Comparison analysisIn this section, the proposed method is compared with benchmark study (Alnoor et al., 2022) based on multiple comparison points (checklist). It is worth mentioning that the benchmark study extended MULTIMOORA and FWZIC under linear Diophantine fuzzy rough sets (LDFRS) to benchmark oil companies. Therefore, we compare the proposed method with the benchmark study from two aspects: theoretical and application aspects. The comparison in the theoretical aspect is based on the weighting and ranking perspectives. In terms of weighting, P-H-FWZIC is compared with LDFRS–FWZIC, whereas MULTIMOORA in the present study is compared with LDFRS–MULTIMOORA in terms of ranking. The comparison in the application aspect is based on the MCDM issues associated with each case. The following points summarise the comparison, as illustrated in Table 4.
- •
1st point: The inconsistency reflects whether the weighting method in the compared studies solved this issue raised by pairwise comparisons.
- •
2nd point: The time consumption reflects whether the weighting method in the compared studies required a lot of time to implement.
- •
3rd point: The dependency amongst criteria reflects whether the weighting method in the compared studies re-conduct pairwise comparison when a criterion was removed or added.
- •
4th point: The experts’ feedback reflects whether the weighting method in the compared studies simply gathered feedback from experts.
- •
5th point: The ambiguity, uncertainty and vagueness of information reflects whether the weighting method in the compared studies solved the following issues:
- ■
1st subpoint: Efficiently managing uncertainty
- ■
2nd subpoint: A generic and more flexible preference structure
- ■
3rd subpoint: Facilitate the preference elicitation of experts
- ■
4th subpoint: Overcome the serious loss of information
- ■
5th subpoint: Consider the probability of each element's occurrence
- ■
6th subpoint: Permit many perspectives
- ■
7th subpoint: Increase the information's reliability
- ■
- •
6th point: Performing multifunction reflects whether the weighting method in the compared studies performed more than one task.
- •
7th point: Weighting the criteria reflects whether the ranking method in the compared studies can weight the criteria or not.
- •
8th point: Straightforward and stable reflects whether the ranking method in the compared studies are simple and stable.
- •
9th point: The least amount of processing time reflects whether the ranking method in the compared studies required the least amount of processing time to implement.
- •
10th point: The least number of mathematical calculations reflects whether the ranking method in the compared studies required least number of mathematical calculations.
- •
11th point: The ambiguity, uncertainty and vagueness of information reflects whether the ranking method in the compared studies solved this issue.
- •
12th point: Performing multifunction reflects whether the ranking method in the compared studies performed more than one task.
- •
13th point: Multiple evaluation criteria reflects whether the application (case study) in the compared studies had this issue.
- •
14th point: The varying priorities of these criteria reflects whether the weights of the criteria varied in the application of the compared studies.
- •
15th point: Diminish the weight of the criteria with sub criteria reflects whether the compared studies solved this issue.
- •
16th point: Criteria trade-offs reflects whether the application in the compared studies had this issue.
- •
17th point: Data variation reflects whether the application in the compared studies had this issue.
Comparison points between the proposed and benchmark studies.
| Comparison Points | Benchmark study (Alnoor et al., 2022) | Proposed study | |||
|---|---|---|---|---|---|
| Theoretical Aspect | Weighting perspective | Inconsistency | ✓ | ✓ | |
| Time consumption | ✓ | ✓ | |||
| Dependency amongst criteria | ✓ | ✓ | |||
| Experts’ feedback | ✓ | ✓ | |||
| Ambiguity, uncertainty and vagueness of information | Efficiently managing uncertainty | ✓ | ✓ | ||
| A generic and more flexible preference structure | X | ✓ | |||
| Facilitate the preference elicitation of experts | X | ✓ | |||
| Overcome the serious loss of information | X | ✓ | |||
| Consider the probability of each element's occurrence | X | ✓ | |||
| Permit many perspectives | X | ✓ | |||
| Increase the information's reliability | X | ✓ | |||
| Performing multifunction | X | ✓ | |||
| Ranking perspective | Weighting the criteria | X | X | ||
| Straightforward and stable | ✓ | ✓ | |||
| Least amount of processing time | ✓ | ✓ | |||
| Least number of mathematical calculations | ✓ | ✓ | |||
| Ambiguity, uncertainty and vagueness of information | ✓ | X | |||
| Performing multifunction | X | ✓ | |||
| Application Aspect | Multiple evaluation criteria | ✓ | ✓ | ||
| Varying priorities of these criteria | ✓ | ✓ | |||
| Diminish the weight of the criteria with sub criteria | X | ✓ | |||
| Criteria trade-offs | ✓ | ✓ | |||
| Data variation | X | ✓ | |||
| Total score | 52.17 | 91.3 | |||
| Accumulative difference | 47.8 | 8.7 | |||
illustrates the pseudocode of the MULTIMOORA method.
| Algorithm 2: MULTIMOORA ranking method |
| Input: Alternatives, criteria and criteria weightsOutput: Select a best alternative that holds maximum value of beneficial criteria and minimum value of cost criteria |
| Step 1: Formulated HMDTMLs Decision Matrix:identifyC[j]// C is the set of the identified affected criteria of ISTMAs.identify A [i]// ISTMA list as alternative.Step 2: Categorize the input criteria into beneficial(Be)and cost criteria(Co)Step 3: Normalizationn← length (C)m← length (A)For j in {1..n}For i in {1..m}xij*=xij∑i=1m(xij)2End forEnd forStep 4: Ratio score systemm←length (A)For i in {1..m}Yi=∑j=1gwjxij*−∑j=g+1nwjxij* // ratio score system calculate usingEq. (6)where g: benefit criteria categoryEnd forRRSS={Ai∣maxyi>⋯>Ai∣minyi}// ranking alternative according to ratio score systemStep 5: Reference point systemFor j in {1..n}For i in {1..m}Rj={maxxij*i,j≤g;maxxij*i,j>g}// reference point calculate usingEq. (8)dij=|wjrj−wjxij*|.//distance from reference point calculate usingEq. (9)zi=maxdjij, /maximum /distance from reference point calculate usingEq. (10)End forEnd forRRPS={Ai|minzii≻⋯>Ai|minzii}, // ranking alternative according to reference pointStep 6: Full multiplicative form systemm ← length (A)For i in {1..m}ui=∏j=1g(xij*)wj/∏j=g+1n(xij*)wj,// Full multiplicative form system calculate usingEq. (12) where g: benefit criteria categoryEnd forRFMFS={Ai|maxuii>⋯>Ai|maxuiiiui}// ranking alternative according to Full multiplicative form systemStep 7: Aggregation Scorem ← length (A)For i in {1..m}RPM(Ai)=1/(1/r(yi)+1/r(zi)+1/r(ui)), // rank position method calculate usingEq. (14)to generate the final scoresEnd forStep 8: ranking the alternative according to the score value, the best alternative has the smallest score value |
As given in Table 4, the comparison based on the theoretical aspect are made from weighting and ranking perspectives. Six main points (1st–6th points) and seven subpoints (1st–7th subpoints) are used to compare the proposed study to the benchmark study in terms of weighting perspective. The proposed work met all 12 points (100%), whereas the benchmark study met only 5 of the 12 points (41.7%). Another six points (7th–12th point) are used to compare the proposed study to the benchmark study in terms of ranking perspective. Both compared studies met four of the six points (66.7%). The comparison based on the application aspect are made on the basis of five comparison points (13th–17th point). The proposed study satisfied all five points (100%), whilst the benchmark study satisfied only three out of the five points (60%). Overall, the proposed study achieved 21 out of the 23 points (91.3%) but fell to satisfy only 2 points (8.7%). In contrast, the benchmark study met 12 out of the 23 points (52.17%) but fell to satisfy 11 points (47.8%). Thus, a value-added process in benchmarking the most sustainable ISTMA for EPV in the context of Industry 5.0 was provided in the proposed study, which presented the most essential comparison points.
Managerial implicationsUndoubtedly, EPVs have become a desirable solution from the demand side of the mobility industry to address the problem of air pollution created by the transportation industry 5.0. Our findings have a wide range of implications for managers, particularly the sustainability strategists and those in the automotive industry, and policymakers, as well as future academics. Developing a sustainable transportation environment, maximizing economic performance and reducing energy consumption in the context of Industry 5.0 are possible by selecting the most sustainable approach for EPV. In addition, the automotive industry 5.0 can benefit from determining the most sustainable approach for EPV for the development phase of their products. Furthermore, this study provides regulators with decision-making assistance to evaluate existing approaches and prospective policies. Lastly, this work can aid future academics by providing a method for selecting the most sustainable ISTMA for EPV in the context of Industry 5.0.
ConclusionIn this study, FWZIC introduced by Ref. Mohammed et al. (2022) has been extended to P-H-FWZIC. The new extension can provide experts with a wider range of options, increase the precision in assessing the alternatives, and deal with ambiguity, uncertainty and vagueness of information more successfully and professionally. Therefore, a new method is proposed based on integration of P-H-FWZIC and MULTIMOORA method to facilitate and solve the difficulties associated with benchmarking ISTMAs for EPV in terms of the sustainability in the context of Industry 5.0 and other main criteria. Sensitive analyses, SCC test, and comparison analysis were conducted to prove the strength of the proposed method.
Despite the advantages of the proposed work, the present research has two main limitations. Firstly, only one aggregation and defuzzification operators are employed with P-H-FWZIC. In future research, other operators may be used. Secondly, regardless of their level of experience, all the experts were treated equally. The solution to this flaw is to grant certain influence on experts based on their expertise.
The researcher's perspective suggests that future research can be improved as follows: (i) The proposed methodology can be used to evaluate and benchmark any future approaches in the transportation industry, portfolio selection based on financial performance of firms (Qun et al., 2022), observation process modelling in the framework of cognition processes (Claudiu and Radu-Emil 2012) and shape memory alloy wire actuators (Radu-Emil, 2021) (ii) P-H-FWZIC can be extended with other fuzzy sets, such as interval-valued intuitionistic fuzzy soft–rough sets, soft hesitant fuzzy rough set, T-spherical fuzzy rough sets and picture fuzzy rough sets. (iii) Alternative linguistic expressions (e.g. seven, ten or eleven scales) can be used to evaluate the suitability of the ISTMAs for EPV in the context of Industry 5.0.