


Dissatisfied customers often use social media to voice their complaints effectively, and firms strive to find solutions about how to respond to publicly visible service failure posts. We add to the emerging literature on complaint handling via social media by examining how complaining customers on a company's Facebook page prefer to be treated. We built on the multi-attribute product concept and conducted four sequential studies in the air transport industry. Studies 1–3 were conducted to identify the service failures with a high magnitude of negative utilities as judged by consumers. The studies also served to build a service failure scenario involving relevant service recovery attributes related to the entire complaint process. The results showed that lost baggage had the highest magnitude of negative utility. The attributes that consumers found most appropriate in the case of lost baggage were timeliness and type of initial response, communication modes, compensation type, and types of information throughout the complaint process. Study 4 took this further by putting participants into the scenario to analyze their preferences, segments, and profiles. The findings presented in this study have practical implications for airlines and consumers because the results reveal four distinct consumer segments and indicate the presence of heterogeneous preferences for communication modes and interaction types across segments.
Social media has transformed the way customers and organizations communicate service failures. The number of complaints demonstrates that customers have embraced social media as a channel for addressing their problems and dissatisfactions when service failures occur (e.g., Einwiller & Steilen, 2015). Facebook, in particular, has become increasingly attractive for customer service and complaint handling (see a discussion in Dolan et al., 2019). While many complaints can be solved directly on the social media pages, others are more complex and require more insights for effective and efficient handling. Complaint handling has a positive impact on customer's future purchase intentions, and, therefore, investing in service recovery efforts is good from a customer value and retention perspective (Andreassen, 2001; Reinhold & Alt, 2013). Customer care via social media involves finding practical ways to utilize information provided on social media to meet customers’ specific needs (Baird & Parasnis, 2011). Social customer care is not the presence of social media technology itself but a strategy to create and maintain positive relationships with customers. This bi-directional marketing approach has changed how consumers and businesses communicate with one another and gives consumers a feeling of ownership in the conversation (Faase et al., 2011). Firms can respond to customer complaints in various ways, but understanding the optimal response type is quintessential in maintaining a high level of social customer care and what brings a firm to the forefront in service delivery.
In June 2019, the US Department of Transportation (2019) announced the 12 highest causes of airline complaints. The top categories contained flight problems, baggage problems, boarding/ticketing, customer service, and refunds. The literature on complaint handling and service failure recovery in the advent of social media is still in its nascent stage. One stream of research takes on an electronic word-of-mouth perspective (e.g., Israeli et al., 2017; Schaefers & Schamari, 2016). Another stream of research focuses on organizations’ complaint handling on social media (Einwiller & Steilen, 2015; Fan & Niu, 2016; Manika et al., 2017). The existing literature offers little insight into how organizations should respond to service failure posts requiring more than just a single tweet or post to resolve, including how to reply to such complaint posts, how to facilitate a deeper dialogue with the complainants, how to keep the complainants informed throughout the process, and the type of compensation to offer as part of the recovery effort. Finding a proper solution to a service problem can involve several steps, including the necessity of moving the dialogue to another communication platform. This solution depends on the type and magnitude of the service failure (Smith et al., 1999). The likelihood of tangible solutions also increases with the severity of the service failure and whether the failure is monetary (Roschk & Gelbrich, 2014).
This paper aims to contribute by building and testing a scenario involving relevant service recovery attributes related to the entire complaint process for a high-magnitude service failure in the air transport industry. This industry is particularly exposed to service failures due to the billions of passengers served, the number of touchpoints, the level of competitiveness, and the customers’ exposure to multiple service providers. Many airlines are using social media increasingly to initiate and sustain consumer brand engagement through interaction and sharing (Menon et al., 2019). We chose to focus on Facebook as a social media platform because it is the largest social network worldwide (Facebook, 2020). All the airlines studied in this paper maintain an active presence on it. We help to better fill the gap in the literature by:
-
examining complaint posts by travelers on airlines’ social media platforms to detect if these are any different from the causes of complaints reported by the US Department of Transportation,
-
identifying the most severe service failure in aviation by analyzing how and to what extent the main causes of complaints posted on social media influence airline travelers’ willingness to fly again with an airline,
-
identifying relevant service recovery attributes for social media complaints with the greatest influence on willingness to fly again, and
-
examining which preferences airline travelers posting a complaint with the greatest influence on willingness to fly again have for the identified service recovery attributes.
We adopt a holistic approach by considering the complaint process as a unit of analysis from the complaint to the response, unlike previous studies. Analyzing the large datasets acquired from conjoint experiments, we assess the customers’ utility for service failures and service recovery attributes and identify customer segments based on their utility. In this way, we contribute to the advancement of knowledge by introducing different segments of customers who place different importance, for example, on different ways of communication with airlines to resolve service failures. Our contribution enables airlines to develop targeted communication strategies to address unsatisfied customers, positively affecting customer value and loyalty and profitability for the airline company.
The rest of the paper is organized as follows. First, we present a framework focused on relevant service recovery strategies within a service recovery journey. Then, we present each of the four sequential studies performed as part of this research, including their method, results, and discussion. Following a more general discussion of the results, we address managerial implications. Finally, we conclude with key themes that emerged from the findings, discuss limitations of our work, and include some directions for future research.
2Theoretical framework2.1The service recovery journey and types of service failuresVan Vaerenbergh et al. (2019) introduce an adapted perspective to the service recovery literature. They consider the recovery of a service failure to be a separate journey rather than an event in the post-purchase phase of the customer journey. Accordingly, a service recovery journey begins with the awareness of a service failure. It encompasses three phases: pre-recovery, recovery, and post-recovery. In the pre-recovery phase, either the customer or the firm becomes aware of a service failure. This phase spans the period between the initial awareness of the failure and the first interaction between the customer and the firm in response. Customers might demonstrate various reactions in this phase, such as searching for appropriate contact information, using their smartphones to write and post complaints on social media. The recovery phase starts when the initial contact between the customer and the firm is established. In this phase, the firm develops an effective solution to the problem, which lasts until the problem is satisfactorily solved or the customer gives up on the quest for recovery. Finally, in the post-recovery phase, customers assess and evaluate their experiences in the pre-recovery and recovery phases. The current research focuses primarily on phases 1 and 2 in the service recovery journey since they are critical in avoiding escalation of the service problem.
Prior research suggests that the type of service failure influences how customers respond to service rescue strategies in terms of forming expectations (Gilly & Gelb, 1982) and perceptions of justice (Smith et al., 1999) in the first two phases of the service recovery journey. This approach has led researchers to classify service failures that require different forms of response. Outcome failures refer to what customers receive from the service, while process failures refer to how customers receive the service (Gronroos, 1988; Parasuraman et al., 1985). For instance, Smith et al. (1999) suggest that compensation and quick action are more important for outcome failures than for process failures. Understanding the magnitude or severity of the service failure, which the customer perceives (Weun et al., 2004), is a key to the service recovery process. It is necessary to initiate appropriate recovery action (Singhal et al., 2013). Smith et al. (1999) found that the magnitude of the service failure influences how customers value recovery efforts, such as compensation and speedy response. Thus, what can be regarded as an appropriate or optimal recovery strategy depends on how consumers perceive the severity of the service failure (Roggeveen et al., 2012; Weun et al., 2004).
The categorization of service failure types in aviation offered by the US Department of Transportation is often used in service research (e.g., Gursoy et al., 2005), and several of these, such as flight delays and baggage problems, are commonly reported in the literature as sources of airline traveler complaints (e.g., Etemad-Sajadi & Bohrer, 2019; Chow, 2014; Bhadra, 2009; Totten et al., 2005). We expect that travelers’ complaint posts on airlines social media sites are similar to the causes of complaints reported by the US Department of Transportation. However, the causes of complaints do not provide any insights into the severity of the types of service failures. Based on the literature reviewed, we expect that travelers are more sensitive to flight delays and baggage problems (outcome failures) than customer service and refund problems (process failures).
2.2Service recovery strategies2.2.1Timeliness and type of initial response to customer complaints on social mediaTimeliness can be recognized as the speed of response from organizations (Davidow, 2003). Delayed customer complaint response is generally associated with negative satisfaction on problem handling and customer-firm relationships (e.g., Boshoff, 1997). Social media can provide immediate communication between firms and their complaining customers, which is important because responding promptly to customer inquiries and complaints is a key to sustained relationships. This result has been confirmed in research on online commerce and email (e.g., Kelleher & Miller, 2006), but time pressure is possibly even more present on social media. Consumer survey data suggests that a large portion of those complaining on social media expect a response within one hour, while those complaining through emails expect a response in a few hours or a day (Baer, 2018). This difference might result from the nature of social media, which has been designed to allow content to be shared quickly, efficiently, and in real-time.
Tools exist for automatic generic replies to queries and comments on social media. However, research indicates that customers dislike automated emails and would instead prefer personalized contact when communicating with firms online (Ozuem & Lancaster, 2013). Abney et al. (2017) show that a personalized response to a customer complaint tweet leads to more positive consumer evaluations and behavioral intentions than a generic statement, such as ‘please contact our customer service staff to resolve your issue.’ One explanation could be that automated replies and less personalized statements give the impression that the company has not taken the time to understand the customer's concern. In line with this finding, Abney et al. (2017) report significantly higher scores for perceived empathy shown by the company when the response tweet's statement is personalized rather than generic. Thus, we expect that airline travelers experiencing severe service failure show a preference for an immediate personalized response from the airline when posting a complaint on social media.
2.2.2Communication modeThe process of handling a complaint is important for customers’ overall service recovery satisfaction (Berry & Parasuraman, 1993). Some service failures can be handled directly on social media through an apology, a lending ear, or real-time problem-solving. Typical examples of real-time problem-solving in air travel include helping passengers rebook flights, making connections, and retrieving lost air miles (Fan & Niu, 2016). Analyzing tweets posted on airlines’ Twitter accounts, Fan and Niu (2016) find that such real-time problem-solving has a greater effect on customers’ satisfaction with the complaint handling process than merely providing directions for further actions. Other service failures are more severe and/or require the exchange of sensitive information outside the public eye. In the latter case, companies need to take the conversation to a personal level to address the specific problem properly. Einwiller and Steilen (2015) suggest redirecting the complaint away from the social media site is a common strategy. The literature has mostly analyzed the effect of the communication mode (e.g., email, face-to-face, or phone) on service recovery outcome variables, such as satisfaction with the communication (e.g., Shapiro & Nieman-Gonder, 2006). There are many channels available for personalized firm-customer conversations. Some of these channels are somewhat new to consumers. These approaches include live chat agents based on artificial intelligence (i.e., chatbots) and live chat with human service agents. Consumer survey data indicates that emails, phone calls, and live chats are among the most preferred channels when consumers want to engage with companies for customer support (Dick, 2018). Thus, we expect chatbots to be preferred to a lesser extent than the more traditional communication channels when airline travelers experience a severe service failure.
2.2.3Compensation options in service failure recoveryResearch on the effect of compensation on customer reactions and behavioral responses in service failure recovery covers a wide range of issues. It includes, among others, the effects of tangible compensation (e.g., Wirtz & Mattila, 2004; Smith et al., 1999); compensation size (e.g., Gelbrich et al., 2015; Albrecht et al., 2019), including overcompensation (Gelbrich & Roschk, 2011) and compensation types (e.g., Roggeveen et al., 2012; Roschk & Gelbrich, 2014; Bambauer-Sachse & Rabeson, 2014); recovery time and customer compensation expectations (Hogreve et al., 2017); the impact of compensation in different stability and locus of responsibility conditions (Grewal et al., 2008); and the impact of culture on the effects of varying compensation types (e.g., Bambauer-Sachse & Rabeson, 2014).
Compensating complaining customers is generally regarded as an effective service recovery strategy (e.g., Gelbrich & Roschk, 2011). Compensations reimburse customers for their loss related to the organization's failure (Roschk & Gelbrich, 2014). They are used to create a better balance between what customers have invested in, in terms of inputs in a service and what they have gained as outputs from it. In this vein, compensations change how inputs and outputs are divided between the customer and the service provider (de Ruyter & Wetzels, 2000). They can, therefore, be effective in restoring customers’ perceptions of distributive justice or fairness (Wirtz & Mattila, 2004). Customer inputs may be monetary expenses, time, effort, and psychological costs (de Ruyter & Wetzels, 2000). Previous research suggests that the type of compensation offered in service recovery efforts should correspond with the type and severity of the failure (e.g., Roschk & Gelbrich, 2014; Roggeveen et al., 2012). Based on the literature, we expect that airline travelers prefer monetary compensation when experiencing a severe outcome failure.
2.2.4Keeping the customer informed in the service recovery processesThe quality of the communication is an attribute associated with the service recovery process that affects how customers perceive service encounters (Clemmer & Schneider, 1996). Customers appreciate companies that stay in touch with them when a service failure occurs. Andreassen (2000) argues for the importance of providing updated information in service recovery processes. When a firm is proactive and expeditious in its response to the affected customers, the perceptions of service delivery justice have been shown to increase (Smith et al., 1999). The quality and timeliness of communications with distressed customers extended beyond just the company's support page as third-party social media sites publicizing firms’ response rates and quality have become increasingly popular online (Stevens et al., 2018). Thus, we expect that consumers prefer regular updates when experiencing a severe service failure while traveling with an airline.
3Empirical analysisWe conducted four sequential studies. First, we performed a content analysis involving European airlines’ official Facebook pages (Study 1) exploring common customer complaints on social media. This finding was further tested in a choice-based conjoint (CBC) study (Study 2) and interviewing complaining customers (Study 3) to gain insight into the service failure, lost baggage, and response attributes. Finally, with another CBC study (Study 4), we examined consumer preferences for the attributes identified in Study 3.
3.1Study 1: customer complaints on social mediaIn Study 1, we analyzed the frequency and type of complaints on the Facebook pages of three European airlines, each belonging to a particular cost segment: low-cost, middle, and high-end carriers.
3.1.1Data collection and analysisThe data was collected between November 2018 and June 2019. We first collected the archival data by reading all the comments made under a particular post on the airline's Facebook page. A content analysis was conducted to examine patterns of the comments in a replicable and systematic manner. The second data gathering constituted field note data, which involved one of the author's notes from observing the social media community members’ behavior. A total of 7717 comments were analyzed involving the identification and classification of complaining comments.
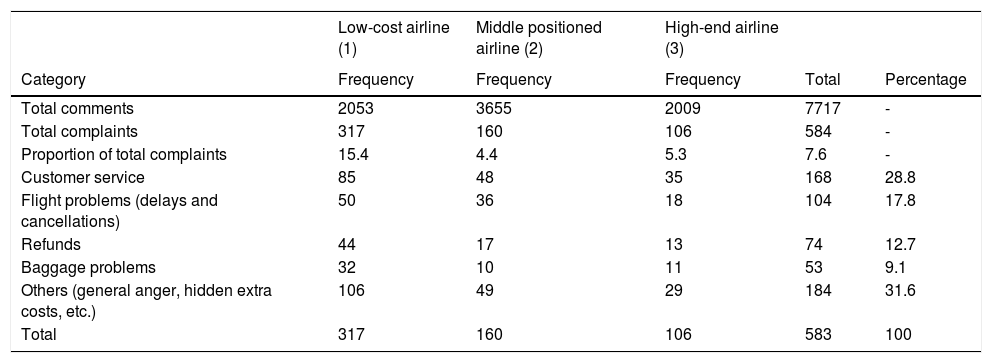
3.1.2Results and discussionTable 1 shows the number of social media posts, the proportion of complaints, and the type of complaint for the three airlines. Complaints accounted for 7.6% of the total comments, and the proportion varied by the airline, with the lowest proportion being 4.4% for airline 2 and the highest proportion being 15.4% for airline 1. We detected complaints based on outcome service failures; baggage problems and flight disruptions, and process failures; customer service problems and refund problems. We observed a difference in the airlines’ social media strategies through our field note data, both when communicating with their customers through a public post on the airlines’ Facebook pages or public response. The low-cost airline's (airline 1) public post strategy was less active and led to more negative comments and customer complaints. Moreover, unlike the other two airlines, this airline was not effective in responding to these complaints, with its responses being more public rather than direct messages (DM).
Frequency and classification of complaints posted on the airlines’ Facebook pages.
Overall, the results show that common complaints on social media are in line with the US Department of Transportation reports also utilized in the literature (see, e.g., Bhadra, 2009; Gursoy et al., 2005).
3.2Study 2: the effects of different service failures on the airlines’ relationshipAlthough airline complaints have been documented for a considerable length of time by the US Department of Transportation (2019), their impacts on customers’ willingness to fly again have been poorly understood in the literature. Therefore, Study 2 examined how and to what extent the most complained airline service failures influence consumers’ willingness to fly again with an airline.
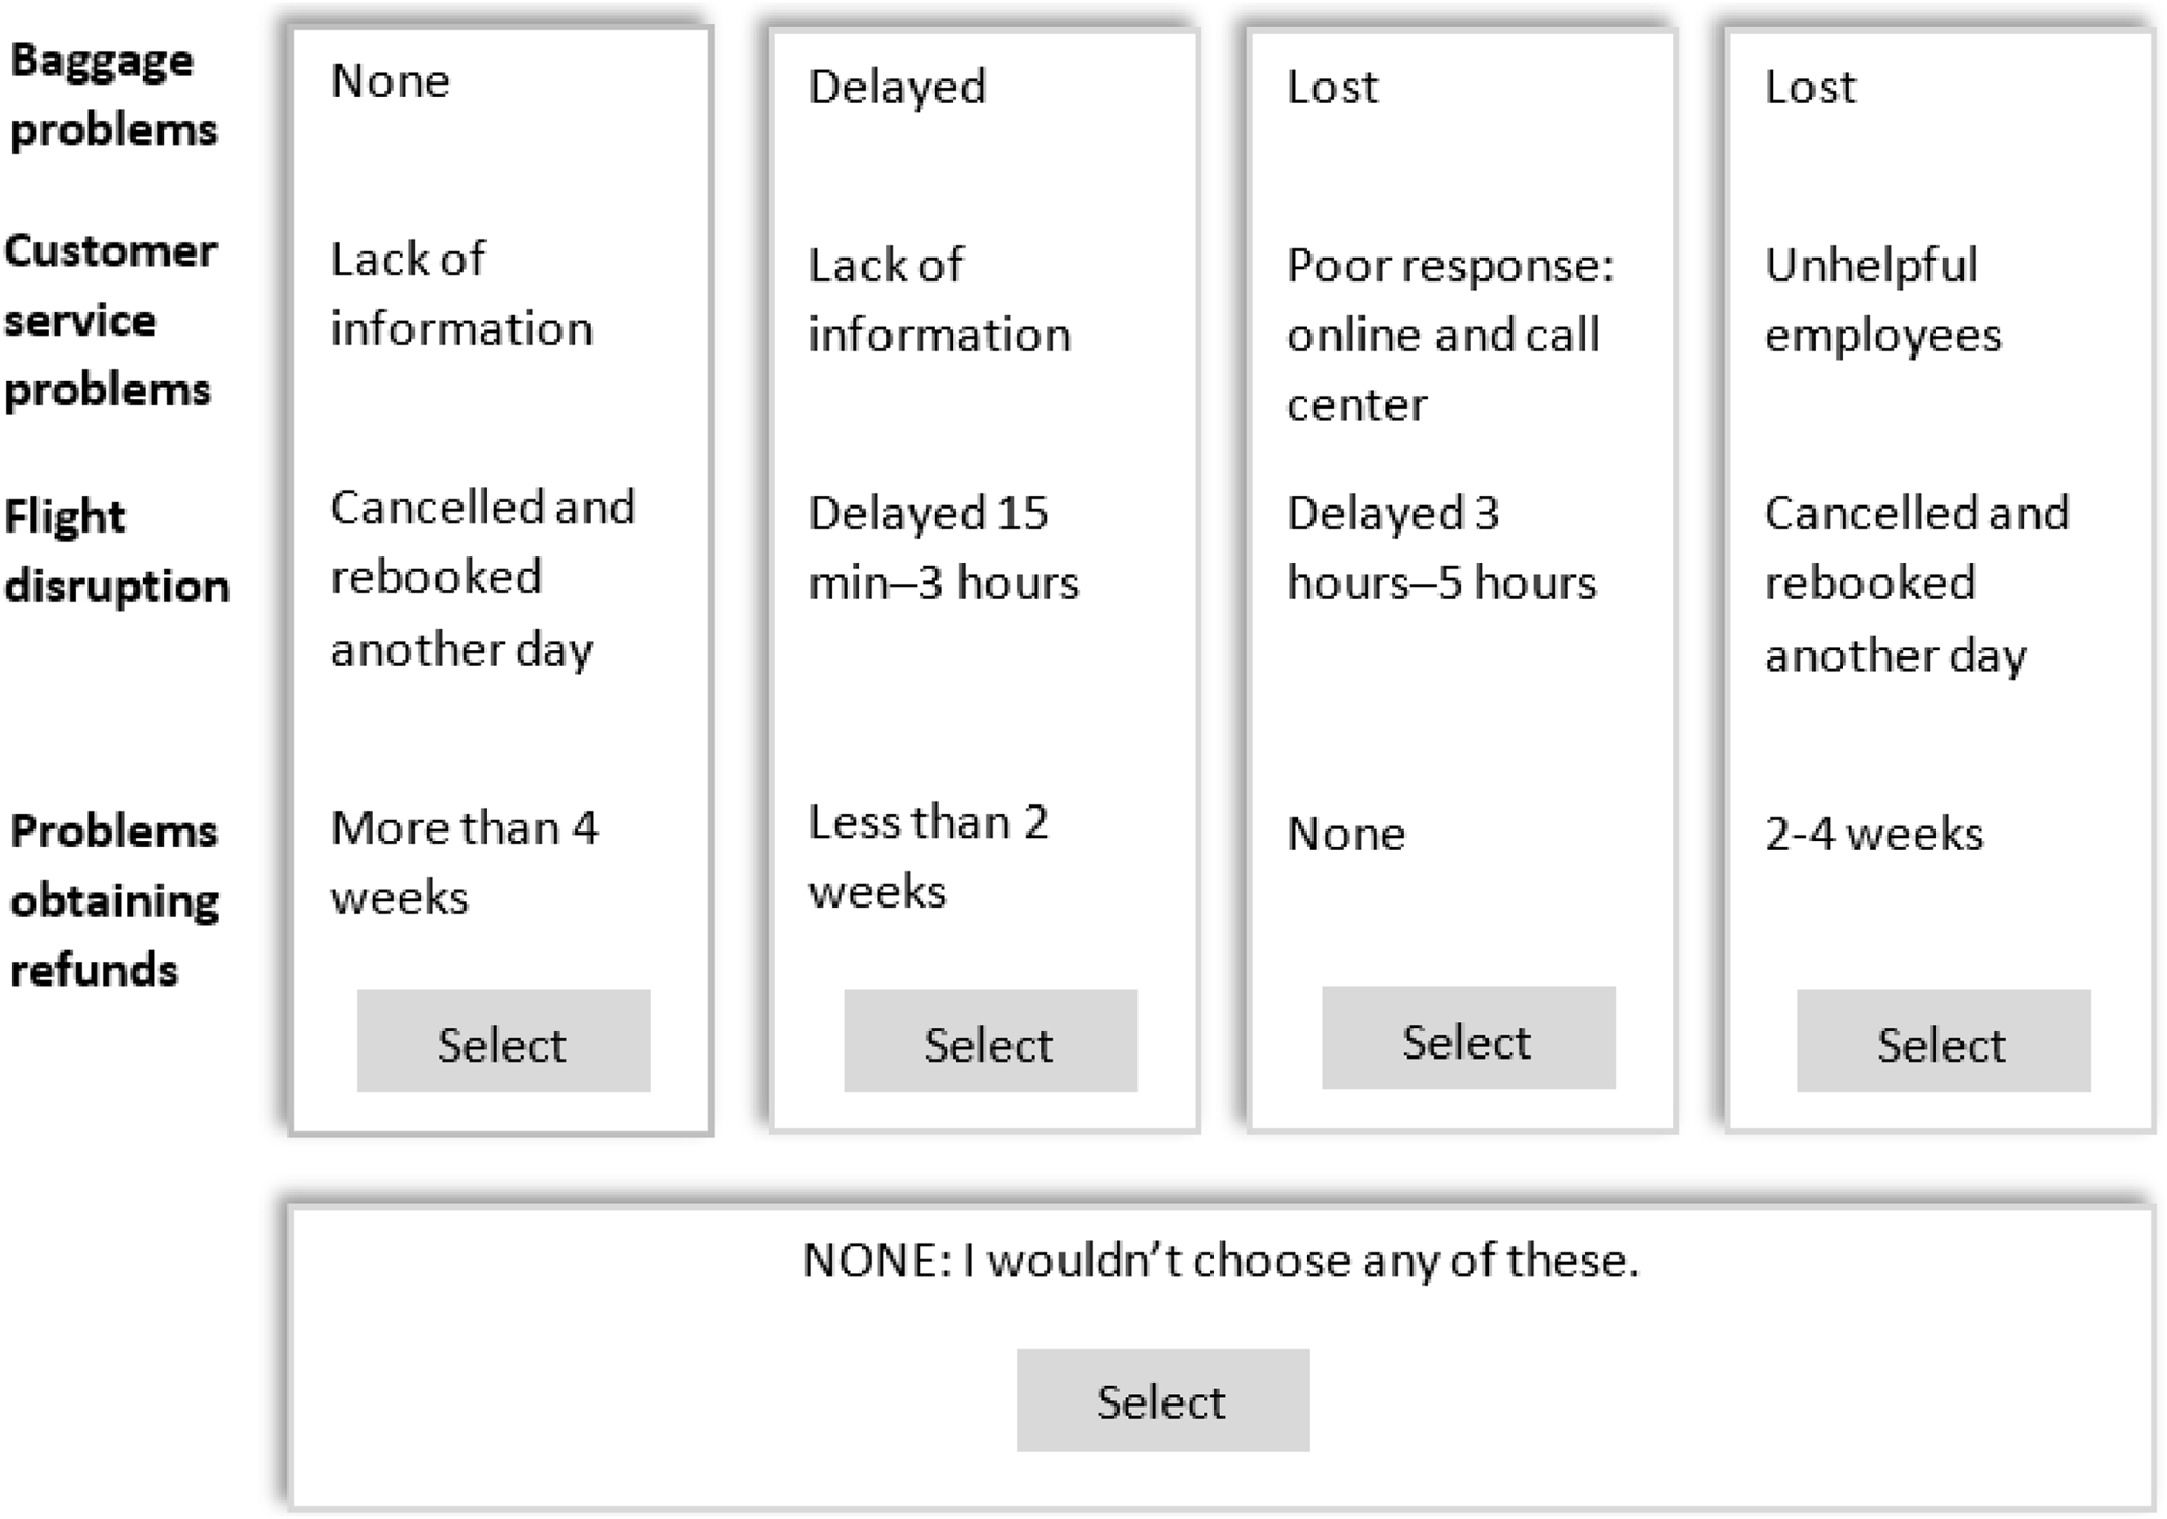
3.2.1Choice-based conjoint design and data collectionThe CBC design approach has been employed in the aviation sector to examine consumer preferences for various airline services (e.g., Bassig & Silverio, 2016). Sawtooth Lighthouse Studio 9.8.0 was used to create the CBC experiment. The survey was pre-tested with 20 participants and then disseminated through Amazon Mechanical Turk (Mturk). Only Mturk super-users with a 95% performance record were able to take the survey to enhance the experiment's validity. Moreover, the survey ended with termination questions to exclude any robotic speculations. Two instructional manipulation checks (IMCs), also known as screeners, were implemented to ensure consumer attention throughout the study. Instead of filtering out non-attentive participants, a training approach (Oppenheimer et al., 2009) was used to compel all participants to pay attention to the survey. Concerns regarding Mturk's validity have been addressed by Thomas and Clifford (2017). The survey contained 12 choice-based tasks and 13 background questions. Each task included four options built up by combining the different attribute levels. A “none” option was included to achieve a more realistic choice scenario. Please see Appendix A for an example of a choice task.
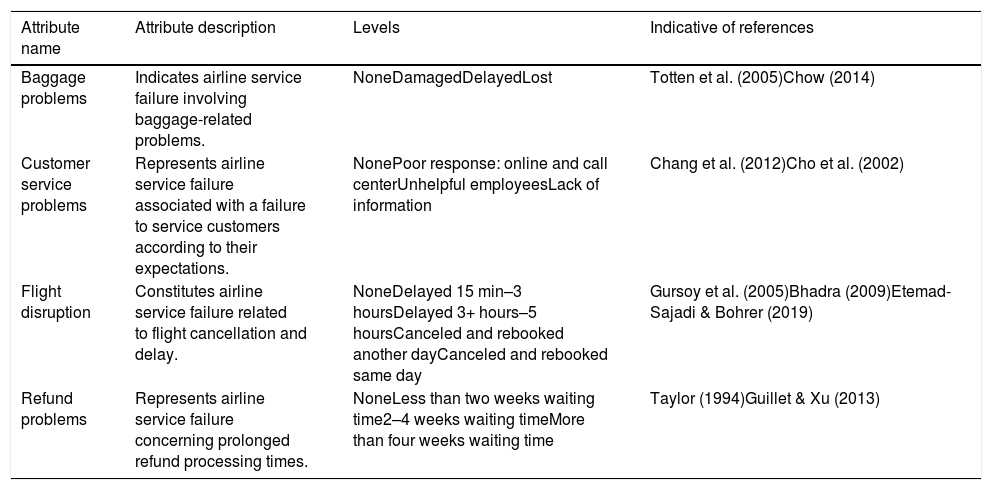
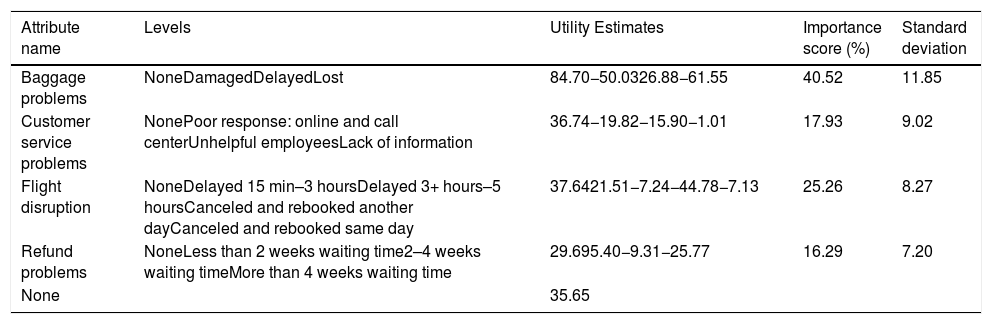
The service failures (attributes) were based on the findings from Study 1; baggage problems, flight disruptions, customer service failures, and refund problems. Table 2 presents a description of the attributes and their levels. The attributes were based on service failures reported from the US Department of Transportation and airline rules and industry regulations such as Regulation (EC) No 261/2004 (European Parliament & European Council, 2004). Table 3 shows the utilities and importance related to different service failures.
Attributes and levels for the conjoint analysis survey.
| Attribute name | Attribute description | Levels | Indicative of references |
|---|---|---|---|
| Baggage problems | Indicates airline service failure involving baggage-related problems. | NoneDamagedDelayedLost | Totten et al. (2005)Chow (2014) |
| Customer service problems | Represents airline service failure associated with a failure to service customers according to their expectations. | NonePoor response: online and call centerUnhelpful employeesLack of information | Chang et al. (2012)Cho et al. (2002) |
| Flight disruption | Constitutes airline service failure related to flight cancellation and delay. | NoneDelayed 15 min–3 hoursDelayed 3+ hours–5 hoursCanceled and rebooked another dayCanceled and rebooked same day | Gursoy et al. (2005)Bhadra (2009)Etemad-Sajadi & Bohrer (2019) |
| Refund problems | Represents airline service failure concerning prolonged refund processing times. | NoneLess than two weeks waiting time2–4 weeks waiting timeMore than four weeks waiting time | Taylor (1994)Guillet & Xu (2013) |
Utilities and importance related to different service failure.
Note. Sample of 502 participants. Aggregated logit estimated with a Hierarchical Bayes estimation.
The participants were a random sample of 502 individuals who completed the survey with an almost even gender split (56.4% females, 43.4% males, 0.2% other). The sample size was modified by removing participants who never flew (6) and those who dropped out of the survey (34). The largest age category was the 25–34 years age group (39%), followed by the 35–44 years group at 28%, the 45–54 years group at 13%, and the combined 18–24 and 55+ years groups at 20%.
3.2.2Results and discussionThe CBC results were analyzed using a Hierarchical Bayes estimation (e.g., Lenk et al., 1996). Table 3 shows the conjoint average utilities and attribute importance along with the standard deviation. The baggage problems service attribute had the highest attribute importance (40.52), indicating that participants were most sensitive to this service failure. The level lost baggage problem had the highest negative utility estimate (−61.55).
3.3Study 3: interviews with customers who have complained about lost baggageDrawing on the results from Study 2, we conducted Study 3 to provide a deeper understanding of how airlines could respond to customers who complain about losing baggage. The purpose was to gather personal accounts of frequent airline travelers who experienced service failure with an airline and voiced their dissatisfaction. Thus, Study 3 enabled us to identify service recovery attributes in situations involving lost baggage, including compensation type, interaction type, complaint process information, and airline response initiation.
3.3.1Means-end chain and laddering approachStudy 3 used the means-end chain approach (Grunert & Grunert, 1995) with the laddering technique to identify the service recovery attributes for lost baggage and the related consequences and values. We selected eight frequent airline travelers who had previously voiced their complaints with an airline (the middle tier airline) of their choice. We used semi‐structured interviews with open-ended questions concerning participants’ general preferences toward compensation when exposed to a complaining scenario. Interviews were conducted in December 2019. Each participant was asked to imagine a scenario (read to them by the interviewer) in which they experienced a lost baggage problem while traveling with an airline. They filed a complaint and complained on social media as they waited to be compensated by the airline. All interviews were recorded, transcribed, and coded according to the laddering technique (Gutman, 1982). The participants’ demographic profile consisted of two females and six males, 47–70 years old. Five of the participants were from Europe, while three were from the United States. Our aim with this study was to provide insights from actual customers who had experienced the scenario of losing baggage and complaining to the airline. These narrow criteria made it difficult to access the right participants, but we successfully recruited well-qualified participants for the interviews.
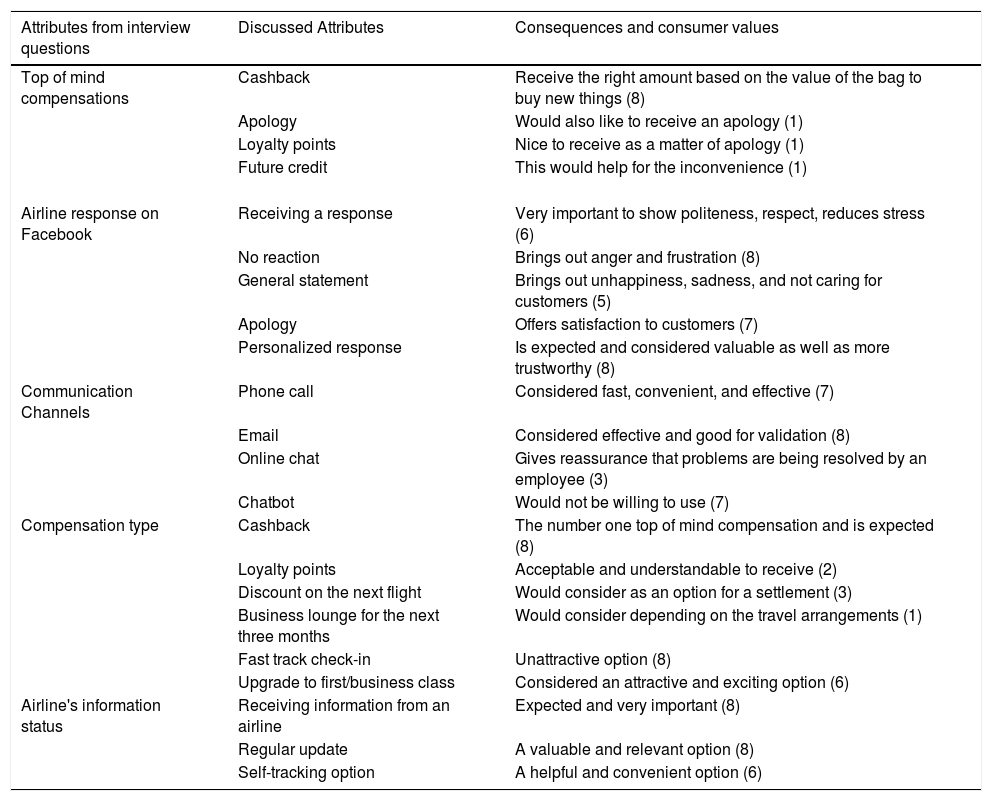
3.3.2Results and discussionTable 4 shows the main results from the laddering analysis based on the interviews. Further, it shows the service recovery attributes mentioned by the participants (discussed attributes) and the consequences and values that consumers attach to them. In line with Roschk and Gelbrich (2014), all participants preferred to be compensated with cashback after losing baggage. Based on the participants’ insights, they perceive a certain value to their baggage, because losing a bag can create costs in the form of time and effort, and irreplaceable psychological costs (de Ruyter & Wetzels, 2000). Other delayed monetary compensation, such as receiving a class upgrade, seemed valuable for six of them. All participants expected and valued receiving information and regular updates from the airline. In line with findings in the literature (e.g., Ozuem & Lancaster, 2013), customers seemed to dislike automated emails and would preferably have personalized contact when communicating with firms online. In terms of communication channels, a phone call and email were the participants’ preferred choices. All participants except for participant A would have liked to communicate with the airline by phone. He said, “If it were 30 years ago, I would have called, but now I use email for accuracy”.
Laddering analysis built on participant interviews.
Note. Numbers in brackets translate as number of participants, e.g., (1) is one participant, (2) are two participants etc.
As indicated above, we focused on quantitatively investigating the role of the attributes identified in Study 3 in recovering from a high-magnitude service failure by examining how the attributes affect customers’ utility and determining the level of importance of the attributes.
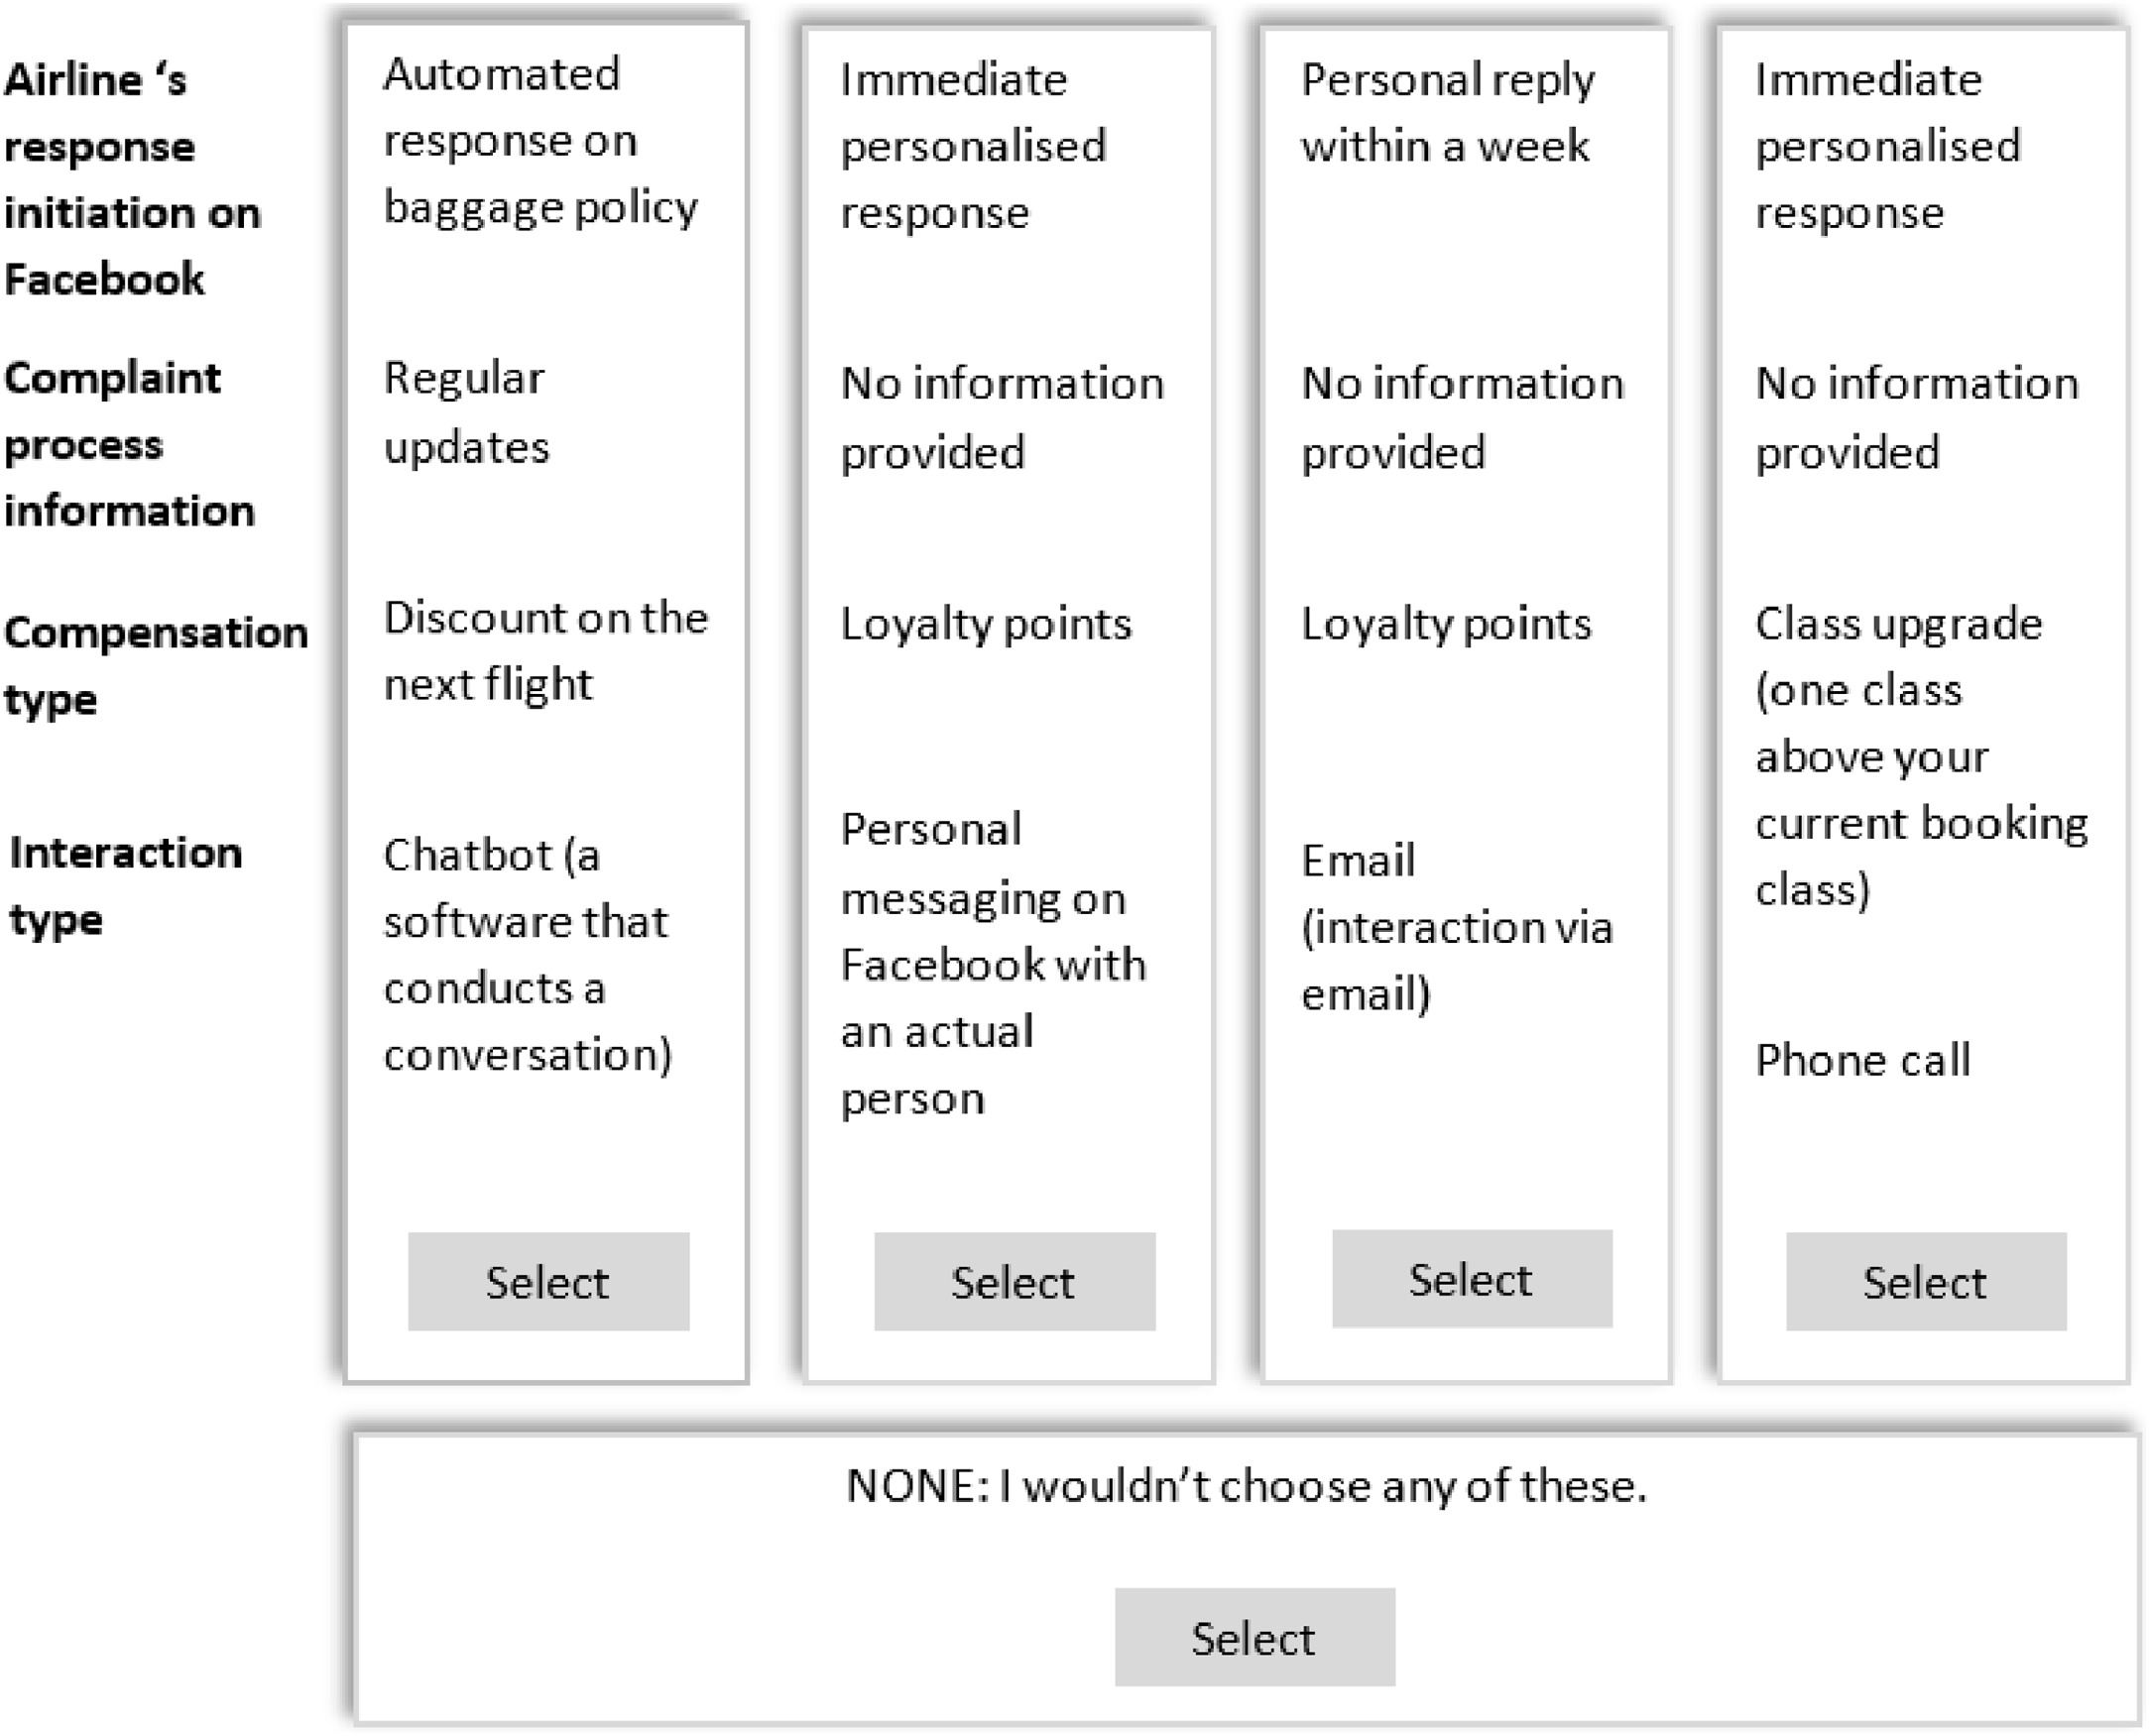
3.4.1DesignAkin to Study 2, Study 4 used CBC design to examine the role of attributes relevant to service recovery. The survey consisted of two parts. In the first part, the importance of specific attributes related to customer complaints in the air transport industry was evaluated. Here, the participants were provided with different scenarios concerning the complaint process and resolution. We tested four service recovery attributes: airline response initiation on Facebook, interaction type, compensation type, and complaint process information. In the second part, the consumers answered questions about travel frequency, complaint resolution, and demographics.
The study consisted of four attributes and their related levels. The attributes and levels together constituted a 3 × 4 × 5 × 3 design. There were 16 choice tasks. Each task consisted of four choices and an alternative (Appendix B). The participants were asked to select the most attractive concept for each task. The service attributes were randomized within a concept, and the attribute list was randomized once per respondent to control for order effects. Four instructional manipulation checks were implemented throughout the study to ensure respondent attention. These checks employed a training approach.
3.4.2Data collectionThe data was collected through an online CBC experiment consisting of 2050 participants (41% male, 58% female, 1% other) using the Mturk crowdsourcing service. The largest age category was the 25–34 years age group (37%), followed by the 35–44 years group at 25%, the 18–24 years group at 14%, the 45–54 years group at 13%, 55–64 years old at 8% and 65+ at 3%.
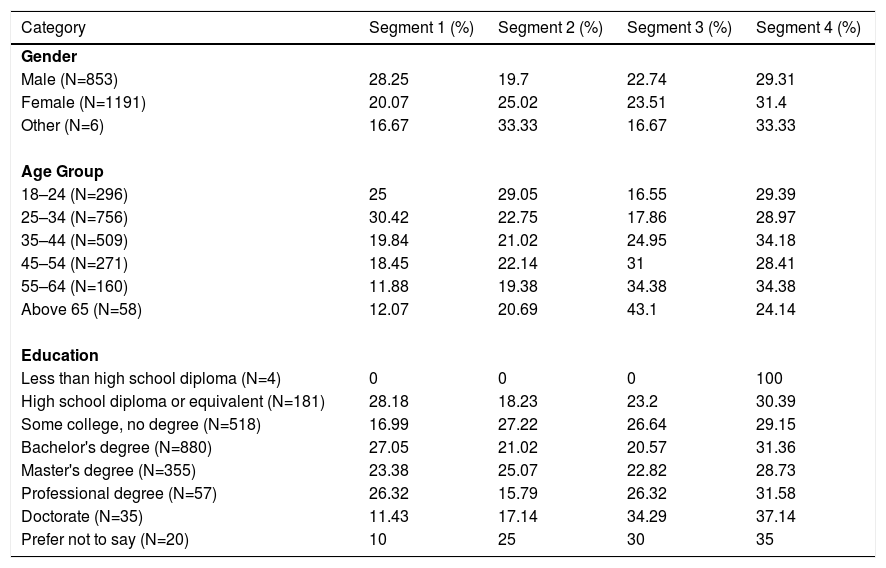
3.4.3Results and discussionA CBC analysis with latent class segmentation was conducted to identify the consumer segments. Solutions were computed for five segments, and this computation was re-run five times, each time estimating solutions from two to five segments from different starting points. For each segment, the solution with the highest Chi-Square value was retained. Consistent Akaike Information Criterion (CAIC) measure (Ramaswamy et al., 1993) was used to identify the correct number of segments, in this case, four. The part-worth utilities for each group were rescaled to make them comparable to interpret differences from group to group. Demographic data can be seen in Table 5.
Profiling information for the segments in terms of gender, age group and education.
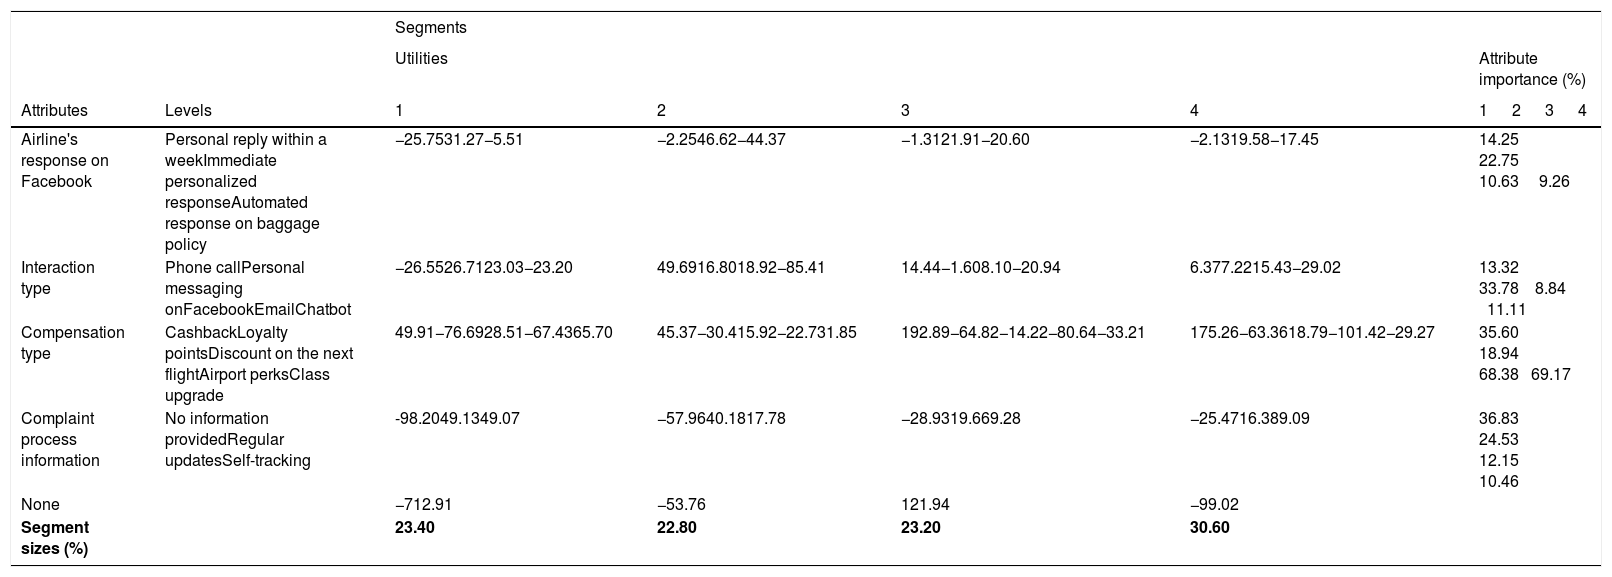
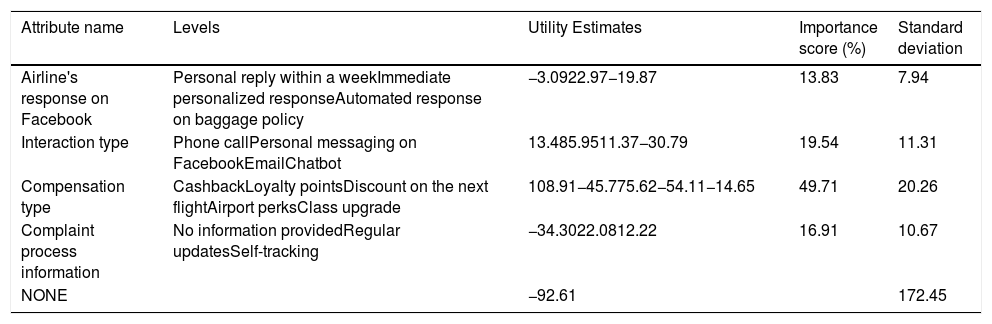
Table 6 shows four distinct consumer segments based on the utility estimates and the relative importance of the service attributes. The aggregated results for all participants show that the most important service recovery attribute was compensation type (see Appendix C for overall attribution importance).
Latent class segmentation on service recovery attributes and levels.
Note. Sample of 2,050 participants. Utilities estimated with Hierarchical Bayes estimation model.
The participants in Segment 1 prefer the immediate personalized response (31.27). For the interaction type attribute, the participants in this segment prefer personal messaging on Facebook (26.71). For the compensation type attribute, the participants like a class upgrade (65.70), and for the complaint process information attribute, they prefer the regular updates (49.13). Other airport perks (−67.43) and loyalty points (−76.69) do not interest them. Table 5 shows profiling data in terms of gender, age, and education. This data shows that Segment 1 is, on average, younger than other existing segments.
Similarly, participants in Segment 2 are more drawn to personalized, immediate response (46.62), particularly through a phone call (49.69), and dislike chatbots (−85.41). They prefer cashback (45.37) and, akin to Segment 1, are not excited about loyalty points (−30.41) and other airport perks (−22.73). Like Segment 1, they are more interested in receiving regular updates (40.18) than using a self-tracking option.
Segments 3 and 4 want to receive an immediate personalized response with utility scores of 21.91 and 19.58, respectively. Cashback is their number one choice of compensation (192.89 and 175.26, respectively), and they receive regular updates in the complaint process (19.66 and 16.38, respectively). Segment 3 would like to interact with airlines through a phone call (14.44), whereas Segment 4 would prefer email (15.43). A Pearson's chi-square test of independence was used to evaluate whether the age, gender, and education level were related to the segments. The tests indicated that age, χ2 (15, n = 2050) = 86.96, gender χ2 (6, n = 2050) = 21.75, and education level χ2 (21, n = 2050) = 48 had a statistically significant (α = 0.05) association with the segments, although the effect sizes were small for age (Ø = 0.21), gender (Ø = 0.10), and education (Ø = 0.15).
4General discussion4.1Research and managerial implicationsOur contribution to the literature addresses the shortcomings of the existing literature by considering the complaint process as a unit of analysis, as Van Vaerenbergh et al. (2019) suggested.
Our results suggest that airline customers use social media to express their problems and dissatisfaction regarding service failures in line with previous literature (e.g., Einwiller & Steilen, 2015), despite some differences between the airlines regarding the number of complaints posted on their Facebook pages and how they respond to the complaints. We also find the complaints posted on airlines’ social media sites to be similar to the causes of complaints reported by the US Department of Transportation (2019). Complaint handling strategies have received limited attention in the literature, especially of quantitatively determining the relative importance of different types of responses (i.e., service recovery attributes) in influencing customers’ willingness to fly again with an airline. Being the first to investigate this issue, our results suggest that customers generally place high importance on service recovery attributes representing compensation and interaction types. As expected, our results also show that the most important service failures include lost/damaged baggage and flight disruptions (Totten et al., 2005; Chow, 2014; Etemad-Sajadi & Bohrer, 2019).
Further, the findings show that customers prefer to interact with the airline and obtain information about the complaint process. Airlines should identify relevant interaction and communication modes, which should satisfy how customers prefer to interact. Our results suggest that airlines’ initial response to complaints on social media concerning a severe service failure (lost baggage) should be immediate and personalized as consumers derive higher utilities from such responses relative to, for instance, automated responses. This finding is in line with the general literature on response speed (e.g., Stevens et al., 2018; Kelleher & Miller, 2006) and the effects of a personalized response (e.g., Ozuem & Lancaster, 2013; Abney et al., 2017). Airlines should test the adoption of new technology and think about their value in terms of customer benefits. Redirecting the complainant away from the social media site is a rather common social media strategy (Einwiller & Steilen, 2015), but relying on bots and artificial intelligence in following up complainants can easily backfire. We find that compensation is the most important attribute when consumers face a scenario involving lost baggage. As expected, the consumers derive higher utilities from immediate financial compensation, and cashback than other compensation alternatives. This finding is in line with Roschk and Gelbrich (2014), who suggest that immediate monetary compensation is best in cases of a monetary failure. Regarding the complaint process, customers place positive preferences on obtaining regular updates, or track the baggage status.
However, the segmentation analysis reveals heterogeneity in customers’ preferences, with some focusing on compensation. In contrast, others attended to interaction modes or the possibility of monitoring the complaint process when choosing between service recovery options. While some of our results regarding the importance of phone calls and emails are similar in spirit to the previous literature (e.g., Shapiro & Nieman-Gonder, 2006), the other results provide new information. For instance, two out of four segments preferred to interact via phone, while Segment 1 preferred to interact on Facebook, and Segment 4 wanted email communications. This finding reveals modern service recovery challenges and fragmented preferences. Segment 1 differs from other customers in terms of having a preference for a class upgrade as a type of compensation. These findings support a small generation gap as these customers tend to be younger than customers who prefer traditional interaction modes such as phone calls and emails (Segments 3 and 4).
An important managerial implication of the results is that customers seek continuous interactions with the airline in high-magnitude service failures. Airlines may be forced to establish self-service portals, allowing customers to track complaint processes. This finding also implies that technologically driven interaction approaches can be effective in recovering service failures, something not reported in the literature but with implications and a benchmark for further research as the acceptance might increase or change with time. The managerial implication of the current research is also that satisfaction with using technology when interacting is segment-dependent. Overall, our findings suggest that older and more educated customers tend to favor traditional communication modes, while young and less educated customers seek social media and technology-oriented communication modes. But, this is still rather mixed based on demographics and difficult to rely only on such things as gender, age or education for segmentation purposes in this regard. Airlines seeking satisfied customers should stay away from relying only on one mode of interaction and on socio-demographic segmentation alone. Understandably, costs should also be considered, but that has not been the focus of the current research. Thus, with multiple communication modes, an omnichannel strategy can help airlines ensure a consistent level of service across all points. For instance, customers in general dislike using a chatbot when experiencing a severe service failure when traveling with an airline. However, the speedy service that chatbots provide could be favourable when undergoing a service failure of a lesser magnitude. Young customers tend to dislike chatbots less, but communication through email would overall be better received, with personal messaging on Facebook being the second choice. It is important to derive relative preferences instead of basic expressed opinions. Piñeiro-Chousa et al. (2020) have emphasized innovation, entrepreneurship, and knowledge and point out how using the three collectively can influence the growth of companies’ competitive advantage. Innovation in recent years in the development of new technology has disrupted the former ways of dealing with service failures and compensations. We encourage other researchers to look at our findings as a benchmark for more research that can be built using similar service profiles to estimate underlying utilities as benefits, or partworths, for monitoring and tracking interaction and compensation processes. Currently, it might be that the technology tested does not have the necessary properties and benefits needed in this setting, or that customers have not been properly taught to use the technology. That is, customer education, learning and value gives ample research opportunities in this respect. It is important for airlines to gain a firm grip on customer profiling and customer management to be able to create and maintain positive relationships with social customer care. Using the current research results, airlines can engage in more appropriate conversations with their customers built on their individual benefits and preferences. The emphasis should be on derived customer values instead of ex-post analysis of socio-demographic data as different types of customers combine the segments. Future research could continue to rely on value based segmentation as derived, for instance from CBC analysis, instead of absolute questions and/or demographics, as our findings show that identical customers in terms of gender or age, tend to have different value systems.
5ConclusionThe overall aim of this research has been to gain new and relevant insights that better inform companies on how to respond to the growing number of complaints that consumers post directly on companies’ official social media pages. Our contribution to the literature lies in addressing how consumers prefer to be treated when posting social complaints by considering the complaint process as a unit of analysis from the complaint to the response.
In general, our findings suggest that companies should keep customers updated with relevant information in the complaint process and that their initial response to the type of complaint posts on Facebook should be immediate and personalized and not in the form of an automated reply. We find compensation to be the most important attribute among all the complaint handling attributes. We also find that consumers seem to have the greatest preferences for immediate monetary compensation, cashback in particular, when faced with a situation in which the airlines have lost their baggage. Our findings suggest that consumers have different preferences for the type of interaction when being invited for a personal conversation concerning the complaint. However, in general, they seem to prefer an authentic dialogue (e.g., phone call and email) over solutions based on artificial intelligence (AI) such as chatbots. Since the use of AI-powered chatbots for interacting with customers on social media is increasing, some caution should be exercised in the use of bots, especially in cases where consumers show clear preferences for more authentic interaction.
5.1Limitation and further researchCustomers and airline companies may have different views regarding how to recover a failed service. In this study, we only looked at the customer's perspective. Future studies can extend our contribution by gathering information from airline managers. Furthermore, in Study 4, the attribute level immediate personalized response can be somehow difficult for the respondents to make trade-offs against the other attributes, as it consists of two things: immediate and personal. For instance, respondents may not evaluate the attribute levels, personal reply within 4 weeks, immediate personalized response, and personal messaging on Facebook differently because all are personalized in one way or another, notwithstanding differences in time length. However, our results suggest that the respondents made trade-offs among these levels, but future studies can employ a CBC design to address such limitations. While our segmentation analysis enables us to profile customers according to their age, gender, and education levels, we cannot examine the influence of psychological constructs such as attitudes, perceptions, and beliefs on customers’ preferences for service recovery attributes. Future studies can investigate this. Finally, future studies can replicate our CBC studies using data categorized by airline type (e.g., low-cost versus high-end airline).
This work was supported by a grant from Reykjavik University to Valdimar Sigurdsson and R. G. Vishnu Menon.
The authors thank Freyja Thoroddsen Sigurdardottir, Michal Folwarczny, and Joseph Karlton Gallogly, at the Reykjavik University Centre for Research in Marketing and Consumer Psychology, for their assistance


See Table C.1.
Utility estimates and importance of attributes on service recovery.