


This study introduces an innovative automated model, the Scientists and Researchers Classification Model (SRCM), which employs data mining and machine-learning techniques to classify, rank, and evaluate scientists and researchers in university settings. The SRCM is designed to foster an environment conducive to creativity, innovation, and collaboration among academics to augment universities’ research capabilities and competitiveness. The model's development roadmap, depicted in Figure 1, comprises four pivotal stages: preparation, empowerment strategies, university-recognised research ID, and evaluation and re-enhancement. The SRCM implementation is structured across three layers: input, data mining and ranking, and recommendations and assessments. An extensive literature review identifies ten principal procedures further evaluated by experts. This study utilises Interpretive Structural Modelling (ISM) to analyse these procedures’ interactions and hierarchical relationships, revealing a high degree of interdependence and complexity within the SRCM framework. Key procedures with significant influence include determining the input data sources and collecting comprehensive lists of university scientists and researchers. Despite its innovative approach, SRCM faces challenges, such as data quality, ethical considerations, and adaptability to diverse academic contexts. Future developments in data collection methodologies, and addressing privacy issues, will enhance the long-term effectiveness of SRCM in academic environments. This study contributes to the theoretical understanding of academic evaluation systems and offers practical insights for universities that aim to implement sophisticated data-centric classification models. For example, by implementing data-centric models, universities can objectively assess faculty performance for promotion or tenure. These models enable comprehensive evaluations based on publication records, citation counts, and teaching evaluations, fostering a culture of excellence and guiding faculty development initiatives. Despite its limitations, SRCM has emerged as a promising tool for transforming higher education institutions’ academic management and evaluation processes.
The classification of scientists and researchers is a fundamental aspect of academic institutions’ organisational structure. It delineates various levels of expertise and experience within the academic community, providing a framework for evaluating and recognising contributions to research and scholarship. Publication and citation metrics play a significant role in evaluating the productivity and impact of scientists and researchers. Metrics like the h-index, introduced by Hirsch (2005), and journal impact factors (IF), as discussed by Lippi and Mattiuzzi (2017), are commonly used to assess research output and influence. These metrics contribute to the classification process by providing quantitative measures of scholarly achievement, aiding in tenure decisions, grant proposals, and awards nominations.
The publication of scientific research is a cornerstone of knowledge dissemination, playing a pivotal role in scientific and academic evaluation, fundraising, and career progression. This assertion is supported by extensive research, including Abbott et al. (2010), Honavar and Bansal (2022), Lippi and Mattiuzzi (2017), and Usman et al. (2021). Publishing is particularly important in developing countries. The intricate interplay between the academic sphere and political dynamics often hinders the adoption of internationally recognised standards in awarding academic and scientific titles. This challenge has been extensively documented in the studies by Zerem (2013, 2014, 2017) and Zerem et al. (2021).
In various academic circles, the utilisation of dependable scientific metrics to evaluate the merits of individual contributions by scientists is of significant importance. Indeed, the assessment of such contributions is considered a scientific endeavour (Honavar and Bansal, 2022; Van Noorden, 2010; Thwaites, 2014). Beyond scrutinising scholarly publications, diverse scholarly pursuits indicate scholarly credibility. These pursuits include factors such as the quantity and calibre of external grants secured, leadership roles in national or international academic societies, participation in the editorial boards of esteemed journals, involvement in government-sponsored national peer review committees, number of successfully supervised PhD students, and extent of coverage in mainstream journalism. While these activities contribute to gauging a scientist's credibility, pertinent scientific metrics primarily focus on publication regulations and overlook other science-related criteria that typically influence scientists’ promotions and tenure evaluations (Zerem, 2017; Zerem et al., 2021). This limitation arises from the heterogeneous nature of these activities, with each possessing distinct characteristics and necessitating diverse criteria for evaluation (Zerem, 2017; Zerem et al., 2021).
No universal evaluation criteria exist for these scientifically relevant parameters, and their values are assessed individually, depending on the purpose of the evaluation. According to researchers in the field (Gao et al. (2016), Garfeld (1955), Hirsch (2005), Van Noorden, 2010, Senanayake et al. (2015), Stonehill (1965), Sugimoto and Larivière (2017), Thwaites (2014), Zerem (2014, 2017) and Zerem et al. (2021)), the most prevalent approach in scientific metrics typically involves the utilisation of several key indicators, including the H-index, Impact Factor (IF), and the total number of citations. The H-index is used to measure the impact of an individual researcher by balancing the number of publications with the number of citations received. The IF evaluates the importance of a journal by calculating the average number of citations of recent articles published in that journal (Kavic and Satava, 2021). The total number of citations is a straightforward count of the number of times others have cited a researcher's work. These metrics, each with its own unique focus, collectively contribute to assessing the impact and quality of scientific research. In addition, Institutional Key Performance Indicators (KPIs) for academic staff serve as benchmarks for evaluating their overall contributions within an institution (Amoah and Minishi-Majanja, 2022; O'Connell, 2022). These KPIs typically encompass research productivity, teaching effectiveness, service and engagement, and professional development (Christensen et al., 2020; Gee and Cooke, 2018). Research productivity involves metrics such as publication output, citations received, research funding secured, and patents filed (Carpenter et al., 2014). Teaching effectiveness is evaluated through student satisfaction, retention rates, graduation rates, and teaching evaluations (Bini and Masserini, 2016). Service and engagement metrics assess participation in committees, community outreach, leadership roles, and collaboration with external partners (Weerts and Sandmann, 2010). Additionally, professional development indicators include attendance and invitations at professional events and conferences, completion of education programs, mentorship activities, and recognition received (Cornelius et al., 2020; Keyser et al., 2008). These KPIs collectively offer a comprehensive view of an academic staff member's performance, reflecting their multifaceted academic contributions to research, teaching, service, and professional growth within the institution.
Additionally, citation analysis plays a crucial role in evaluating an individual's research performance in the academic community, making it a major tool in metrology (Aksnes et al., 2019; Bornmann, 2017; Bu et al., 2020; Cronin et al., 1997). In addition to citations, the number of publications and H-index are widely used indices in the research evaluation process (Honavar and Bansal, 2022). For a comprehensive and equitable evaluation of individuals within universities or institutions, as well as by funding bodies and the broader scientific community, scientometric criteria must consider the specific field, discipline, and temporal context of the research. As emphasised by Honavar and Bansal (2022), Usman et al. (2021), and Waltman (2016), this nuanced approach ensures a more accurate and fair assessment. By considering these factors, evaluations can more effectively reflect the unique challenges and dynamics inherent to different scientific disciplines and the evolution of research impact over time. However, the proliferation of scientific databases and libraries such as Google Scholar, Scopus, Web of Science (WoS), Dimension, and PubMed has been rapid and extensive. Consequently, selecting the most suitable database for research has become increasingly complex. This challenge has been well documented in studies by Bakkalbasi et al. (2006), Falagas et al. (2008), Martín-Martín et al. (2018a, b), Meho and Yang (2007), Mongeon and Paul-Hus (2016), Singh et al. (2021), and Visser et al. (2021). Each database offers distinct features and covers different scopes of the literature, making the decision-making process more intricate and demanding careful consideration by researchers.
Over the past decade, higher education has seen widespread publications on different university rankings, including information on research findings (Aguillo et al., 2006; Buela-Casal et al., 2007; Kwiek, 2021; Wilbers and Brankovic, 2021; Williamson et al., 2020). In the realm of bibliometrics, the current era can be aptly termed the ‘Classification Culture’. Classification undeniably represents a cornerstone of bibliometric studies and reports (Fasi, 2023). It is vital for distilling and presenting simplified yet crucial information on leading entities within specific scientific disciplines. This widespread reliance on classification underscores its integral role in shaping the current understanding of scientific impact and progress. However, the widespread use of this classification system does not overshadow its inherent limitations. It is imperative to critically approach the interpretation and design of bibliometric classifications. As highlighted by Gadd (2021) and Van Ran (2005), this approach involves acknowledging the potential biases and errors that may arise in classification systems and exercising caution in how these systems are constructed and read. The need for a nuanced understanding of these limitations is not just a matter of academic rigour; it is also essential to maintain the integrity and accuracy of bibliometric analyses.
Traditionally, when conducting research assessment exercises in scientometric studies, the predominant practice has been extracting research output data from one of the two widely recognised scholarly databases, WoS and Scopus. Extensive comparisons between the WoS and Scopus databases have been conducted, involving direct assessments of coverage (e.g., Gavel & Iselid, 2008; Mongeon and Paul-Hus, 2016; Singh et al., 2021) and citation comparison studies (e.g., Martín-Martín et al., 2018b). Numerous previous studies, including those mentioned above, consistently suggest that Scopus encompasses a broader range of journals than WoS, while the latter maintains a more selective approach to journal coverage.
In addition to these established databases, the Google Scholar database, which debuted in the same year (2004) as Scopus, has also been utilised in various bibliometric studies, although less frequently in research assessment exercises (see, for instance, De Winter et al., 2014; Falagas et al., 2008; Harzing and Alakangas, 2016; Mayr and Walter, 2007). Over the past few years, the bibliometric research community has witnessed the emergence of new databases, such as Microsoft Academic Search and Dimensions, which have garnered significant attention. In light of these developments, numerous studies (e.g., Harzing, 2019; Visser et al., 2019, 2020) have compared the article coverage of these new bibliographic data sources with established databases.
Presently, Clarivate Analytics owns WoS. According to the latest data from 2020, the WoS Core Collection encompasses over 74.8 million scholarly data and datasets, along with 1.5 billion cited references dating back to 1900, spanning 254 subject disciplines. The Science Citation Index Expanded (SCIE) covers 9200 journals across 178 scientific disciplines, totalling 53 million records and 1.18 billion cited references. The Social Sciences Citation Index (SSCI) includes 3400 journals across 58 social science disciplines, with 9.37 million records and 122 million cited references. The Arts and Humanities Citation Index (AHCI) indexes 1800 journals across 28 Arts & Humanities disciplines, comprising 4.9 million records and 33.4 million cited references. Despite significant growth in publication sources over the years, the SCIE, SSCI, and AHCI have maintained a selective approach to coverage, with indexing decisions made at regular intervals. When a journal is indexed by one of the citation indices, all articles become part of the WoS database. The WoS interface offers various data search and download facilities, providing users access to various fields. For basic usage, the downloaded data include approximately 68 field tags, including Publication Type (PT), OI (Orcid Identifier), and Document Type (DT) (Birkle et al., 2020).
Scopus extended its coverage to publication records dating back to 1788, adding approximately three million yearly records. The updated content coverage guide, last revised in October 2019, reveals that Scopus encompasses approximately 23,452 active journal titles, 120,000 conferences, and 206,000 books from over 5000 international publishers. It is important to note that the master journal list in Scopus includes entries from many journals, some of which are no longer active. In contrast to WoS, Scopus features a single citation index that spans journal and conference articles across various subject areas. As outlined in the Scopus content coverage guide, it comprises approximately 77.8 million core records (Baas, 2019; Singh, 2021).
The existence of many science metric systems indicates that no perfect scientific metric index accurately measures the scientific contributions of scientists and scientific journals (Singh et al., 2021). The most widely accepted parameters for assessing the significance of a scientific journal are the IF on WoS and the total number of citations received by articles published in the journal. However, evaluating an individual scientist's significance is more complex than assessing a scientific journal. The value of a researcher's scientific production cannot be gauged by the prestige of the journal in which the article is published (Zerem 2017). Several challenges complicate the evaluation of a scientist's significance and the value of their scientific output. Some authors may have a higher volume of published articles, and various types of articles may be published in journals indexed in different scientific databases. The limitations of using the number of citations of a specific article as a measure of its value include the time lag required and bias towards older articles of similar quality. In addition, the contributions of each author to a scientific article are often unequal. Consequently, finding appropriate measures and scientific criteria for objectively assessing new scientific research and providing accurate qualitative and quantitative data to evaluate new articles are formidable tasks. Unfortunately, the widely used H-index scientometric system does not resolve these challenges. The H-index only estimates the number of individual citations of an article and does not consider the individual contributions of each author. In the H-index system, all authors of an article are treated equally, which fails to address the persistent issue of expanding author lists with contributors whose impact may be minimal or non-existent (Zerem, 2017, 2018).
Furthermore, a novel criterion known as the Z-score has been introduced in the Journal of Biomedical Informatics, offering an objective means to estimate the scientific impact of both individual scientists and institutions (Zerem, 2017, 2018; Zerem and Kunosić, 2018). The Z-score involves the calculation of the author's overall academic score, which comprises two key components: the Author Contribution Score (ACoS) and the Author Citation Contribution Score (ACCS). The ACoS is determined by considering the scientific value of the journal in which an article is published and the specific contributions of the authors to that article. The ACCS is calculated based on the scholarly impact of a given article, measured by the number of citations received and the authors’ individual contributions to the article. A dedicated computer programme called Z-Calculator was developed to facilitate the application and computation of the Z-score. This tool incorporates all parameters outlined in the criteria and is tailored for use by professionals. The Z-score calculator is designed to be compatible with all browsers and is equipped with automated data collection capabilities when linked to the browser (Zerem, 2017; Zerem and Kunosić, 2018). This innovative approach aims to provide a comprehensive and automated means for assessing the scientific impact of scientists and institutions.
The aforementioned scientific metrics primarily evaluate the significance of scientific output through citation counts and may not comprehensively reflect a scientist's overall contributions. In addition, while it is widely acknowledged that academic excellence in teaching, practical activities, and scientific production should be the foremost criteria for academic appointments and promotions, the challenges lie in implementing suitable measures and scientific criteria for the objective assessment of scientific research. Using precise qualitative and quantitative data are essential for funding agencies to make informed decision-making (Charnley et al., 2017).
The existence of numerous scientific metric systems highlights the absence of a single scientific metric index capable of accurately measuring the scientific contributions of both researchers and journals. Current scientific metric systems have various shortcomings and are not ideal for the unbiased assessment of scientific research and the significance of scientists (Bornmann, 2017). However, the absence of internationally recognised scientific criteria in the evaluation of research leaves room for decision-makers within the academic community to subjectively adjust the criteria to levels they deem relevant without adhering to globally recognised standards (Wilson-Wilde, 2018). Therefore, there is a pressing need to apply internationally recognised scientific criteria in evaluating scientific research (Kowarsch et al., 2016). These criteria should be continuously improved to remain robust and reflective of the evolving landscape of scientific enquiries. Therefore, scientists and researchers must be classified according to scientific disciplines and international classifications.
To fill this gap, this study introduces a scientists and researchers classification model utilising data mining techniques and machine learning. This model aims to categorise, prioritise, and assess university scientists and researchers, thereby strengthening the competitiveness of research and innovation ecosystems and improving universities’ research and innovation systems and their competitiveness in scientific research. This comprehensive model provides an incubator environment that stimulates creativity, innovation, and cooperation between scientists and researchers to blend and expand their research knowledge and experiences. In addition, the model supports distinguished scientists with high impact and citations to enhance their contributions from scientific studies, patents, and qualitative intellectual products. It also highlights distinguished scientists in various fields to improve universities’ pioneering roles in transferring knowledge and technology. Also, we used the Interpretive Structural Modelling (ISM) to analyse these procedures’ interactions and hierarchical relationships, revealing a high degree of interdependence and complexity within the SRCM framework and to the best of our knowledge, there are no previous studies that have employed ISM (Kumar and Goel, 2022).
The remainder of the paper is structured as follows: Section 2 outlines the literature review in university scientists and researchers’ classification; Section 3 presents the proposed research approach for categorising, prioritising, and assessing university scientists and researchers; Section 4 explores the methods used for the data collection and analysis and introduces the detailed results obtained by employing the integrated ISM-MICMAC methodology. Section 5 discusses the interconnectedness of various procedures in forming the proposed model and introduces its theoretical contributions; and Section 6 concludes the paper.
Literature reviewMeasuring scientific performance is more complex and important than it may seem at first glance. Various measurement and comparison methods have been proposed; however, none are perfect. Different approaches have been explored regarding author ranking and expert findings.
This literature explores various thematic categories concerning the measurement of scientific performance and evaluation of researchers’ contributions (Wagner et al., 2011). It delves into seminal works such as PageRank algorithms, revolutionising web search engine technology. Additionally, researchers propose and refine bibliometric indicators like the H-index and PageRank-index to assess scholarly publication records and scientists’ impact comprehensively (Cronin and Sugimoto, 2014; Larivière et al., 2014). Beyond traditional metrics, alternative ranking methods tailored to specific needs emerge, such as the Mutual Influence-Based Rank and the O-index, emphasising collaborative contributions and significant research outcomes (Amjad et al., 2016). Furthermore, studies scrutinise the effectiveness of bibliometric indicators, highlighting the composite scoring indicator C as particularly effective for identifying recent Nobel laureates (Cortés and Andrade, 2022). These thematic categories encompass a diverse range of methodologies and approaches aimed at enhancing the evaluation of scientific performance and expertise. In the rest of this section, these thematic categories will be discussed in detail.
Web search engine algorithms and citation metricsA pivotal survey paper by Brin and Page (1998) offers a comprehensive overview of a large-scale web search engine, marking the first in-depth public description of such a system. The challenges in this context extend beyond scaling up traditional search methods to accommodate vast volumes of data. The need to leverage additional knowledge embedded in hypertext to significantly enhance search results is recognised. Brin and Page delve into the intricacies of processing unregulated hypertext collections, where content from diverse sources is intertwined, and anyone can publish freely (Brin and Page, 1998). Page et al. (1999) present PageRank, a pivotal approach employed by Google's search engine to rank web pages objectively and automatically. PageRank is a system designed to assess web pages based on human interests, effectively measuring web content's significance and relevance. This step is critical in the evolution of search engine algorithms, particularly in handling large-scale and dynamically evolving hypertext collections.
Some authors have introduced a novel index for assessing and comparing scholarly publication records known as the PageRank-index. This index incorporates a version of the PageRank algorithm and utilises paper citation networks in its calculation. PageRank, originally designed to model the behaviour of a random web surfer navigating the internet, is well-described in terms of a user exploring web pages. However, a typical internet user employing a search engine to find information may navigate from the current page to others through hyperlinks, which act as references to additional links or websites. PageRank simulates this behaviour by modelling a user who continues to click on successive links randomly. In contrast, the proposed PageRank-index acknowledges that the surfer may sometimes become disinterested and choose a random page based on categorisation rather than continuing in an infinite loop of clicking links. PageRank primarily assesses the quantity and quality of links to a page, providing an approximate measure of the resonance of a website (Page et al., 1999). However, Hirsch (2005) proposes the index h as an adapted method for evaluating scientific merit. Hirsch argues against determining the worth of scientists solely based on the number of publications, as is the case with the H-index, and emphasises the importance of evaluating the quality of their work. Hirsch's bibliometric indicator gives additional credit to authors who publish alone or in small collaborations, and it also allows co-authors to receive credit for their collaborative publications. This method provides a more nuanced and comprehensive evaluation of a scientist's contributions.
Costas and Bordons (2007) introduce one of the most widely used and simple methods for ranking scientists, known as the H-index. The H-index is considered reliable because it involves straightforward computations that rely on two key factors: the total number of citations an author's work receives and the author's rank. Despite its simplicity, the H-index has some limitations. Notably, it does not account for self-citations, potentially leading to index inflation if an author cites their work extensively. To address this limitation, Hirsch (2010) proposes an alternative bibliometric indicator, h, to address honorary authorship. This indicator gives more credit to authors who publish independently or in small collaborations while reducing credit to co-authors in larger collaborations. It aims to provide a more nuanced metric for distinguishing scientists with varying co-authorship patterns. It discourages honorary authorship while recognising the contributions of authors to smaller partnerships. The H-index considers the same publications when evaluating a scientist's independent research output. Amjad et al. (2015) suggest that authors’ considerations could depend on their collaboration patterns and that collaborations with renowned authors might enhance their influence. They propose a ranking method called Mutual Influence-Based Rank (MuInfc), which assesses the impact of authors, co-authors, and the presence of prestigious authors. The results obtained using MuInfc outperform existing baseline formulas. The authors analyse their positions by examining their own work and the influence of the work of collaborating authors. This approach offers a more comprehensive view of the author's impact, accounting for individual and collaborative contributions.
Alternative ranking methods and indicesDorogovtsev and Mendes (2015) argue that a researcher's merit should be assessed based on their most impactful results rather than simply counting the number of publications. This perspective challenges the commonly used H-index-based rankings. In response, they propose an alternative index-based ranking called the O-index. The O-index increases with an increasing average number of citations per paper, providing a more nuanced evaluation of researchers based on the impact of their work. According to the authors, the O-index offers a fair categorisation of good researchers and presents scientists with a natural and easily applicable ranking standard. In a related study, Pacheco et al. (2016) analyse the impact of various academic features on the rankings of prominent Brazilian academics across different fields of knowledge. Their focus includes a list of the country's most renowned scholars and an examination of the distribution of various academic areas throughout the country. The study characterises scholar rankings in different areas by assessing the distribution of each knowledge area and identifying the distinct academic characteristics associated with a scholar's ranking position. Notably, they observe interesting patterns, such as the dominance of physicists and health scholars in top-ranking positions. This study sheds light on the factors influencing academic rankings and variations across different knowledge domains.
Lü et al. (2016) introduce an operator H that serves as a connecting chain between various network indices such as degree, H-index, and coreness. Coreness identifies tightly interconnected groups within a network. Conversely, the H-index is a metric to assess an author's scholarly output and performance over time. These indices have traditionally been treated as unrelated; however, operator H establishes a connection between them. Notably, using the operator H to achieve coreness appears contrary to the common practice of iteratively removing nodes with degrees less than ‘k’, a technique often employed to identify a network's k-core. The k-core represents the maximum connected subgraph of a graph, where all vertices have a degree of at least ‘k’. Building on the H-index method, Yu et al. (2017) extend the application to a weighted network by considering edge weights to quantify links’ spreading ability. Similarly, Kumar and Panda (2022) propose an improved ‘WVoteRank’ method based on an extended neighbourhood concept. This method considers one- and two-hop neighbours in the voting process to identify influential nodes in a weighted network. WVoteRank is a semi-local method designed to comprehensively cover the neighbourhood of a node, providing enhanced consideration for identifying influential nodes in weighted complex networks and leading to an overall higher influence spread.
The ranking of authors and papers is a well-explored area in the literature, often relying on the number of citations to measure an author's scientific influence. Zhang et al. (2017) focus on young researchers who have recently published their first work. This study addresses the challenge of predicting the top ‘k’ per cent of researchers with the largest citation increments in a given year. The authors consider various characteristics that might influence an author's ability to rise quickly and develop an Impact Increment Ranking Learning (IIRL) algorithm. This algorithm utilises these characteristics to predict rising academic stars, emphasising the ranking of citation increments rather than predicting precise citation values. Fast-rising researchers are those who achieve relatively high citation increments over a short period. Similarly, Oberesch and Groppe (2017) identify the criteria for an advanced index and introduce a new index called Mf-index. The Mf-index integrates the advantages of existing bibliometric indicators while minimising their drawbacks. This index is a notable contribution that considers criteria such as career duration, publication and citation age, citation weights for various types of citations, fields of study, and number of co-authors. In their comparison with other bibliometric indicators, Oberesch and Groppe (2017) find that the Mf-index provides a better balance across different elements of research, resulting in a fair comparison of their performance. The introduction of the Mf-index represents an effort to enhance the accuracy and fairness of evaluating researchers based on a combination of factors.
Amjad et al. (2018) categorise existing algorithms into three main groups: link analysis, text similarity, and learning-based methods. Link analysis methods are exceptionally reliable for analysing node relationships in networks. They are beneficial for evaluating, retrieving information, and discovering knowledge across various types of networks. Link analysis methods can be executed in an unsupervised manner. This category includes techniques that calculate the rank of academic objects, such as authors, by considering the linkage structure of a relevant graph. Link analysis methods are further divided into two subclasses: iterative and bibliometric. Iterative methods involve multiple iterations to calculate authors’ ranks, whereas bibliometric methods depend on calculations involving bibliometric citations. Text similarity methods include approaches that consider specific text data to find related text and utilise these data for rank calculation. Text similarity methods effectively assess the similarity between textual content, enabling the ranking of academic objects based on textual information. Learning-based methods, such as machine learning and classification rules, are applied to estimate the ranks of academic objects. Learning-based methods leverage machine-learning principles to predict and assign ranks to academic entities. Each of these categories represents a distinct approach to ranking academic objects, offering various advantages and considerations based on the type of data and goals of the ranking process.
Zhao et al. (2019) have introduced Author PageRank (APR) as a tool to assess the academic impact of authors within a heterogeneous network. The network used in their approach represents interconnected nodes and links of different types. It includes two types of nodes, authors and papers, connected by two types of links: citation links between papers and authorship links between papers and authors. The APR method is designed to rank papers and authors simultaneously within a heterogeneous network. The authors apply the APR method to two large academic networks: one in the health domain and the other in computer science. In their experiments, APR outperforms ten other approaches, highlighting its effectiveness in providing more consistent ranking outcomes than alternative strategies. Additionally, the APR successfully differentiates award-winning authors from other ranking methods. In a related context, Amjad et al. (2020) discuss self-citation, a practice where authors cite their own previous work in a new publication. The authors emphasise the importance of self-citation for scientists to demonstrate their research progress by building upon their prior work. This practice helps avoid redundant explanations in the manuscript by referring to previously published materials. However, the authors note that while self-citation has a considerable impact on science, it also poses the risk of artificial manipulation and needs to be considered carefully within scholarly evaluation processes.
Kosmulski (2020) comprehensively analyses a large number of examples to conclude that no other bibliometric indicator places as many recent Nobel laureates in the top 6000 as the composite scoring indicator C. C is a scoring system proposed by Loannidis et al. (2016) and is not field-normalised, meaning that it does not adjust rankings based on specific scientific fields. In field-normalised indicators, the rankings of recent Nobel laureates are not significantly higher, and field normalisation might be more critical for particular disciplines, such as Economics, compared to Chemistry, Physics, and Medicine. Loannidis et al. (2019) have developed a publicly available database of 100,000 top scientists, providing standardised information on various bibliometric indicators, including citations, H-index, co-authorship-adjusted hm-index, and a composite indicator. Separate data are presented for career-long and single-year impacts, with metrics accounting for self-citations and ratios of citations to citing papers. Scientists are categorised into 22 scientific fields and 176 subfields with field- and subfield-specific percentiles. Kosmulski (2020) emphasises that recent Nobel laureates perform better in terms of the C indicator than any other bibliometric indicator. This study compares the achievements of 97 Nobel Prize-winning scientists in Chemistry, Economics, Medicine, or Physics to top non-Nobel scientists using various bibliometric indicators, including citations, the Hirsch index, highly cited papers, the number of publications, and the composite indicator C. The analysis reveals that recent Nobel laureates are more prominently represented among the top 6000 scientists when assessed using the C indicator compared to other bibliometric measures, such as the Hirsch-type index (excluding self-citations and not field-normalised), highly cited researchers, hot publications, and highly cited papers. In summary, this study suggests that C is a better indicator of the achievements of Nobel laureates than other bibliometric measures.
Expertise-based ranking and expert findingsDaud et al. (2020) focus on ranking authors based on their expertise-related topics and present a departure from traditional ranking methods. This approach distinguishes itself by not relying solely on generic author rankings but instead aiming to identify authors based on their expertise in specific topics. The authors introduce new algorithms to assess this ranking system, using existing algorithms’ traditional authors’ ranking. Subsequently, additional algorithms are applied to determine the relevance of the authors to specific topics. Similarly, Gao et al. (2022) have developed a novel expert-finding model known as topic-sensitive representative author identification (TOSA). This model is designed to identify representative authors of a specific research topic within a heterogeneous, topic-insensitive academic network encompassing various topics. The model collects information from a few well-known experts on the target topic. TOSA initially learns high-order relationships among authors in a heterogeneous academic network by extracting topic-related information. It then constructs an embedding space that encapsulates the features of the collected authoritative experts and positions them close to each other. Finally, TOSA calculates a prototype based on the experts gathered in the embedding space and uses it to rank other unlabelled authors by assessing their closeness to the prototype. Thus, this model provides a refined approach to expert findings in academic networks specifically tailored to diverse and topic-sensitive contexts.
Many international indicators exist for ranking and classifying researchers and scientists, such as the H-index, I10-index, G-Index, M-Index, Tori index (2012), Read10-index, and AD Scientific index. Tables 1 and 2 list some of these indicators and related international reports, respectively.
Relevant international indicators.
| Indicators | Used by | Description |
|---|---|---|
| H-index | • WoS• Scopus• Google Scholar | The H-index is a bibliometric indicator that measures the productivity and impact of a researcher's work. The calculation of the H-index depends on the quantity of articles cited at least ‘h’ times. To attain a substantial H-index, an academician must publish many articles and accumulate many citations. |
| I10-index | Google Scholar | The i10-index was created by Google Scholar as an index to rank author impact. It is the number of publications the researcher has written that have at least ten citations. |
| G-Index | Unused | The G-index, created by Leo Egghe as a response to the H-index, is an author-level metric, which places greater weight on highly cited articles. |
| M-Index | Unused | • The M-index is the H-index divided by the number of years a scientist has been active.• The M-index considers years since the first publication and is more relevant to an earlier career researcher than the H-index. |
| Erdős number | —– | • The Erdős number describes the ‘collaborative distance’ between mathematician Paul Erdős and another person, as measured by authorship of mathematical papers.• The same principle has been applied in other fields where a particular individual has collaborated with a large and broad number of peers. |
| Tori index (2012) | NASA ADS | • The Tori index is a bibliometric index that measures the performances of individual researchers and scholars attempting to reduce the impact of self-citations.• The NASA ADS database freely releases the Tori index for any searchable scientist belonging to it.• It is calculated through the reference lists of citing papers, excluding self-citations.• Each citing paper's contribution is normalised by considering the remaining references in the citing papers and the number of authors in the cited paper. In essence, the Tori index excludes citations involving any original authors.• The Tori index of an author decreases as the researchers citing them uses more references (citations of other research papers) in their article.• The Tori index accounts for different citation practices in various fields, enabling more accurate cross-field comparisons. |
| Riq-index (2012) | NASA ADS | The research impact quotient (RIQ) is determined by taking the square root of the Tori index, dividing it by the period between the first and last publication, and multiplying the result by 1000. |
| Read10-index (2005) | NASA ADS | The Read10 is the present readership rate calculated for all papers authored by an individual within the most recent ten years, and this rate is normalised based on the number of authors involved. |
| AD Scientific index based on:1. I10-index2. H-index3. Citations scoresThe value ratio obtained in the last five years to the total value of the I10-index, H-index, and Citations scores. | AD Scientific index Ltd. | • It shows scientists’ total productivity coefficients and the last five years based on the H-index and i10 index scores and citations in Google Scholar.• It provides the ranking and assessment of scientists in academic subjects and branches in 14,120 universities, 215 countries, regions, and the world.• It provides both the ranking and analysis results. |
| Z-score | Times Higher Education, THE | A new science metric system (SMS) that considers the current IF, the total number of citations of the journal in which the article is published, and the author's contribution to the scientific article (Zerem, 2017). By considering all three parameters, Zerem (2017) argues that the proposed criteria greatly remedy significant discrepancies in evaluating the scientific productivity of individual authors and institutions. |
Relevant international reports.
| Report/List | Issued by | Description |
|---|---|---|
| Highly Cited Researchers | WoS | The Highly Cited Researchers™ list from Clarivate™ identifies scientists and social scientists who have demonstrated significant influence through the publication of multiple highly cited papers during the last decade. |
| World Scientist and University Rankings | AD Scientific index Ltd. | The AD Scientific index (Alper-Doger Scientific Index) is a comprehensive ranking and analytical system that assesses individual scientists based on their scientific performance and the added value of their productivity. Additionally, it offers rankings for institutions by evaluating the scientific attributes of their affiliated scientists. |
| The World's Top 2% Scientists ranking | Stanford University | This ranking, considered the most prestigious worldwide, is based on the bibliometric information in the Scopus database and includes more than 180,000 researchers from the more than 8 million scientists considered active worldwide, with 22 scientific fields and 176 subfields considered. |
| Best Scientists in the World Ranking (Top Scientists ranking) | Research.com, a leading academic platform for researchers and ranking of top scientists | The AD Scientific index relies on data gathered from the Microsoft Academic Graph. The ranking positions are determined by a scientist's overall H-index, encompassing leading scientists across various scientific disciplines worldwide. The ranking process thoroughly evaluates scientists using Google Scholar and Microsoft Academic Graph information. Criteria for inclusion in the global ranking consider the H-index, the proportion of contributions within the specific discipline, and the scholars’ awards and achievements. Only the top 1000 scientists with the highest H-index are highlighted in the ranking. |
| ‘The Hot List’ ranking of top climate scientists | Thomson Reuters | ‘The Hot List’ identifies and ranks climate academics according to how influential they are, exploring their research and how their work influences other scientists and the public, activists, and political leaders. |
The inception of the Highly Cited Researchers (HCR) index can be traced back to the work of Eugene Garfield, with foundational contributions in the mid-20th century (Garfield, 1955, 1957; Garfield and Malin, 1968; Somoza-Fernández et al., 2018; Toom, 2018; Ramlal et al., 2021). Eugene Garfield, associated with the Institute for Scientific Information (ISI), played a pivotal role in its formation, coinciding with the introduction of the Scientific Citation Index (SCI) during the 1960s. In 1955, Garfield submitted a paper to the American Chemical Society, anticipating the significance of citation indexing, published and recognised in a U.S. patent (Garfield, 1955, 1957). By 1968, Garfield and Malin (1968) delved into the predictability of Nobel Prizes through citation analysis. In 1970, Garfield (1970) outlined suggestions emphasising the utility of citation analysis in supporting research, particularly in identifying research capacity and tracking creators and their networks.
In 2001, the ISI introduced the category of HCR, presenting it as a valuable resource for empowering researchers and scientists. This initiative aims to assist in identifying key individuals, departments, and laboratories that have significantly contributed to the advancement of science and technology in recent decades. Despite the commercial nature of the ISI at the time, the free accessibility of HCR and the relatively transparent operations of UNHCR seem to be unusual business practices. It is plausible that the ISI-designed HCR is a branding and marketing tool for its commercial products, such as WoS and Detailed Services. During the 1990s, the increasing recognition of the potential benefits of electronic access to digital records for research captivated a growing number of potential customers. The ISI journal IF has gained widespread use in evaluating research at individual and group levels, leading to a growing controversy (Seglen, 1997b). Similarly, citation analysis has gained popularity for research project evaluation and other studies but has also become a subject of debate (MacRoberts, 1996). By investing in HCR, the ISI could cultivate close relationships with a select group of influential researchers who had the potential to positively impact their local institutions and were inclined to utilise ISI data products. The identification and recognition of researchers contributing to the index of ‘the world's longest-running scholarly literature’ aligned with ISI's corporate mission. It enriched its position by offering crucial sources for citation navigation in the knowledge network. The selection of researchers for inclusion in the HCR was based on the total number of citations in their indexed articles published and cited within specific timeframes (1981–1999 for the first HCR list, 1983–2002 for the second, 1984–2003 for the third, and onwards) and across 21 broad categories of research. The categorisation of research for an individual article is influenced by its appearance in a particular journal that forms part of a ‘journal group’ encompassing publications in that specific field (Ramlal et al., 2021; Somoza-Fernández et al., 2018; Toom, 2018).
In bibliometrics, the H-index is based on the number of publications and citations in those publications and is an important metric used to assess the quality, impact, and relevance of an individual work (Bar-Ilan et al., 2007, 2008; Honavar and Bansal, 2022; Usman et al., 2021). Researchers have demonstrated the use and significance of H-index measures while calculating the ranking of authors, universities, and impact of journals (Bornmann and Daniel, 2009; Costas and Bordons, 2007; Torres-Salinas et al., 2009; Vieira and Gomes, 2009; Zerem et al., 2021). Donisky et al. (2019) assess author bias and performance across a set of citations; however, they find no significant differences between the globalised and averaged variables based on citations. Various approaches have been used in the literature to analyse author orders. The authors have also used a pagination algorithm on author-shared citation networks to rank authors (Ding et al., 2009; Dunaiski et al., 2016, 2018; Nykl et al., 2015). Othman et al. (2022) analyse various evaluation criteria, such as H-index, citations, publication index, R-index, and e-index, to assess authors’ ratings based on the number of Monash University publications from Scopus and WoS.
University academic rankings and evaluation criteriaThe emergence of university academic rankings within and across national education systems is essential in comparative analyses of higher education. The Academic Ranking of World Universities (ARWU or Shanghai Ranking) has become influential in the media, education policy communities, and prospective students; however, many critics hesitate to use it for analysis and improvement. This reluctance is partly due to the view that his results cannot be reproduced. The ARWU evaluates each university based on possessing Nobel Prizes, field medals, highly cited researchers, and papers published in prestigious journals such as Nature and Science. It also considers universities with many papers indexed by the SSCI and the SCIE. The ranking encompasses over 1800 universities, and the top 1000 are published utilising the indicators outlined in Table 3 (Shanghai Ranking, 2018). The first indicator, Alumni, holds a 10 per cent weight and quantifies the total number of an institution's alumni who have been awarded Nobel Prizes and Field Medals (see Table 3 for details).
Indicators and weights for Shanghai Jiao Tong University's Academic Ranking of World Universities Ranking (ARWU).
| Criteria | Indicator | Code | Weight |
|---|---|---|---|
| Quality of education | Alumni of an institution winning Nobel Prizes and Fields Medals | Alumni | 10% |
| Quality of teaching staff | Staff of an institution winning Nobel Prizes and Fields Medals | Award | 20% |
| Highly cited researchers in 21 broad subject categories | HiCi | 20% | |
| Research output | Papers published in Nature and Science* | N&S | 20% |
| Papers indexed in SCIE and SSCI | PUB | 20% | |
| Per capita performance | Per capita academic performance of an institution | PCP | 10% |
| Total | 100% | ||
*Note that institutions specialising in Humanities and Social Sciences, such as the London School of Economics, do not consider indicators for papers published in Nature and Science (N&S). Instead, the weight assigned to N&S is redistributed among the other indicators in the evaluation process.
Alumni encompass individuals who have attained a bachelor's, master's, or doctoral degree from an institution. The second metric, ‘award’, carries a 20 per cent weight and quantifies the total number of staff at an institution who have received Nobel Prizes in Chemistry, Physics, Economics, and Medicine, as well as Fields Medals in Mathematics. Staff members are employed by an institution when it receives a prize. The third criterion, ‘HiCi’, holds a 20 per cent weight and assesses the count of highly cited researchers designated by Clarivate Analytics (formerly Thomson Reuters). Clarivate Analytics operates subscription-based services focusing on analytics, including academic and scientific research, biotechnology, pharmaceutical intelligence, and patent intelligence. The company currently oversees the WoS, the largest subscription-based scientific citation indexing service, initially established by the ISI. The WoS integrates a Core Collection with patent data, regional citation indices, a research data index, and specialised subject indices (Clarivate Analytics, 2022). The inclusion of journals in the WoS Core Collection is contingent upon meeting the impact criteria alongside other general criteria, such as comparative citation analysis, content significance, author citation analysis, and editorial board members’ citation analysis. The fourth indicator, ‘N&S’, carries a 20 per cent weight and gauges the number of papers published in Nature and Science from 2012 to 2016. The fifth metric, ‘PUB’, also weighing 20 per cent, assesses the total number of papers indexed in the SSCI and SCIE in 2016, only considering the publication type ‘articles’. Lastly, the sixth criterion, ‘PCP’, holds a 10 per cent weight. This weight is calculated by dividing the weighted scores of the five indicators mentioned above by the number of full-time equivalent academic staff members. If the number of academic staff for institutions is unavailable, the weighted scores of the five indicators alone are used (Shanghai Ranking, 2018).
The increasing number of channels, indices, metrics, publications, and influences underscores the need for adequate literacy in the research domain. This literacy has become indispensable for researchers in various roles, such as authors, investigators, and educators. In a landscape where information is burgeoning, researchers must possess the knowledge to formulate effective strategies and judiciously navigate their scientific output, ensuring the dissemination of research findings. This requirement pertains not only to the research itself but also to the publication of research outcomes. WoS, an extensive science information platform presented by Thomson Reuters (recently acquired by Onex Corporation and Baring Private Equity Asia in October), is a pivotal resource for consulting the ISI databases. Its primary function extends beyond furnishing full text or abstracts, although references to these may be available. WoS provides analytical tools crucial for evaluating publications’ scientific merits. The platform encompasses three key databases: the SCIE, SSCI, and AHCI. The latter was incorporated in 2015 into the Emerging Source Citation Index (ESCI).
Scopus is the predominant database of bibliographic references, complete with abstracts and citations derived from peer-reviewed scientific literature. The Scopus platform offers comprehensive data access by searching, discovering, and analysing various functionalities. This feature facilitates exploration through documents, authors, and other advanced search options. The discovery tool empowers users to identify collaborators, delve into research organisations based on research output, and unearth-related publication data using diverse metrics such as author keywords and shared references. The analysis option effectively tracks citations and evaluates search results based on criteria, such as distribution by country, affiliation, and research area. When researchers download data from the Scopus database, they typically obtain information across 43 fields, encompassing details such as the abbreviated source title, abstract, author keywords, source title (journal of publication), and document type. Those interested may refer to Baas et al. (2020) and Toom (2018) for a more in-depth understanding of the Scopus database.
Hence, databases such as Scopus and WoS have become imperative for searching, discovering, and referencing pivotal scientific publications across diverse fields of knowledge. Publishing in journals indexed in Scopus or the WoS and securing the author's presence in these databases ensures the broad and necessary dissemination of scientific production. This dissemination targets a wide audience, including researchers, libraries, universities, students, and professors seeking to stay abreast of developments in their areas of interest. Consequently, these databases are indispensable tools for researchers, aiding them in accessing current and pertinent bibliographies, establishing their identity as authors, and acting as a reference source for research in their published journals (Singh, 2021).
Using these databases yields benefits for all pertinent stakeholders, including publications, institutions, and authors. These benefits can be quantified by using various indicators and progress metrics.
Web of ScienceWoS is the oldest among the three scholarly databases. Originally conceived by Eugene Garfield of the ISI in 1964, it began as the SCI, encompassing 700 journals, primarily serving as a citation index. Over time, its expansion led to new citation indices, including the SSCI in 1973, the AHCI in 1978, and the Book Citation Index (BKCI) in 2011. The amalgamation of the SCI, SSCI, and AHCI culminated in the launch of the WoS on the World Wide Web in 1997. In 2015, the Emerging Sources Citation Index (ESCI) was introduced to offer early visibility to titles under evaluation for inclusion in the classical indices of SCIE, SSCI, and AHCI (Ramlal et al., 2021; Somoza-Fernández et al., 2018; Toom, 2018).
WoS provides a comprehensive set of indicators for journals and researchers. Journal Citation Reports (JCR) are a renowned quality indicator and are highly regarded by agencies that evaluate research activities. InCites is a citation-based assessment tool that facilitates the comparison of scholarly productivity, making it particularly useful for academic and government officials analysing institutional productivity. Basic Science Indicators (ESI) within the ISI WoS enable measuring science performance and tracking research trends. ResearcherID, offered by Thomson Reuters, provides a solution for creating an author profile with a unique identifier, thus mitigating redundancy and coincidences that may weaken the identity of authors sharing the same name and last name.
ScopusEstablished in 2004, the Scopus database, created by Elsevier, is widely recognised as one of the largest curated databases encompassing scientific journals, books, conference proceedings, and so on. Content selection is undertaken meticulously, including content selection and continuous re-evaluation, led by a Content Selection and Advisory Board (CSAB). At its launch, Scopus contained approximately 27 million publication records from 1966 to 2004 (Toom, 2018).
Scopus offers a set of indicators for both journals and researchers, featuring innovations. One is the CiteScore, a dynamic Elsevier index that calculates the average number of citations from a publication each year relative to the average citations in the preceding three years. Unlike the Annual update of the Thomson Reuters Impact Factor, the CiteScore is updated monthly. Scimago Journal and Country Rank (SJR) provides journal rankings based on reputation, determined by the number of citations adjusted to the number of documents published. Source-normalised impact per paper (SNIP) gauges citation impact by considering the characteristics of the field of knowledge. The H-index is an average that combines the number of citations and publications for an author gaining prominence in research evaluation systems. Scopus Identifier assigns a unique identification number to each author in Scopus, enabling clear author identification without concerns of confusion arising from shared full and last names among different authors.
DimensionsDimensions, introduced in 2018, is the most recent addition to the three scholarly databases. Positioned as a comprehensive research data platform, Dimensions integrates information on awarded grants, clinical trials, patents, policy documents, and altimetric data with traditional publication and citation data (Herzog et al., 2020). At launch, Dimensions encompassed approximately 90 million publications (50 million full-text versions) and over 873 million citation links. As of September 2019, this metric has 109 million publications, approximately 1.1 billion citations, and additional data on clinical trials, patents, policy documents, and altimetric points. It covers publications from over 50,000 journals, and a more recent list (May 2020) includes entries from more than 74,000 journals.
Unlike WoS and Scopus, Dimensions follows a distinctive data-sourcing approach, with CrossRef and PubMed as the ‘data spine’. By adopting a bottom-up approach, Dimensions enhances data from CrossRef and PubMed by incorporating information about affiliations, citations, and so on. The data enrichment process involved various sources, including DOAJ, initiatives such as Open Citations and I4OC, clinical trial registries, public policy data, and contributions from other Digital Science companies, such as Altmetric and IFI Claims.
The dimension database offers three access levels: Dimensions, Dimensions Plus and Dimension Analytics, each with varying privileges. Data downloaded from the Dimensions web interface for research publications typically include 71 fields, covering aspects such as title, source title (journal), authors’ affiliations, and the country of the research organisation.
Scientists and Researchers Classification Model (SRCM)The scientific metrics mentioned above primarily assess the value of scientific output based on citation counts and do not fully capture a scientist's contributions. This research develops a Scientists and Researchers Classification Model (SRCM) to address this gap by employing data mining methods and machine learning. The SRCM is designed to classify, rank, and evaluate university scientists and researchers to enhance the competitiveness of research and innovation systems. As seen in Fig. 1, The SRCM roadmap involves preparation, empowerment strategies, university-recognised research IDs, and evaluation and re-enhancement. The implementation phases include the input, data mining and ranking, and recommendation and evaluation layers (See Fig. 2). Also, Table 4 shows these layers and their procedures of Scientists and Researchers Classification Model (SRCM), where the model consists of several key layers. The Input Layer, for example, serves as the foundational component responsible for collecting and preprocessing data on scientists and researchers, encompassing their publications, citations, patents, and other pertinent metrics. The validation methodologies for the SRCM are outlined in Fig. 3, which depicts the four steps of the SRCM roadmap. The research approach section discusses further details on SRCM and its implementation.
: Roadmap.")
: Implementation.")
Procedures of Scientists and Researchers Classification Model (SRCM)-based layers.
| Layer | S. NO. | Procedure | Implied Meaning | Sources |
|---|---|---|---|---|
| Input Layer | 1 | Determining input data sources | Data sources’ components: national, international, and university indicators | Baas et al., 2019; Birkle et al., 2020; Meho and Yang, 2007; Visser et al., 2021 |
| 2 | Collecting the scientists & researchers lists in a university | Linking the list component, namely, scientists/researchers in a university with the DSs | Daud et al., 2020; Torres-Salinas et al., 2009; Usman et al., 2021; Zerem, 2017, 2018 | |
| Data Mining & Ranking Layer | 3 | Constructing the profiles of scientists & researchers in a university using data mining models | Using data mining models for creating profiles of scientists & researchers | Amjad et al., 2018; Usman et al., 2021 |
| 4 | Creating a New Scoring System by evaluating scientists & researchers in a university | Profile component: scientists/researchers | Bornmann, 2017; Dunaiski et al., 2016; Lippi and Mattiuzzi, 2017; Oberesch and Groppe, 2017 | |
| 5 | Ranking and classifying scientists & researchers in a university using deep learning models | Ranking system using deep learning | Amjad et al. 2018; Daud et al., 2020; Ding, et al., 2009; Dorogovtsev and Mendes, 2015; Dunaiski et al., 2018; Honavar and Bansal, 2022; Torres-Salinas et al., 2009 | |
| 6 | Constructing the members of classified classes A, B, and C | ABC Class components | Kumar and Panda, 2022; Usman et al., 2021 | |
| Recommendation & Evaluation Layer | 7 | Recommending collaboration research strategies among three classes: A, B, and C | Using recommendation models for determining collaboration research strategies | Amjad et al., 2015; Baas et al., 2019 |
| 8 | Recommending values of grant for each class member for doing their research | Using recommendation models for determining grant values | Honavar and Bansal, 2022; Zerem, 2017; Zerem et al., 2021 | |
| 9 | Evaluating the outcomes of all classes’ members and collaboration research groups by using specific indicators | Using indicators for evaluating outcomes of collaboration research | Abbott et al., 2010; Hirsch, 2005, 2010; Hook et al., 2018; Oberesch and Groppe, 2017; Senanayake et al., 2015; Usman et al., 2021; Zhao et al., 2019 | |
| 10 | Enhancing the recommendation system using the feedback from the evaluation system | Using feedback evaluation for enhancing the recommendation system | Bornmann, 2017; Gadd, 2021; Honavar and Bansal, 2022; Othman et al., 2022 |
: Validation.")
Interpretive Structural Modelling (ISM) is a robust methodology for identifying and analysing the relationships among specific items that define a problem or issue (Jharkharia and Shankar, 2005). In the context of SRCM, multiple factors are associated with the evaluation of academic performance. However, understanding the direct and indirect relationships between these factors provides a more comprehensive and accurate depiction than considering individual factors in isolation. ISM facilitates the development of a collective understanding of these interrelationships (Attri et al., 2013). The interpretive aspect of ISM involves group judgment to determine whether and how variables are related. The structural aspect refers to extracting an overall structure from the complex set of variables based on their relationships. Modelling, in this context, involves portraying the specific relationships and the overall structure in a hierarchical configuration, typically represented through a digraph model.
ISM imposes order and direction on the complexity of relationships among system variables (Attri et al., 2013; Sage, 1977; Warfield, 1974). For complex and emergent problems like SRCM, ISM is particularly useful. It considers both direct and indirect relationships, providing a precise understanding of the factors involved. This insight is crucial for developing effective classification and evaluation mechanisms for scientists and researchers. For example, Obi et al. (2020) utilised Total Interpretive Structural Modelling (TISM) to analyse interrelationships among employability skills in the Built Environment sector. They developed a hierarchical model identifying key skill sets crucial for graduates, which were organised into four hierarchical levels. Similarly, Goel et al. (2022) applied ISM to examine the interrelations among Green Human Resource Management (GHRM) practices in educational institutes. They verified the results using the Analytic Hierarchy Process (AHP), highlighting the interconnected challenges and practices. Additionally, Gokak et al. (2023) integrated a quality management perspective with ISM and MICMAC techniques to develop a framework for enhancing student learning and academic performance in higher education institutions. This approach provided a structured methodology for improving institutional practices.
In the context of the Scientists and Researchers Classification Model (SRCM), ISM can be customised to map out and analyse the various factors influencing academic evaluation, such as publication metrics, citation impact, teaching effectiveness, and collaborative research efforts. By employing ISM, SRCM can achieve a nuanced and structured understanding of these interrelationships, facilitating more accurate and fair evaluations of scientists and researchers. This methodological approach ensures that the model not only considers individual metrics but also their complex interplay, leading to more comprehensive and insightful classifications and rankings.
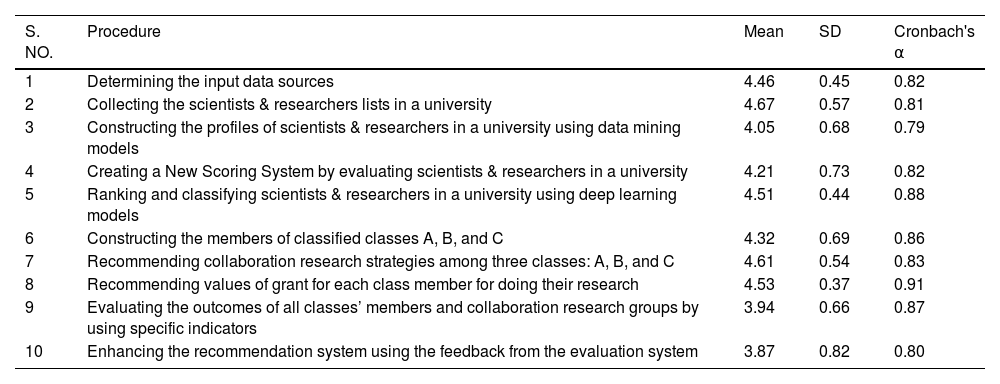
This study aimed to develop an SRCM using data mining and machine learning to enhance the university's research process. As presented in Table 4, the model comprises the following key layers. Input Layer e.g.: it is a foundational layer that is responsible for gathering and preprocessing the data on scientists and researchers, including their publications, citations, patents, and other relevant metrics. It is essential to delineate the principal procedures for the three layers, as outlined in Table 4. It has become imperative to comprehend the interconnections among these procedures to ascertain which are critical to the development of SRCM. An extensive literature review identified ten principal procedures (Table 4). Following this, review experts were invited to assess these procedures, a process which will be elaborated upon in subsequent sections.
To determine the interactions and significance of the established ten main Procedures, the study utilised Interpretive Structural Modelling (ISM), a method focused on identifying and mapping hierarchical relationships among various elements (referenced in Kumar et al., 2016; Warfield, 1974). This interpretive method unravels the system's dynamics by examining the interplay between variables that influence and are influenced by each other, as discussed in the works of Achi et al. (2016), Kamble et al. (2020) and Xu (2000).
The integrated ISM-MICMAC model was devised to elucidate the interconnections among ten procedures. MICMAC is a methodical framework designed to classify variables based on their influence and reliance (Aliabadi et al., 2022; Bamel et al., 2022; Rana et al., 2019). This classification segregates variables into four distinct groups: autonomous, dependent, linkage, and independent, a categorisation detailed in Mangla et al. (2013). This model aids in comprehending how different elements are interconnected within the system.
ISM was employed to discern the intricate connections between specific elements, as initially conceptualised by Warfield in 1974. This approach amalgamates three distinct forms of modelling– verbal descriptions, directed graphs, and elements of discrete mathematics– to provide an enhanced framework for tackling multifaceted problems. This methodology is considered more effective than other techniques, such as the Analytic Hierarchy Process (AHP) and decision-making trial and evaluation laboratory (DEMATEL), for structuring complex issues, as discussed in Kumar et al. (2016) and Luthra et al. (2015, 2017). In parallel, the MICMAC analysis categorises elements by assessing their influence and dependency. This approach not only underscores the relevance of specific variables but also uncovers specific elements due to their impact on other variables, a concept elaborated by Mangla et al. (2013). As seen in Fig. 4 below, the composite ISM-MICMAC methodology involves a sequence of steps, as outlined by Haleem et al. (2016), tailored to the aims of this study:

Step 1: The initial task was identifying and confirming the research's pertinent variables. For the SRCM-based layers, these variables were identified through an extensive review of the literature and data mining techniques. This step will help to identify variables related to the classification and evaluation of scientists and researchers through an extensive literature review and data mining techniques. This, in turn, will support establishing the foundational elements necessary for the SRCM framework.
Step 2: This stage involved crafting a questionnaire to gather data, which is essential for constructing contextual links between the procedures identified in the ISM-MICMAC framework. The aim was to establish pairwise relationships among these procedures, creating a Structural Self-Interaction Matrix (SSIM). However, it is important to mention that pair-wise comparison methods have several known shortcomings and criticisms. For example, pair-wise methods heavily rely on the subjective judgments of experts. This subjectivity can introduce biases, as different experts might have varying perspectives based on their experiences and knowledge. To mitigate this, this study ensured a diverse panel of experts to capture a wide range of viewpoints and reduce individual biases (Althuwaynee et al., 2016). As the number of elements increases, the number of pair-wise comparisons grows exponentially. This can make the process cumbersome and time-consuming, especially for large datasets. In our study, we addressed this by limiting the scope to a manageable number of elements and employing efficient data collection techniques (Al Amin et al., 2023). Ensuring consistency in judgments across all pair-wise comparisons can be challenging. Inconsistent judgments can lead to inaccurate or unreliable results. To tackle this issue, this study implemented consistency checks and provided feedback to the experts to review and adjust their judgments if necessary (Ergu et al., 2011). The final digraph or ISM model can be complex and difficult to interpret, especially for those not familiar with the methodology. This issue was addressed in the current study by providing clear explanations and visual aids to help readers understand the relationships and hierarchies identified in our study (Aurup and Akgunduz, 2012).
By achieving this step, the current study will be able to gather data to establish contextual links between identified procedures as well as develop pairwise relationships among procedures to create a Structural Self-Interaction Matrix (SSIM), crucial for understanding interactions.
Step 3: The process progressed with formulating the Initial Reachability Matrix (IRM) using the data from the SSIM. This matrix was then scrutinised for transitivity, and necessary adjustments were made to meet transitivity conditions, resulting in the Final Reachability Matrix (FRM). From the FRM, the influence and dependence of each procedure were deduced by summing the entries in their respective rows and columns. The main aim which would be achieved in this step is constructing the IRM using SSIM data, ensuring transitivity, and creating the Final Reachability Matrix (FRM) to deduce the influence and dependence of each procedure.
Step 4: The FRM was segmented into multiple tiers to construct an ISM-based structural hierarchy of identified procedures. This result was achieved by extracting the reachability and antecedent sets from the reachability matrix, which were pivotal for determining the various levels. The reachability set groups a specific Procedure and any other Procedures it impacts. Conversely, the antecedent set merges the procedure with those that influence it. The intersection of these sets (intersection set) was then calculated. This step will help to build an ISM-based structural hierarchy by extracting reachability and antecedent sets, thus determining various levels and understanding interdependencies.
Step 5: The MICMAC analysis, which stands for ‘Matrice d'Impacts Croisés Multiplication Appliqués à un Classement’ (cross-impact matrix-multiplication applied to classification), plays a crucial role in categorising various criteria into four distinct groups. These groups are based on their driving and dependence powers and include autonomous, linkage, dependent, and independent criteria. This step involved creating a MICMAC analysis graph for the identified procedures. The purpose of the MICMAC analysis was to scrutinise the variables’ driving force and dependency. The Procedures were categorised into four distinct types based on their driving and dependence powers: autonomous, dependent, linkage, and independent. The key objectives in this step are categorising procedures based on driving and dependence powers to understand their roles in the SRCM framework, and to identify key procedures and their interdependencies to improve the model's effectiveness.
Step 6: The final stage was the construction of an ISM-based hierarchy of procedures, utilising the FRM and determining the final levels of the procedures. This ISM visually depicts the relationships and interdependencies among procedures. By accomplishing this step, the current study will be able to visually depict relationships and interdependencies among procedures using the FRM to solidify the ISM-based hierarchy, providing a clear structure for the SRCM.
Data analysis and results using ISM-MICMACThis section explores the methods used for the data collection and analysis. The detailed results obtained by employing the integrated ISM-MICMAC methodology are presented in subsequent subsections.
Question development and data collectionA structured questionnaire was formulated for data collection, as detailed in Appendix 1. The survey was divided into three sections. Section A is designed to gather basic information about the participants and the academic universities with which they are affiliated. Section B focuses on identifying the most relevant procedures for SRCM in academic settings and assessing their applicability. Section C delves into the intricate interactions between the selected procedures. It was noted that the pool of experts in academic universities with the necessary expertise was limited. Despite the involvement of numerous technical experts and public officials familiar with potential applications and related procedures in developing SRCM, many lacked the specialised knowledge to respond accurately to the survey questions concerning the specific procedures we identified. A carefully curated group of experts specialising in classifying scientists and researchers was assembled for this study. Professionals admitted in machine learning and data mining in academic contexts were also included. Ensuring that these experts had deep knowledge of regulatory and technical challenges and extensive experience and skills relevant to the field was critical. This background included expertise in the quality assurance of classified scientists and researchers, university classification systems (pertaining to individual personal files), and proficiency in databases, studies, and research. The sample size of experts selected for this study was determined to be sufficiently representative of the target population. A demographic summary of the experts detailing their diverse backgrounds and areas of expertise is presented in Table 5. The selected sample size was considered adequate and representative of the target demographics.
Demographic characteristics of experts.
| Demographic Profile | Number of Respondents (N= 20) | Percentage (%) |
|---|---|---|
| Gender | ||
| Male | 12 | 60 |
| Female | 8 | 40 |
| Total | 20 | 100 |
| Age | ||
| Less than 30 | 3 | 15 |
| 31–40 | 6 | 30 |
| 41–50 | 5 | 25 |
| 51–60 | 4 | 20 |
| 60+ | 2 | 10 |
| Total | 20 | 100% |
| Academic/Research Position | ||
| Editor in Chief | 1 | 5 |
| Associate Editor | 1 | 5 |
| Editorial Review Board Member | 1 | 5 |
| Advisory Board Member | 1 | 5 |
| Highly Cited Researcher | 1 | 5 |
| Vice President for Graduate Studies and Scientific Research or Equivalent | 2 | 10 |
| Vice Dean for Graduate Studies and Scientific Research or Equivalent | 2 | 10 |
| Director of Research Excellence | 2 | 10 |
| Think Tank Director | 3 | 15 |
| Dean of Scientific Research | 3 | 15 |
| Vice Dean of Scientific Research | 3 | 15 |
| Total | 20 | 100% |
| Academic Level | ||
| Assistant Professor | 5 | 25 |
| Associate Professor | 6 | 30 |
| Full Professor | 9 | 45 |
| Total | 20 | 100% |
| Academic/Research Experience | ||
| Five years or less | 3 | 15 |
| 6–10 years | 8 | 40 |
| 11–15 years | 5 | 25 |
| More than 15 years | 4 | 20 |
| Total | 20 | 100% |
Table 5 provides an in-depth demographic breakdown of the 20 experts participating in our study, highlighting their diversity across several dimensions. The gender distribution shows a split, with 60% male and 40% female participants, ensuring a range of perspectives influenced by different gender experiences. The age distribution is broad, spanning from under 30 to over 60 years old. The younger cohort (15% under 30 years) likely introduces fresh, innovative ideas, while the largest groups, those aged 31-40 and 41-50, making up 30% and 25%, respectively, along with older participants, bring a mix of mature perspectives and seasoned wisdom. Regarding their professional standing, the respondents hold various significant academic and research positions, ranging from editorial roles to leadership positions in research administration, such as Vice Presidents and Deans. This variety is complemented by their academic levels where 45% are full professors, 30% are associate professors, and 25% are assistant professors. Additionally, their research experience spans from less than five years to over fifteen, ensuring a diverse mix of perspectives and established expertise. This configuration not only enriches the study with a depth of academic and practical knowledge but also enhances the reliability and applicability of the research findings.
Proposed research application and related results.The SRCM was employed in conjunction with the MICMAC analysis and ISM approach to identify significant methods for its development among university researchers. The process and its outcomes are as follows:
Step 1: The initial phase involved pinpointing and finalising the challenges in establishing an SRCM for university scientists. Based on a comprehensive literature review, ten foundational methods were identified for further exploration. A survey soliciting expert feedback was conducted to evaluate the relevance of the methods. The significance of each method was assessed using a five-point Likert scale, where one represented ‘not significant at all’ and five indicated ‘very significant’. It was predetermined that methods with an average rating below three would be excluded, whereas those scoring three or higher would be considered significant. The results showed that all methods achieved an average score of three or above, leading to the decision to retain them for additional analysis. Furthermore, each method's Cronbach's α (CA) values surpassed the recommended threshold of 0.70 (Nunnally, 1978), ensuring their reliability. Subsequently, the data were analysed in detail. Descriptive statistics related to these methods in the development of the SRCM for university scientists are presented in Table 6. Ultimately, a consensus was reached among the expert responses, leading to the selection of ten key methods for incorporation in the subsequent stages of SRCM development.
Descriptive procedures used in developing the SRCM.
| S. NO. | Procedure | Mean | SD | Cronbach's α |
|---|---|---|---|---|
| 1 | Determining the input data sources | 4.46 | 0.45 | 0.82 |
| 2 | Collecting the scientists & researchers lists in a university | 4.67 | 0.57 | 0.81 |
| 3 | Constructing the profiles of scientists & researchers in a university using data mining models | 4.05 | 0.68 | 0.79 |
| 4 | Creating a New Scoring System by evaluating scientists & researchers in a university | 4.21 | 0.73 | 0.82 |
| 5 | Ranking and classifying scientists & researchers in a university using deep learning models | 4.51 | 0.44 | 0.88 |
| 6 | Constructing the members of classified classes A, B, and C | 4.32 | 0.69 | 0.86 |
| 7 | Recommending collaboration research strategies among three classes: A, B, and C | 4.61 | 0.54 | 0.83 |
| 8 | Recommending values of grant for each class member for doing their research | 4.53 | 0.37 | 0.91 |
| 9 | Evaluating the outcomes of all classes’ members and collaboration research groups by using specific indicators | 3.94 | 0.66 | 0.87 |
| 10 | Enhancing the recommendation system using the feedback from the evaluation system | 3.87 | 0.82 | 0.80 |
Step 2: To create a unique SSIM, the finalised Procedures were examined using a ‘leads to’ contextual relationship, indicating the influence of one factor on another. Based on input from experts, this approach facilitated the construction of an SSIM matrix to illustrate these relationships, as detailed in Table 7. As outlined below, four distinct symbols were employed to represent the direction of interaction among procedures (for instance, between procedures i and j).
V-Procedure i will influence Procedure j;
A-Procedure j will influence Procedure i;
X-Procedures i and j will influence each other;
O-Procedures i and j are not related to each other.
The IRM contains one for (i, j) and zero for (j, i) for the corresponding V in the SSIM.
The IRM contains zero for (i, j) and one for (j, i) for the corresponding A in the SSIM.
The IRM contains one for (i, j) and one for (j, i) for the corresponding X in the SSIM.
The IRM contains zero for (i, j) and zero for (j, i) for the corresponding O in the SSIM.
Contextual relationships of SRCM procedures.
| Element P(i) | Procedure | 10 | 9 | 8 | 7 | 6 | 5 | 4 | 3 | 2 |
|---|---|---|---|---|---|---|---|---|---|---|
| 1 | Determining the input data sources | V | O | O | V | V | X | O | X | X |
| 2 | Collecting the scientists & researchers lists in a university | V | O | O | V | V | V | O | X | |
| 3 | Constructing the profiles of scientists & researchers in a university using data mining models | V | O | O | V | V | X | X | ||
| 4 | Creating a New Scoring System by evaluating scientists & researchers in a university | V | O | O | V | V | X | |||
| 5 | Ranking and classifying scientists & researchers in a university using deep learning models | V | O | O | V | V | ||||
| 6 | Constructing the members of classified classes A, B, and C | V | O | V | X | |||||
| 7 | Recommending collaboration research strategies among three classes: A, B, and C | V | X | V | ||||||
| 8 | Recommending values of grant for each class member for doing their research | V | X | |||||||
| 9 | Evaluating the outcomes of all classes’ members and collaboration research groups by using specific indicators | V | ||||||||
| 10 | Enhancing the recommendation system using the feedback from the evaluation system |
Subsequently, the FRM was developed from the IRM by employing the transitivity principle, as illustrated in Tables 8 and 9. This process is detailed in Step 3 of the methodology section.
Step 4: We analysed each procedure's reachability and antecedent sets in determining the levels. A procedure's reachability set (R(Pi)) encompasses the procedure itself and any others it may influence. Conversely, the antecedent set (A(Pi)) included the procedure and other factors that may contribute to its achievement. We then calculated the intersection (R(Pi)∩A(Pi)) of these sets for all Procedures. Procedures with identical reachability and intersection sets are placed at the highest level in the ISM hierarchy. Table 10 displays each procedure along with its reachability set, antecedent set, and the corresponding levels identified in the initial iteration. After determining the top level, procedures at this level were excluded from subsequent iterations. This process was repeated to identify the next level and continues until each procedure is assigned a level. Four iterations were performed (see Appendices 1, 2, and 3). Table 10 lists the final assigned levels of the procedures.
First iteration process of SRCM procedures.
| Element P(i) | Reachability Set R(Pi) | Antecedent Set: A(Pi) | Intersection R(Pi) & A(Pi) | Level |
|---|---|---|---|---|
| 1 | 1,2,3,4,5,6,7,8,9,10 | 1,2,3,4,5 | 1,2,3,4,5 | |
| 2 | 1,2,3,4,5,6,7,8,9,10 | 1,2,3,4,5 | 1,2,3,4,5 | |
| 3 | 1,2,3,4,5,6,7,8,9,10 | 1,2,3,4,5 | 1,2,3,4,5 | |
| 4 | 1,2,3,4,5,6,7,8,9,10 | 1,2,3,4,5 | 1,2,3,4,5 | |
| 5 | 1,2,3,4,5,6,7,8,9,10 | 1,2,3,4,5 | 1,2,3,4,5 | |
| 6 | 6,7,8,9,10 | 1,2,3,4,5,6,7,9 | 6,7,9 | |
| 7 | 6,7,8,9,10 | 1,2,3,4,5,6,7,8,9 | 6,7,8,9 | |
| 8 | 7,8,9,10 | 1,2,3,4,5,6,7,8,9 | 7,8,9 | |
| 9 | 6,7,8,9,10 | 1,2,3,4,5,6,7,8,9 | 6,7,8,9 | |
| 10 | 10 | 1,2,3,4,5,6,7,8,9,10 | 10 | I |
Step 5: In this study, we examined the FRM and calculated the summation of its rows and columns to determine each element's driving and dependence powers, as listed in Table 8. Subsequently, we created the MICMAC analysis graph shown in Fig. 5. This graph was a foundational tool to systematically categorise all ten selected procedures into four sets. Actually, in Interpretive Structural Modelling (ISM), the concepts of driving power and dependence power are essential for analysing the influence and interdependence of elements within a system (Dwivedi et al., 2019). These measures are calculated based on the Final Reachability Matrix (FRM), which is developed from the Structural Self-Interaction Matrix (SSIM) through a series of steps (Jharkharia and Shankar, 2005). The SSIM is developed first, where each variable is compared with every other variable to determine their relationships. This is typically done through expert judgment or data analysis. The relationships are marked with symbols like V (variable i will lead to variable j), A (variable j will lead to variable i), X (both variables influence each other), and O (no direct relationship) (Attri et al., 2013).

Transitivity is a key principle in ISM. If variable A influences variable B, and variable B influences variable C, then variable A should influence variable C. This principle is applied to the IRM to obtain the Final Reachability Matrix (FRM). This is done by checking and updating the matrix iteratively for transitive relations (Attri et al., 2013; Sage, 1977; Warfield, 1974). Once the FRM is established, for each element (variable), driving power is calculated by summing up the values in its row in the FRM. This sum indicates how many other elements a particular element influences. A higher sum indicates a greater driving power, meaning the element has significant influence over other elements (Obi et al., 2020). Likewise, dependence power is calculated by summing up the values in its column in the FRM. This sum represents how many elements influence the particular element. A higher sum indicates higher dependence, showing that the element is significantly influenced by other elements (Obi et al., 2020).
- (1)
Autonomous Procedures: This group of procedures is characterised by weak driving and dependence power, indicating their relative disconnection from the overall system. The absence of autonomous procedures in our selection suggests that each procedure significantly impacts the SRCM.
- (2)
Dependent Procedures: This set of procedures is characterised by weak driving power yet strong dependence, placing them at higher levels of importance within the ISM-based hierarchical model. Two procedures fall into the dependent set: Procedure 8: ‘Recommending values of grant for each class member for doing their research’ and Procedure 10: ‘Enhancing the recommendation system using the feedbacks form evaluation system’. The pronounced dependence on these procedures suggests that they rely on all the other procedures to maintain their effectiveness in developing SRCM. Their significance is underscored by this strong dependence. Hence, universities should pay attention to all other procedures to accomplish the dependent set of procedures and effectively manage the development of SRCM.
- (3)
Linkage Procedures: This set of procedures is distinguished by strong driving and dependence powers; however, they are positioned at comparatively lower levels of importance within the ISM-based hierarchical model. In this study, three procedures fall under the linkage set: Procedure 6: ‘Constructing the members of classified classes, A, B, and C’; Procedure 7: ‘Recommending collaboration research strategies among three classes A, B, and C’, and Procedure 9: ‘Evaluating the outcomes of all classes’ members and collaboration research groups by using certain indicators’. Being part of this category, these procedures are notable for their instability, as any action taken on these procedures will impact others and have a feedback effect on themselves. Consequently, it is crucial to monitor these procedures at each stage of the process or to consider their omissions.
- (4)
Independent Procedures: This set of procedures is marked by a strong driving power and weak dependence power, forming the cornerstone of the ISM-based hierarchical model. In this analysis, five procedures are included in this category: Procedure 1: ‘Determining the input data sources’; Procedure 2: ‘Collecting the scientists & researchers lists in a university’; Procedure 3: ‘Constructing the profiles of scientists & researchers in a university using data mining models’; Procedure 4: ‘Creating New Scoring System with evaluating scientists & researchers in a university’, and Procedure 5: ‘Ranking and classifying scientists & researchers in a university using deep learning models’. Practitioners or policymakers must focus on these driving procedures, or ‘key procedures’, to achieve the intended goals. Procedures with strong driving power can significantly influence other procedures. Therefore, prioritising this procedure is crucial.
Step 6: To develop the ISM-based hierarchical model, we utilised data from the FRM (as illustrated in Table 10) and the final levels of the procedures (outlined in Table 11). This approach enabled us to construct a hierarchical structural model that clearly depicted the interrelationships among the procedures. The resulting ISM-based hierarchical model that visually represents these connections is shown in Fig. 6.
Levels of SRCM procedures.
| S. No. | Level | SRCM Procedure |
|---|---|---|
| 1 | Level 1 | • Enhancing the recommendation system using the feedback from the evaluation system |
| 2 | Level 2 | • Recommending collaboration research strategies among three classes: A, B, and C• Recommending values of grant for each class member for doing their research• Evaluating the outcomes of all classes’ members and collaboration research groups by using specific indicators |
| 3 | Level 3 | • Constructing the members of classified classes A, B, and C |
| 4 | Level 4 | • Determining the input data sources• Collecting the scientists & researchers lists in a university• Constructing the profiles of scientists & researchers in a university using data mining models• Creating a New Scoring System by evaluating scientists & researchers in a university• Ranking and classifying scientists & researchers in a university using deep learning models |

The developed model illustrates the interconnectedness of various procedures in forming SRCM. The absence of autonomous procedures in this study suggests a high degree of interdependence among all procedures, contributing to the complexity of the SRCM development. This absence is likely due to the study's emphasis on crucial procedures, although there may be other less critical procedures. Independent procedures possessing significant driving power are Procedure 1: ‘Determining the input data sources’; Procedure 2: ‘Collecting the scientists & researchers lists in a university’; Procedure 3: ‘Constructing the profiles of scientists & researchers in a university using data mining models’; Procedure 4: ‘Creating New Scoring System with evaluating scientists & researchers in a university’, and Procedure 5: ‘Ranking and classifying scientists & researchers in a university using deep learning models’. The dependent category includes two procedures: Procedure 8: ‘Recommending values of grant for each class member for doing their research’ and Procedure 10: ‘Enhancing the recommendation system using the feedback form evaluation system’, as shown in Fig. 5.
Five procedures were listed in level four, and all of them were placed in the independent categories: Procedure 1: ‘Determining the input data sources’; Procedure 2: ‘Collecting the scientists & researchers lists in a university’; Procedure 3: ‘ Constructing the profiles of scientists & researchers in a university using data mining models’; Procedure 4: ‘Creating New Scoring System with evaluating scientists & researchers in a university’, and Procedure 5: ‘Ranking and classifying scientists & researchers in a university using deep learning models’. These five procedures are vital initial steps in effectively developing SRCM for university scientists and should be prioritised. These steps have been endorsed by Baas et al. (2019), Birkle et al. (2020), Meho and Yang (2007), and Visser et al. (2021), highlighting the need for credible data sources for SRCM development. Accurate and reliable data sources are crucial for ensuring the validity of the model's outcomes. SRCM development involves intricate data, including publication metrics and academic contributions, and the integrity of the data is paramount for the model's success.
The foundational procedures ‘Determining the input data sources’ and ‘Collecting the scientists & researchers lists in a university’ lay the groundwork for further stages like ‘Constructing the profiles of scientists & researchers in a university using data mining models’, ‘Creating New Scoring System with evaluating scientists & researchers in a university’, and ‘Ranking and classifying scientists & researchers in a university using deep learning models’. These steps are crucial for the successful development of the SRCM. Data mining models offer higher accuracy and efficiency in profile construction, as evidenced by Amjad et al. (2018), Cui et al. (2023), Duan et al. (2019), Dwivedi et al. (2021, 2023), Obreja et al. (2024), Usman et al. (2021), Xin et al. (2022), underlining the effectiveness of these techniques in academic contexts.
Implementing deep learning models for ranking and classification is also a sophisticated approach for data interpretation, following the initial data source identification and compilation of academic personnel lists. These models are adept at handling intricate datasets and revealing subtle patterns and connections. Deep learning bridges the gap between basic data collection and advanced analyses. This technology aids in transitioning from elementary data collection to complex algorithm-based categorisation, which is crucial for establishing the specified classes A, B, and C. This approach is supported by various studies, including Amjad et al. (2018), Daud et al. (2020), Ding et al. (2009), Dorogovtsev and Mendes (2015), Dunaiski et al. (2018), Honavar and Bansal (2022), and Torres-Salinas et al. (2009).
Creating a new scoring system is essential for bridging the gap between data collection and its application, as it standardises the evaluation of collected data, which is crucial for the objective assessment and categorisation of scientists and researchers, as noted in studies by Kumar and Panda (2022) and Usman et al. (2021). Research has shown that the process of utilising deep learning models to rank and classify scientists and researchers within a university plays a pivotal role in connecting the initial steps of ‘identifying the input data sources, collecting the scientists and researchers lists in a university, constructing the profiles of scientists and researchers at a university using data mining models, creating a new scoring system with evaluating scientists and researchers in a university with the third-level procedure, and gathering the members of classified classes A, B, and C’.
The subsequent crucial step (third level) in SRCM development is Procedure 6: ‘Gathering the members of classified classes A, B, and C’, supported by studies like those of Kumar and Panda (2022) and Usman et al. (2021). Gathering comprehensive lists enables a deeper understanding of the academic landscape and is essential for the later stages of SRCM, such as data analysis and classification. In other words, this procedure is critical to successfully attain three other procedures in Level 2: Procedure 7: ‘Recommending collaboration research strategies among three classes A, B, and C’; Procedure 8: ‘Recommending values of grant for each class members for doing their research’, and Procedure 9: ‘Evaluating the outcomes of all classes’ members and collaboration research groups by using certain indicators’.
The construction of these classes lays the groundwork for implementing the related second-level procedures. Clearly defining and establishing classes A, B, and C members sets the stage for tailored strategies and initiatives specific to each group. Accordingly, once the classes are constructed, it becomes feasible to recommend collaborative research strategies and allocate grants effectively. This is because each class's needs, capabilities, and research focus can be identified clearly, allowing for more strategic and beneficial collaborations and funding distribution. The outcomes of research and collaboration are more manageable and accurate with well-defined classes.
Specific indicators can be developed for each class, allowing for a nuanced assessment of their performance and impact. The success of SRCM hinges on accurately categorising scientists and researchers. This categorisation not only aids in structuring the model but also ensures that subsequent recommendations and evaluations are based on a solid and relevant understanding of the university's academic landscape (Amjad et al., 2015; Baas et al., 2019; Honavar and Bansal, 2022; Kumar and Panda, 2022; Usman et al., 2021; Zerem, 2017; Zerem et al., 2021).
By recommending specific collaboration strategies for classes A, B, and C, the university can foster synergistic relationships uniquely suited to the strengths and needs of each group. This targeted approach will likely yield more productive and impactful research collaborations, which is essential for refining the overall recommendation system. Mending grant values for each class member also ensures that resources are allocated effectively based on different research groups’ specific needs and potential. This optimised distribution of funds is critical for driving successful research outcomes, which, in turn, enhances the recommendation system at Level 1. Furthermore, evaluating the outcomes of each class and their collaborative efforts using specific indicators provides valuable data on what works well and where improvements are required. This informed evaluation is the key to enhancing the recommendation system at the apex of the hierarchical model, as it allows for adjustments based on actual performance and outcomes. The data and insights gained from these Level 2 procedures serve as a robust feedback mechanism for the recommendation system at Level 1. Continuous feedback ensures that the SRCM remains dynamic, responsive, and increasingly effective (Bornmann, 2017; Gadd, 2021; Honavar and Bansal, 2022; Othman et al., 2022).
Theoretical contributionsGiven the absence of a solid and comprehensive SRCM in the literature, this study went further by proposing and validating the proposed model. In other words, this study has provided original value by building a framework that helps academic institutions and universities comprehend and map interdependencies within academic settings. Considering the absence of autonomous procedures, as explained in the Analysis and Results section, and the interconnected nature of various tasks, SRCM highlights the complex and interconnected nature of academic processes, which challenges traditional linear models of academic administration and research management. By illustrating the interconnectedness of various procedures, the SRCM provides a new framework for understanding how different tasks and processes within academic settings are interrelated. This helps in comprehending the holistic nature of academic administration, which is often overlooked in traditional models.
The SRCM makes another considerable contribution by providing a hierarchical method for classifying and placing procedures in the academic sector. The theoretical value of SRCM is related to a novel mechanism for conceptualising how diverse components within a university's ecosystem, from data collection to deep learning-based classification, can be structured in a graduated structure. This mechanism adds a layer of complexity to how academic institutions can build, classify and appraise scientists and researchers. By integrating data mining and deep learning techniques, the SRCM introduces methodological innovations that enhance the accuracy and efficiency of academic evaluations. This methodological advancement provides a template for future research and applications in other domains of academic and administrative management.
To build the proposed SRCM, the current study has followed sophisticated processes, such as data mining and deep learning, to rank and classify scientists and researchers, representing a significant theoretical advancement. Accordingly, this study proposes a novel shift towards more technologically driven methods in academic appraisal, moving away from traditional approaches to more sophisticated, algorithm-based systems. This integration provides a basis for future research on the efficacy and ethics of these technologies in the academic setting.
Establishing a new scoring system and focusing on reliable data sources for developing SRCM add to the theoretical discourse on standardisation and objective evaluation in academic research. In details, by integrating data mining and deep learning techniques, the SRCM introduces methodological innovations that enhance the accuracy and efficiency of academic evaluations. This methodological advancement provides a template for future research and applications in other domains of academic and administrative management. Such a theoretical value is vital for managing the methodology adopted by academic institutions to develop more transparent, fair, and credible approaches for assessing academic contributions. Further, new theoretical insights are also captured by enhancing the feedback from the evaluation systems at the top of the hierarchy, which enhances the quality of recommendations proposed and provides insights to academic institutions regarding how they can continuously improve the evaluation and reward process.
Practical implicationsAlong with the theoretical values proposed above, this study also provides several practical guidelines and implications to help academic institutions develop more transparent, fair, and credible approaches to assessing academic contributions. First, academic institutions should prioritise vital databases and researcher profiles, structuring how data should be collected and analysed more hierarchically. This structured approach requires classifying and placing tasks and procedures to ensure the effective apportionment of resources and effort. Specifically, institutions should establish clear data collection protocols, ensuring that data is gathered consistently across all departments. This involves creating standardised templates and guidelines for data entry, ensuring accuracy and uniformity in the information collected (Tudor-Locke, 2016; Wilbanks et al., 2018).
Additionally, the results of this study suggest that academic institutions should invest more resources and time into integrating emerging systems, such as data mining and deep learning technologies, for profiling and classifying researchers and scientists (Zhu et al., 2023). This integration would benefit from advanced training programs designed to empower staff members to efficiently manage and interpret complex datasets associated with academic research and performance. Training should focus on both the technical aspects of these technologies and their practical applications in academic settings. For instance, workshops and courses on data mining, machine learning algorithms, and the use of specialised software tools would be essential (Nguyen et al., 2019). Furthermore, training should also cover data privacy and ethical considerations to ensure responsible data handling practices (Thapa and Camtepe, 2021). Universities should also advance and apply standardised scoring systems to accurately assess the performance and contributions of scientists and researchers. This approach ensures that the SRCM system is transparent, credible, and adaptable to various academic disciplines and research areas. The development of these scoring systems should be guided by clear criteria that align with the institution's strategic goals, such as research output, teaching excellence, and community engagement.
When formulating and suggesting initiatives at the collaborative strategic level, SRCM insights should be considered. Academic institutions are recommended to build systematic and accurate methods for grant distribution that align with the expectations and potential of different research classes, optimising the use of funds (Höylä et al., 2016). This method requires establishing a transparent grant application process with well-defined evaluation criteria, ensuring that funds are allocated based on merit and strategic priorities. Furthermore, academic organisations should strengthen the feedback loop of evaluation systems and continuously develop systems for suggestions and other recommendations (Kelchen, 2017). This feedback mechanism should involve regular reviews and updates of evaluation criteria and processes, based on stakeholder input and changing academic landscapes.
Attention must also be given to ethical issues related to data mining and deep learning to ensure privacy and fairness in assessment and classification processes. Institutions should build and share comprehensive policies and guidelines detailing the ethical implications of using smart systems in academic contexts. These policies should cover aspects such as informed consent, data anonymisation, and the mitigation of biases in data-driven decision-making (Ryan et al., 2020). The development of SRCM is not an end goal; its real value lies in the insights it provides. These insights are crucial for decision-makers and strategists in academia and education, enabling them to develop and customise research and teaching programs to meet specific needs and goals. To harness the potential of data-driven decision-making processes within the SRCM context, universities must undertake a comprehensive approach to capacity building (Nguyen, 2016). This involves substantial investments in training and development programs designed to enhance staff and administrators’ proficiency in interpreting and applying data insights to decision-making processes. Such programs should focus on both the technical aspects of data analysis and their strategic application in various academic and administrative scenarios.
Additionally, fostering a collaborative environment that bridges gaps between administrative, academic, and IT departments is crucial for successfully implementing and maximising the benefits of SRCM (Sandberg et al., 2011). This collaboration can be facilitated through regular interdepartmental meetings, joint training sessions, and the establishment of cross-functional teams tasked with overseeing SRCM implementation and integration (Bishop, 1999). By creating synergy in which data insights are seamlessly integrated into institutional planning and operations, universities can achieve more informed, efficient, and effective decision-making that aligns with their overarching goals and objectives. This holistic approach ensures that SRCM supports not only the immediate needs of academic evaluation but also the long-term strategic objectives of the institution.
Limitations and future research directionsThis study contributed significantly to the creation of the SRCM. This model has several advantages. Universities aid in developing robust research profiles and improving rankings. In addition, it provides valuable insights for researchers interested in relevant fields. However, several limitations must be addressed in future studies. For example, relying on modern technologies such as data mining and deep learning models represents a technical and cognitive addition, but at the same time, it is fraught with risks if the required human and technical skills and capabilities are not available. Therefore, future studies should examine the impact of intellectual and human competencies in using such smart systems and further elaborate on the key competencies needed to utilise such smart systems successfully. For example, researchers have defined and examined skill gaps in the use of modern technologies such as data mining and deep learning. This result will help in designing targeted training programmes and resources. Future research should account for the diverse needs unique to different specialisations and the distinct characteristics of various academic institutions. Therefore, developing a more adaptable template-based framework for the SRCM is essential. This framework should be designed for customisation, allowing it to be tailored to the specific nature of each specialisation. Additionally, it should be sufficiently flexible to meet the varying requirements of research and academic organisations. The current SRCM framework does not thoroughly address these ethical considerations. Therefore, future research should explore ethical and privacy-preserving methods for applying data mining and deep learning in academic contexts.
ConclusionIn conclusion, this study introduces the Scientists and Researchers Classification Model (SRCM), an innovative automated approach utilising data mining and machine-learning techniques to classify, rank, and evaluate scientists and researchers in university settings. Designed to cultivate an environment conducive to creativity, innovation, and collaboration among academics, SRCM aims to enhance universities’ research capabilities and competitiveness. The model's development roadmap, delineated across four pivotal stages, and structured implementation across three layers provide a comprehensive framework for its deployment. Through an extensive literature review and analysis using Interpretive Structural Modelling (ISM), key procedures within SRCM were identified, highlighting their interdependence and complexity. Despite facing challenges related to data quality, ethical considerations, and adaptability, SRCM offers valuable insights for universities seeking to implement sophisticated data-centric classification models. For instance, by leveraging such models, universities can objectively assess faculty performance for promotion or tenure, fostering a culture of excellence and guiding faculty development initiatives.
CRediT authorship contribution statementAmin Y. Noaman: Writing – review & editing, Writing – original draft, Visualization, Validation, Supervision, Software, Resources, Project administration, Methodology, Investigation, Formal analysis, Data curation, Conceptualization. Ahmed A.A. Gad-Elrab: Writing – review & editing, Writing – original draft, Visualization, Validation, Supervision, Software, Resources, Project administration, Methodology, Investigation, Formal analysis, Data curation, Conceptualization. Abdullah M. Baabdullah: Writing – review & editing, Writing – original draft, Visualization, Validation, Supervision, Software, Resources, Project administration, Methodology, Investigation, Formal analysis, Data curation, Conceptualization.
• Invitation
Subject: Invitation to Contribute to SRCM Development
Dear Esteemed Colleagues,
We appreciate your participation in completing the enclosed survey. Your insights are invaluable to the progression of the Scientists and Researchers Classification Model (SRCM).
The study at hand seeks your expertise in refining the SRCM's Procedures, ensuring they are both effective and enduring within the scholarly domain. Our survey's intent is twofold: firstly, to pinpoint the most pertinent Procedures for the SRCM, delving into their implications; and secondly, to investigate the relationships among these Procedures, ascertaining their roles within the model's tiered framework.
Your seasoned perspectives are sought after, and your contributions are anticipated to significantly shape the SRCM's framework. Should you have inquiries regarding this survey or how we intend to utilise your responses, please reach out to [contact information not visible]. Rest assured, all information provided will remain strictly confidential and be applied solely for scholastic research objectives.
Your participation will not lead to public disclosure of your identity.
Your collaborative spirit is highly valued.
Kind regards,
• Survey Questionnaire
This questionnaire consists of three sections:
Section A aims to collect general information about the respondents and their positions, academic level and work experience.
Section B is designed to help selecting the most pertinent Procedures for the SRCM.
Section C considers the contextual interactions between the selected Procedures as well as to investigate the relationships among these Procedures, ascertaining their roles within the model's tiered framework.
Section A: General Information
Please answer the following multiple choice questions by circling only one answer for each:
Demographic Profile
Gender:
Male
Female
Age:
Less than 30
31-40
41-50
51-60
60+
Academic/Research Position:
Editor in Chief
Associate Editor
Editorial Review Board Member
Advisory Board Member
Highly Cited Researcher
Vice President for Graduate Studies and Scientific Research or Equivalent
Vice Dean for Graduate Studies and Scientific Research or Equivalent
Director of Research Excellence
Think Tank Director
Dean of Scientific Research
Vice Dean of Scientific Research
Academic Level:
Assistant Professor
Associate Professor
Full Professor
Academic/Research Experience:
5 years or less
6-10 years
11-15 years
More than 15 years
Section B: Significance of SRCM Procedures
Please rate the significance of the following Procedures on a scale from 1 to 5, where 1 means ‘Not significant at all’ and 5 means ‘Extremely significant’ (five-point Likert scale). Tick one box only:
Significance of SRCM procedures.
| S. NO. | Procedure | Score |
|---|---|---|
| 1 | Determining the input data sources | |
| 2 | Collecting the scientists & researchers lists in a university | |
| 3 | Constructing the profiles of scientists & researchers in a university using data mining models | |
| 4 | Creating a New Scoring System by evaluating scientists & researchers in a university | |
| 5 | Ranking and classifying scientists & researchers in a university using deep learning models | |
| 6 | Constructing the members of classified classes A, B, and C | |
| 7 | Recommending collaboration research strategies among three classes: A, B, and C | |
| 8 | Recommending values of grant for each class member for doing their research | |
| 9 | Evaluating the outcomes of all classes’ members and collaboration research groups by using specific indicators | |
| 10 | Enhancing the recommendation system using the feedback from the evaluation system |
Section C: Contextual Relationships of SRCM Procedures
The next step after finalising the key Procedures of SRCM is to identify the contextual relationships between the Procedures. To this end, an SSIM matrix has been constructed (Table B). Please indicate the direction of interaction between the Procedures by entering the following four symbols:
V-Procedure i will influence Procedure j;
A-Procedure j will influence Procedure i;
X-Procedure i and j will influence each other;
O-Procedure i and j are not related to each other.
Contextual relationships of SRCM procedures.
| Element P(i) | Procedure | 10 | 9 | 8 | 7 | 6 | 5 | 4 | 3 | 2 |
|---|---|---|---|---|---|---|---|---|---|---|
| 1 | Determining the input data sources | |||||||||
| 2 | Collecting the scientists & researchers lists in a university | ` | ||||||||
| 3 | Constructing the profiles of scientists & researchers in a university using data mining models | |||||||||
| 4 | Creating a New Scoring System by evaluating scientists & researchers in a university | |||||||||
| 5 | Ranking and classifying scientists & researchers in a university using deep learning models | |||||||||
| 6 | Constructing the members of classified classes A, B, and C | |||||||||
| 7 | Recommending collaboration research strategies among three classes: A, B, and C | |||||||||
| 8 | Recommending values of grant for each class member for doing their research | |||||||||
| 9 | Evaluating the outcomes of all classes’ members and collaboration research groups by using specific indicators | |||||||||
| 10 | Enhancing the recommendation system using the feedback from the evaluation system |
Extracted Iterations
Second iteration process of SRCM procedures.
| Element P(i) | Reachability Set R(Pi) | Antecedent Set: A(Pi) | Intersection R(Pi) & A(Pi) | Level |
|---|---|---|---|---|
| 1 | 1,2,3,4,5,6,7,8,9 | 1,2,3,4,5 | 1,2,3,4,5 | |
| 2 | 1,2,3,4,5,6,7,8,9 | 1,2,3,4,5 | 1,2,3,4,5 | |
| 3 | 1,2,3,4,5,6,7,8,9 | 1,2,3,4,5 | 1,2,3,4,5 | |
| 4 | 1,2,3,4,5,6,7,8,9 | 1,2,3,4,5 | 1,2,3,4,5 | |
| 5 | 1,2,3,4,5,6,7,8,9 | 1,2,3,4,5 | 1,2,3,4,5 | |
| 6 | 6,7,8,9 | 1,2,3,4,5,6,7,9 | 6,7,9 | |
| 7 | 6,7,8,9 | 1,2,3,4,5,6,7,8,9 | 6,7,8,9 | II |
| 8 | 7,8,9 | 1,2,3,4,5,6,7,8,9 | 7,8,9 | II |
| 9 | 6,7,8,9 | 1,2,3,4,5,6,7,8,9 | 6,7,8,9 | II |
Canonical matrix.
| Elements | 10 | 7 | 8 | 9 | 6 | 1 | 2 | 3 | 4 | 5 | Level | Reachability Set: R(Pi) |
|---|---|---|---|---|---|---|---|---|---|---|---|---|
| 10 | 1 | 0 | 0 | 0 | 0 | 0 | 0 | 0 | 0 | 0 | 1 | 10 |
| 7 | 1 | 1 | 1 | 1 | 1 | 0 | 0 | 0 | 0 | 0 | 2 | 6,7,8,9,10 |
| 8 | 1 | 1 | 1 | 1 | 0 | 0 | 0 | 0 | 0 | 0 | 2 | 7,8,9,10 |
| 9 | 1 | 1 | 1 | 1 | 1 | 0 | 0 | 0 | 0 | 0 | 2 | 6,7,8,9,10 |
| 6 | 1 | 1 | 1 | 1 | 1 | 0 | 0 | 0 | 0 | 0 | 3 | 6,7,8,9,10 |
| 1 | 1 | 1 | 1 | 1 | 1 | 1 | 1 | 1 | 1 | 1 | 4 | 1,2,3,4,5,6,7,8,9,10 |
| 2 | 1 | 1 | 1 | 1 | 1 | 1 | 1 | 1 | 1 | 1 | 4 | 1,2,3,4,5,6,7,8,9,10 |
| 3 | 1 | 1 | 1 | 1 | 1 | 1 | 1 | 1 | 1 | 1 | 4 | 1,2,3,4,5,6,7,8,9,10 |
| 4 | 1 | 1 | 1 | 1 | 1 | 1 | 1 | 1 | 1 | 1 | 4 | 1,2,3,4,5,6,7,8,9,10 |
| 5 | 1 | 1 | 1 | 1 | 1 | 1 | 1 | 1 | 1 | 1 | 4 | 1,2,3,4,5,6,7,8,9,10 |