


D-dimer levels are elevated in COVID 19 and they correlate to the levels of other inflammatory markers such us ferritin, fibrinogen and C-reactive protein. It may be possible to correct D-dimer value in function of inflammatory markers, thus identifying patients at higher risk of venous thromboembolism (VTE). Our objectives are estimating a corrected value of plasma D-dimer as a linear function of ferritin, C-reactive protein and fibrinogen and stablishing a cut-off point of high probability of VTE.
Patients and methodsAge and sex matched case-control study of all patients diagnosed with COVID 19 and VTE between March and May 2020 in a tertiary hospital in Madrid (Spain). Using linear regression, the best predictive model will be estimated and residual D-dimer values will be obtained and analyzed using ROC curves to determine its discriminative performance.
ResultsThirty-eight cases and seventy-six controls were included. There was 63.2% of men and mean age was 68.2. D-dimer was best predicted by a linear model including fibrinogen, ferritin and C-reactive protein. Using residual values, the optimal cutoff point was 2165ng/mL, with a sensitivity of 57.9% and specificity of 98.7%.
ConclusionIt is possible to estimate a D-dimer corrected value in function of ferritin, C-reactive protein and fibrinogen. Using the observed and estimated value we can obtain a residual value that performs well as a screening method to detect patients who would benefit for further VTE diagnostic testing.
El dímero-D está elevado en la COVID-19 y se correlacionan con los niveles de otros marcadores inflamatorios como ferritina, fibrinógeno y proteína C reactiva. Cabe la posibilidad de corregir el dímero-D en función de dichos marcadores inflamatorios, identificando así los pacientes con mayor riesgo de enfermedad tromboembólica venosa (ETV). Nuestros objetivos son estimar un valor corregido de dímero-D como función lineal de ferritina, proteína C reactiva y fibrinógeno, y establecer un punto de corte de alta probabilidad de ETV.
Pacientes y métodosEstudio de casos y controles emparejados por sexo y edad de todos los pacientes diagnosticados con COVID-19 y ETV entre marzo y mayo de 2020 en un hospital terciario de Madrid, España. Mediante regresión lineal, se estima el mejor modelo predictivo y se obtiene el valor residual de dímero-D. Este se analizará con curvas ROC para determinar su capacidad discriminativa.
ResultadosSe incluyeron 38 casos y 76 controles. Había un 63,2% de varones y la edad media fue de 68,2 años. El valor de dímero-D fue predicho por un modelo que incluyó fibrinógeno, ferritina y proteína C reactiva. Usando los valores residuales, el punto de corte óptimo estimado de 2.165ng/ml, con una sensibilidad del 57,9% y una especificidad del 98,7%.
ConclusionesEs posible estimar un valor corregido de dímero-D en función de ferritina, fibrinógeno y proteína C reactiva. Usando el valor observado y estimado podemos obtener un valor residual que funciona bien como método de cribado para detectar pacientes que podrían beneficiarse de más estudios diagnósticos de la ETV.
Since the beginning of the COVID-19 pandemic it has been observed that patients have elevated plasma levels of D-dimer and some inflammatory markers (ferritin, interleukine 6, C-reactive protein or fibrinogen).1–3 Some studies point to the existence of a certain correlation between those markers and D-dimer.4 It has also been observed a high incidence of VTE.5
However, there is a question that needs to be answered yet: to which extent does COVID-19 induced inflammation justify elevated plasma D-dimer and which patients should be screened for VTE? Some have tried to answer that question and have found that, in general, patients with VTE have higher values of D-dimer than the rest of COVID-19 patients.6,7 Nevertheless, a widely accepted cut-off point has yet to be established.8
Our hypothesis is that D dimer correlates with levels of fibrinogen, C-reactive protein and ferritin, so it can be corrected in function of them. This way, it would be possible to obtain a corrected value that represents the elevation due to thrombosis once the inflammatory effect has been removed. Our objectives are developing a multivariable predictive model to obtain a corrected value of plasma D-dimer and stablishing a cut-off point of low/high probability of VTE.
Patients and methodsWe designed an age and sex matched case–control study. The study was conducted between 1st March and 30th May 2020 in a tertiary hospital in Madrid, Spain. Data were collected between 15th July and 30th September 2020; we only considered data originating from the hospitalization.
Cases were defined as any patient diagnosed with COVID-19 and deep vein thrombosis and/or pulmonary embolism. Due to the differences between protocols for diagnosis during the study period diagnosis of COVID-19 was made by positivity of SARS-CoV-2 real time polymerase chain reaction (RT-PCR) as well as by typical clinical and radiological findings. Controls were age (±2 years) and sex matched patients with COVID-19 without venous thrombosis who were hospitalized during the same period.
Exclusion criteria were pregnancy, and absence of reactive C protein, ferritin, fibrinogen or D-dimer determination during hospitalization.
The study sample was constituted retrospectively as follows: first we identified all cases, analyzing hospital discharge reports of COVID-19 patients and they were incorporated in accordance to the previously described criteria. Afterwards, for each case, two same sex and age (±2 years) were searched in a chronological order (considering admission day); we included the first two patients matching the pre-established criteria.
Assuming an estimation based on four parameters, we aim to detect an effect f2=R2/(1−R2)=0.15,9 so at least 84 patients should be recruited. In order to minimize selection bias all cases during the study period were included and controls were selected consecutively according to the date of hospitalization.
Epidemiological, anthropometric, clinical and analytical data were retrospectively collected from the electronic clinical records and were used to compare both groups. For cases we considered D-dimer, C-reactive protein, fibrinogen and ferritin levels measured the day of VTE diagnosis. For controls, we considered de highest D-dimer level during hospitalization and C-reactive protein, fibrinogen and ferritin levels measured upon that same determination.
Continuous variables are described with mean and standard deviation or median and interquartile interval, as appropriate. Categorical variables are described with their frequency distribution. Correlation between D-dimer and the other variables of interest is described with Pearsons’ correlation test or Spearman's Rho and 95% confidence interval, as appropriate.
Beginning with a full model which contains all pre-established interest variables (D-dimer, ferritin, fibrinogen and reactive C protein), three analyses were made to identify the best model with clustered linear regression: a model with automated forward selection (p value to entry the model 0.05), a model with automated backward elimination (p value for elimination from the model 0.10) and an automated analysis of all possible subsets. We would retain the model which best combines parsimony and a low Mallows’ Cp defined as Mallows’ Cp inferior to the sum of the predictors in the model plus the constant. Each trio of a case and its two paired controls were considered a cluster.
Our theoretical assumption is that cases will have higher levels of plasma D-dimer because of the inflammatory state and thrombosis, while controls will have lower levels of plasma D-dimer because the only cause for its elevation is the inflammatory state.
Because the model will be estimated with both cases and controls, its linear prediction will be lower than the real values for cases and higher than the real values for controls. Thus, since the predicted value will be over- or underestimated, we consider that it cannot be used directly as a predictor. Instead, the estimation will be subtracted to the real value, obtaining the residual value. If our theoretical assumption is true, residuals of cases will tend to positivity while residuals of controls will tend to negativity. In this way, we would have a value that may discriminate between cases and controls.
In the case this assumption is empirically confirmed, a receiver operating characteristic (ROC) curve will be studied to determine the discriminative performance of the residual value to identify patients with venous thrombosis. The cut-off point which maximizes efficiency will be retained as optimal. It should be kept in mind that this is a case control study, and thus, it does not represent the real prevalence con VTE in the population, so the positive and negative predictive cannot be estimated.
Patients with missing data in variables of interest will be excluded from the analysis.
The study was approved by the local ethics committee and it was carried out in accordance with the Declaration of Helsinki. According to the Spanish law, no informed consent was necessary as data were accessed disaggregated from patient identifying data.
This article has been written following the STROBE and TRIPOD guidelines.10,11
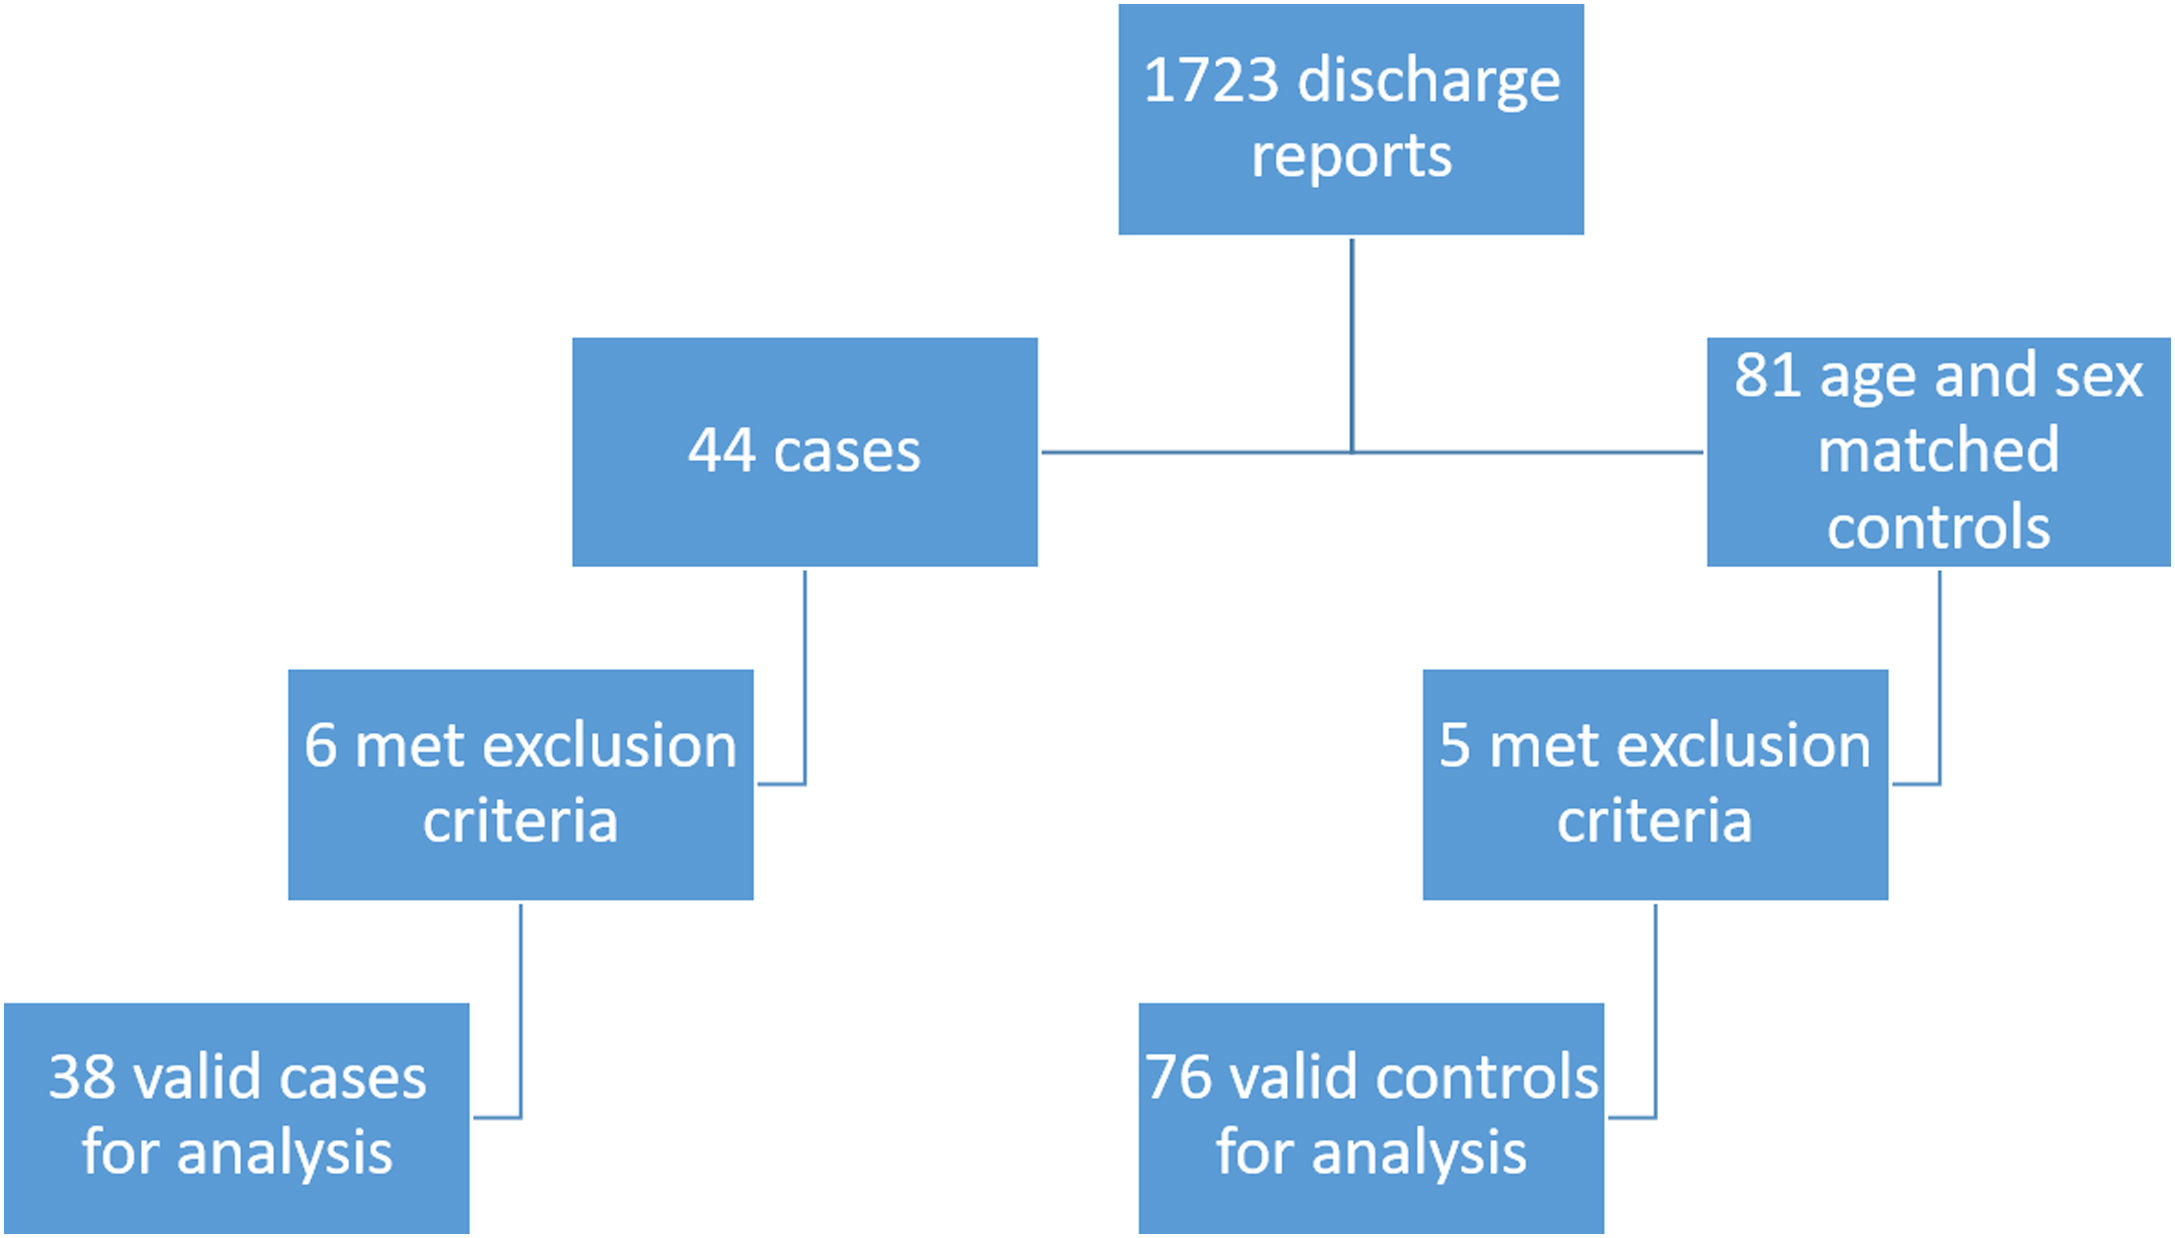
ResultsDuring the study period 125 eligible patients were identified. Eleven patients met one or more exclusion criteria: 8 patients (5 cases, 3 controls) did not have a valid determination of ferritin; 2 patients (1 control, 1 case) did not have a valid determination of D-dimer; one patient (control) did not have a valid determination of ferritin nor a valid determination of D-dimer. Thus, thirty-eight cases and seventy-six controls were finally included in the study. The flow diagram is depicted in Fig. 1.

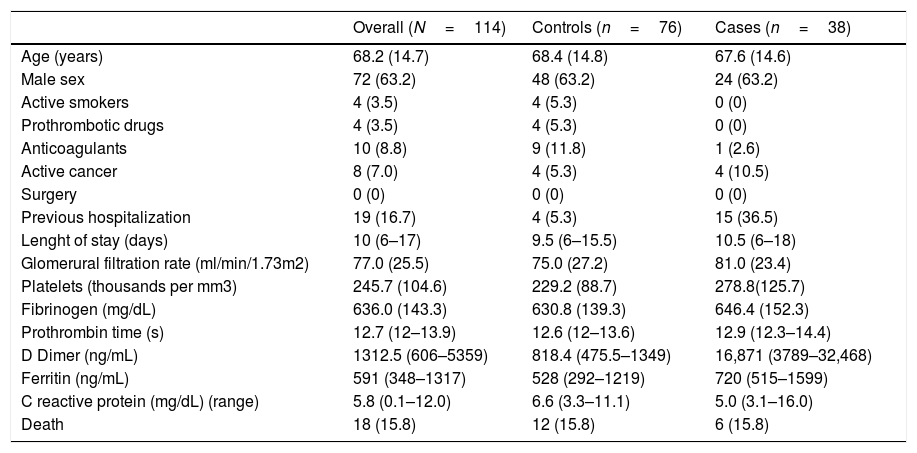
Main characteristics of study population are described in Table 1. All variables were similarly distributed between groups, except for previous hospitalization which were more frequent among cases.
Study population main features.
| Overall (N=114) | Controls (n=76) | Cases (n=38) | |
|---|---|---|---|
| Age (years) | 68.2 (14.7) | 68.4 (14.8) | 67.6 (14.6) |
| Male sex | 72 (63.2) | 48 (63.2) | 24 (63.2) |
| Active smokers | 4 (3.5) | 4 (5.3) | 0 (0) |
| Prothrombotic drugs | 4 (3.5) | 4 (5.3) | 0 (0) |
| Anticoagulants | 10 (8.8) | 9 (11.8) | 1 (2.6) |
| Active cancer | 8 (7.0) | 4 (5.3) | 4 (10.5) |
| Surgery | 0 (0) | 0 (0) | 0 (0) |
| Previous hospitalization | 19 (16.7) | 4 (5.3) | 15 (36.5) |
| Lenght of stay (days) | 10 (6–17) | 9.5 (6–15.5) | 10.5 (6–18) |
| Glomerural filtration rate (ml/min/1.73m2) | 77.0 (25.5) | 75.0 (27.2) | 81.0 (23.4) |
| Platelets (thousands per mm3) | 245.7 (104.6) | 229.2 (88.7) | 278.8(125.7) |
| Fibrinogen (mg/dL) | 636.0 (143.3) | 630.8 (139.3) | 646.4 (152.3) |
| Prothrombin time (s) | 12.7 (12–13.9) | 12.6 (12–13.6) | 12.9 (12.3–14.4) |
| D Dimer (ng/mL) | 1312.5 (606–5359) | 818.4 (475.5–1349) | 16,871 (3789–32,468) |
| Ferritin (ng/mL) | 591 (348–1317) | 528 (292–1219) | 720 (515–1599) |
| C reactive protein (mg/dL) (range) | 5.8 (0.1–12.0) | 6.6 (3.3–11.1) | 5.0 (3.1–16.0) |
| Death | 18 (15.8) | 12 (15.8) | 6 (15.8) |
Categorical variables are described as n (%); continuous variables are described as mean (SD) or median (p25-p75).
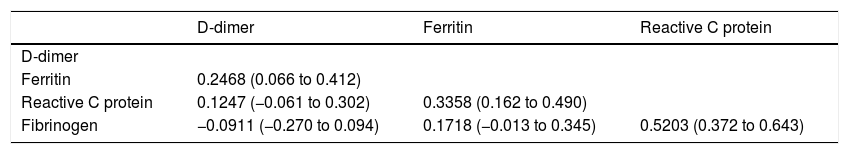
Because of the notorious deviation from normality of values in D-dimer we chose to examine correlations with Spearman's Rho, whose results are depicted in Table 2.
Correlation between interest variables.
| D-dimer | Ferritin | Reactive C protein | |
|---|---|---|---|
| D-dimer | |||
| Ferritin | 0.2468 (0.066 to 0.412) | ||
| Reactive C protein | 0.1247 (−0.061 to 0.302) | 0.3358 (0.162 to 0.490) | |
| Fibrinogen | −0.0911 (−0.270 to 0.094) | 0.1718 (−0.013 to 0.345) | 0.5203 (0.372 to 0.643) |
Spearman's Rho (Fisher's transformation 95% confidence interval).
In view of the strong intercorrelation between independent variables, we analyzed the variance inflation factor (VIF) of the maximal model (which included Ferritin, reactive C protein and fibrinogen as independent variables) to detect collinearity. All of them had a VIF less than 1.5 (or tolerance near 1) indicating that collinearity was not present.
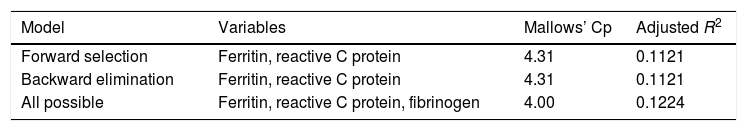
When the maximal model was examined with an automated forward selection, backward elimination and all possible subsets, the best models were those shown in Table 3. There were no data for the variables of interest, so all patients entered all the analysis.
In our case only the maximal model (three predictors plus the constant with a Mallows’ Cp of four) met the pre-stablished criterion. Thus, we retained the maximal model, whose equation was: D-dimer=4.76·Ferritin+882.19·Reactive C protein – 20.68·Fibrinogen+11,115.22.
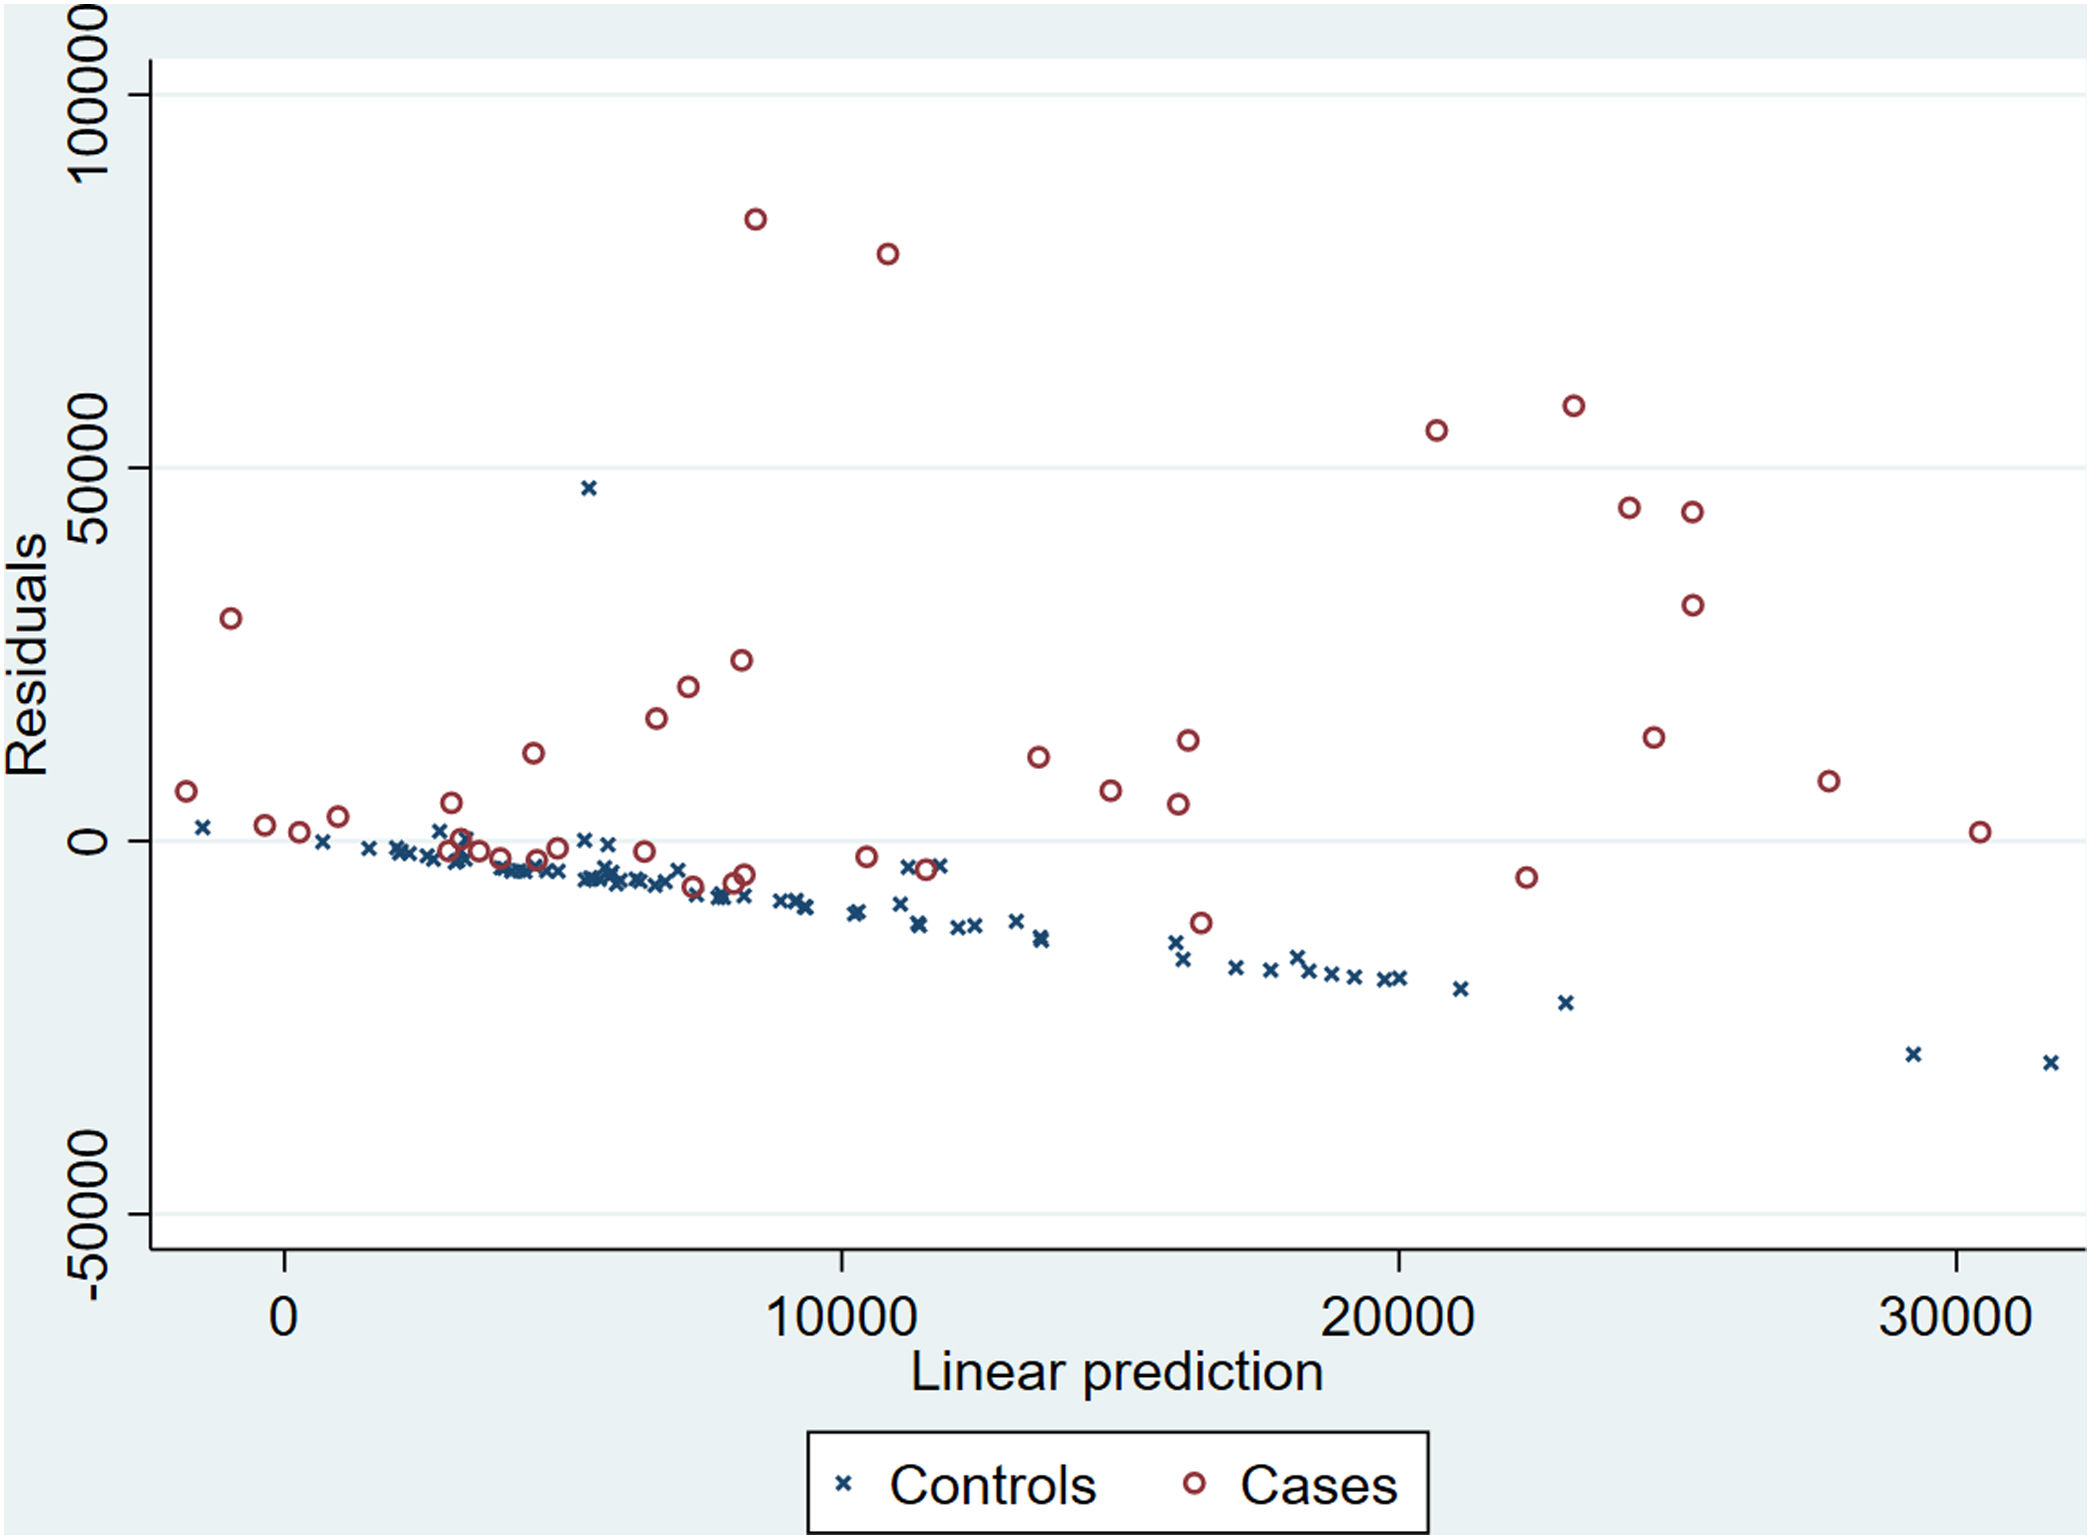
Adjusted R-squared was 0.1224, inferring that the model could explain 12.24% of D-dimer variation. With this model a theoretical value of D-dimer was predicted and the residual values were obtained.
For controls the median residual value was −5276.53 (−11,104.91 to −3297.47) and for cases 5087.11 (−1351.05 to 20,716.89); these results are depicted in Fig. 2.

Given the fulfillment of our theoretical assumption (that residuals will tend to negativity in controls and to positivity in cases) we examined the ROC curve to determine its discriminative performance. The area under the curve for the ROC curve was 0.8837 (95% CI 0.8101 to 0.9361). Our results indicate that the best cut-off point was 2165ng/mL with a sensitivity of 57.9% and specificity of 98.7% for the diagnosis of VTE.
DiscussionOur results suggest that plasma D-dimer levels correlate to those of ferritin, C-reactive protein and fibrinogen. A corrected value can be obtained as a linear function of them. The residual value (real minus estimated D-dimer) is higher in cases than in controls and it can be used to estimate a new cut-off point for the diagnosis of VTE.
COVID-19 is a hypercoagulable state.12 Patients with COVID-19 show elevated plasma levels of D dimer, fibrinogen and other inflammatory markers, as well as high incidence of venous thromboembolism (VTE).3,5,13 A direct relationship between D dimer plasma levels and prognosis has also been described.1 In addition, patients with an upward trend in D-dimer levels are at more risk of thrombotic complications or death than patients with stable D-dimer levels.14 On the other hand, it is well known that inflammatory or infectious diseases other than COVID-19 make blood D dimer levels rise.15
In this context, the use of D dimer to identify patients who would benefit from VTE diagnostic testing is complicated, since thrombosis is not the only mechanism that could justify its elevation and symptoms of COVID-19 (mainly dyspnea) can mimic those of VTE. Therefore, it would be useful to have a correction method that would help identify either patients with a high probability of thrombosis (in whom a VTE diagnostic test should be performed) or those with a low probability (in whom the test could be avoided).
Patients included in this study have similar baseline characteristics to those reported in the biggest Spanish COVID-19 registry,16 indicating that they may constitute a representative sample.
In our study we have found that cases have markedly higher plasma levels of D-dimer than controls. These results are similar to other previously reported.6,7,17–20 However, we have observed smaller differences between group levels of ferritin and fibrinogen which could indicate a similar degree of inflammation; these findings has also been reported by others.19,21 In contrast, some authors have described significant differences in levels of C-reactive protein between patients with and without thrombosis,2 which have not been observed in our study or other published reports.21 Similar to our results, previous reports also point to a correlation between D-dimer and inflammatory markers.4
We have also found that it is possible to estimate a corrected value of D-dimer with a linear model that includes ferritin, C-reactive protein and fibrinogen. This model could explain up to 12.24% of the D-dimer levels variation.
Considering that the model has been calculated using all patients data, it underestimates D-dimer values for cases and overestimates them for controls. Thus, the residual value (real minus predicted) should be positive for cases and negative for controls. This trend has also been confirmed in our study. In our opinion this difference between residuals among groups are more useful to identify patients who would benefit from imaging techniques.
Using a ROC curve analysis, we found that the AUC is 0.8837 which demonstrates a very good discriminative performance. The best cut-off point based on efficiency was 2165ng/mL when using the residual value. This cut-off point has poor sensitivity (57.9%) but it is very specific (98.7%), suggesting that patients having a residual value of 2165ng/mL of higher would benefit from an imaging technique to detect VTE. Dujardin published a logistic regression model including D-dimer and with similar diagnostic accuracy.2 Others have tried to identify an optimal cut-off point for D-dimer values, with mixed results.6,20–22
Although there have been some attempts to estimate the real prevalence of VTE among COVID 19 patients,23 heterogeneity in the studies is high and therefore estimations may be interpreted cautiously. Taking this fact into account we have not try to estimate positive and negative predictive values, since they depend on the prevalence of VTE.
Our study has some limitations that should be weighed carefully. Firstly, as any observational study, it is subject to selection bias; we tried to minimize it by including all patients with VTE and selecting controls consecutively. Secondly, some patients did not have a RT-PCR confirming the diagnostic (due to diagnostic protocol changes during the period of study); in our opinion it should not be a great concern given that we only included patients with clear clinical and radiological findings of COVID-19. In third place, our study does not allow to calculate predictive values given that it does not represent the real prevalence of VTE; it may represent a new line of investigation. Finally, our model requires external prospective validation.
ConclusionIt is possible to estimate a D-dimer corrected value in function of ferritin, C-reactive protein and fibrinogen. Using the observed and estimated value we can obtain a residual value that performs well as a screening method to detect patients who would benefit for further VTE diagnostic testing.
All authors approve the submitted version of the study and agree to be accountable for all aspects of the work in ensuring that questions related to the accuracy or integrity of any part of the work are appropriately investigated and resolved.
FundingThis research did not receive any specific grant from funding agencies in the public, commercial, or not-for-profit sectors.
Conflict of interestsThe authors declare that they have no conflict of interest.
