Faced with the suspicion of pulmonary embolism (PE), the guidelines recommend the use of clinical probability scales, measurement of D-dimer and, in certain cases, confirmation by pulmonary angiography by computed tomography (CTPA) or scintigraphy. Recently, it has been proposed to adjust the D-dimer according to age or use simpler scales (YEARS algorithm) for a better selection of patients.
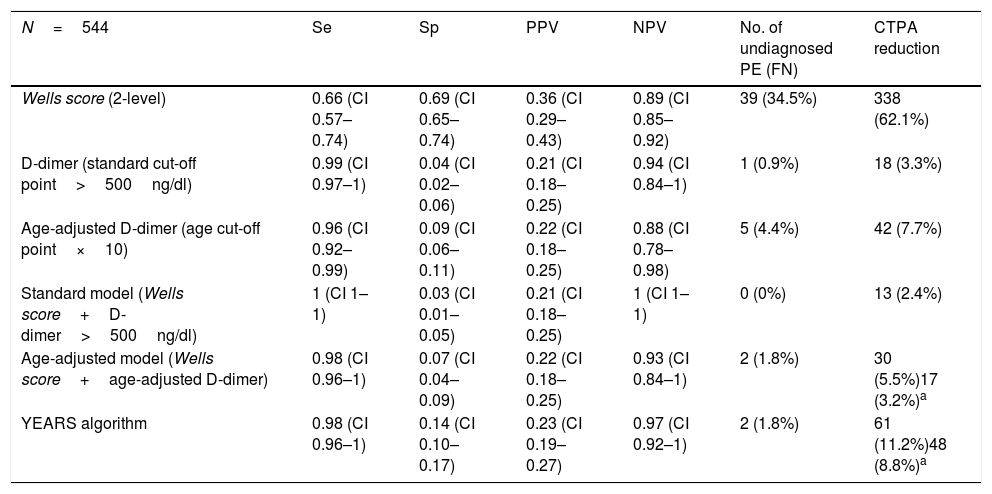
ObjectiveTo define the degree of application of the guidelines in our population and compare sensitivity, specificity and positive and negative predictive values of the different diagnostic models: standard model (Wells 2 categories+D-dimer), model adjusted for age (Wells 2 categories+D-dimer adjusted for age), YEARS algorithm.
Material and methodsA retrospective study of all patients who underwent APTC at our centre for the diagnosis of PE over one year.
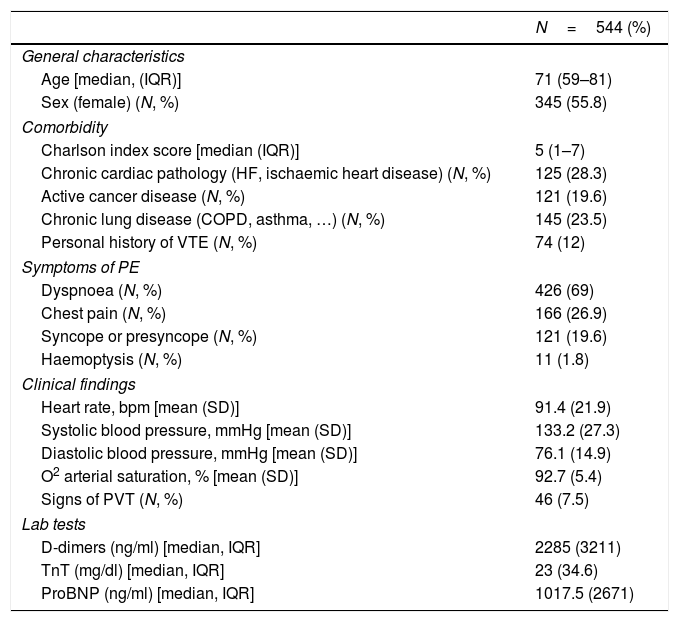
ResultsOf 618 cases (85.4% of initial APTC), 544 patients were included. A total of 113 EPs were diagnosed (20.8%). The degree of application of the standard model was very high (90.1%) and proved to have the best sensitivity and negative predictive value ratio (sensitivity=1.0, negative predictive value=1.0). The new models could reduce the number of scans (17, 3.2% model adjusted for age and 48, 8.8% model YEARS) with a risk of false negatives (2 PE [1.8%] undiagnosed respectively).
ConclusionsThe current diagnostic models for PE lead to a large number of unnecessary explorations. The new models could reduce the number of APTC although with a minimum risk of false negatives.
Ante la sospecha de embolia pulmonar (EP), las guías recomiendan el empleo de escalas de probabilidad clínica, medición del dímero D y, en determinados casos, confirmar mediante angiografía pulmonar mediante tomografía computarizada (APTC) o gammagrafía. Recientemente se ha planteado ajustar el dímero D según edad o usar escalas más sencillas (algoritmo YEARS) para una mejor selección de los pacientes.
ObjetivoDefinir el grado de aplicación de las guías en nuestra población y comparar sensibilidad, especificidad y valores predictivos positivo y negativo de los diferentes modelos diagnósticos: modelo estándar (Wells 2 categorías+dímero D), modelo ajustado por edad (Wells 2 categorías+dímero D ajustado por edad), algoritmo YEARS.
Material y métodosEstudio retrospectivo de todos los pacientes que se sometieron en nuestro centro a APTC para diagnóstico de EP durante un año.
ResultadosDe 618 casos (el 85,4% de las APTC) iniciales se incluyeron 544 pacientes. Se diagnosticaron 113 EP (20,8%). El grado de aplicación del modelo estándar fue muy alto (90,1%) y demostró presentar la mejor relación sensibilidad y valour predictivo negativo (sensibilidad=1, valour predictivo negativo=1). Los nuevos modelos podrían reducir el número de exploraciones (17; 3,2% modelo ajustado por edad y 48; 8,8% modelo YEARS) con riesgo de falsos negativos (2 EP [1,8%] no diagnosticadas respectivamente).
ConclusionesLos modelos diagnósticos actuales para EP llevan a la realización de un gran número de exploraciones innecesarias. Los nuevos modelos podrían reducir el número de APTC aunque con un mínimo riesgo de falsos negativos.


