To know the vascular age (VA) of a sample of general population included in the RICARTO study.
Patients and methodEpidemiological study of the general population aged ≥ 18 from the Health Area of Toledo, based on the health card database. VA was calculated from the absolute cardiovascular risk (CVR) estimated with the Framingham and SCORE equations (type 2 diabetes increased CVR in SCORE 2-fold in men and 4-fold in women). Patients with cardiovascular or renal disease were excluded. An ANCOVA analysis was conducted to adjust and compare the mean of VA by age and sex.
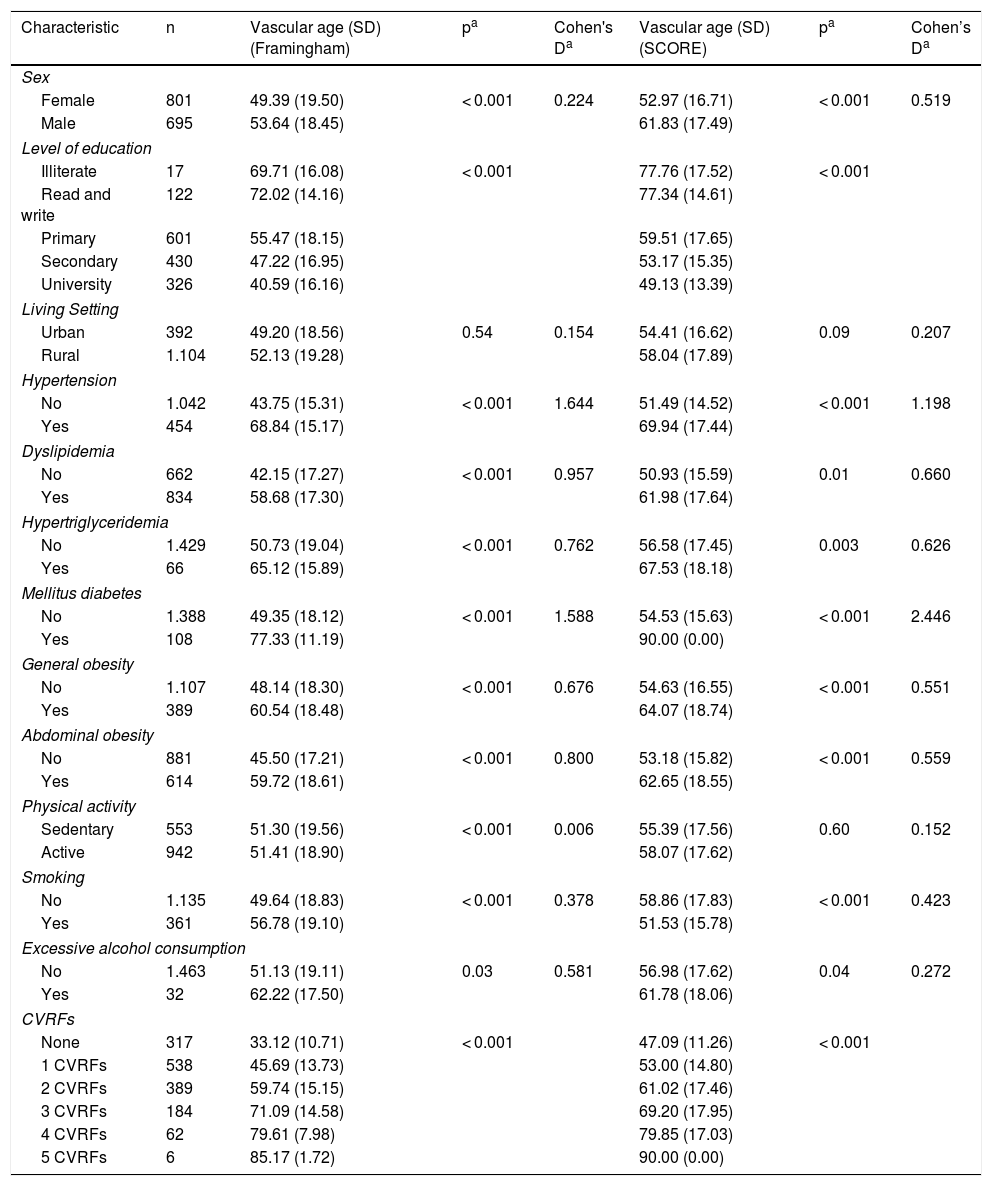
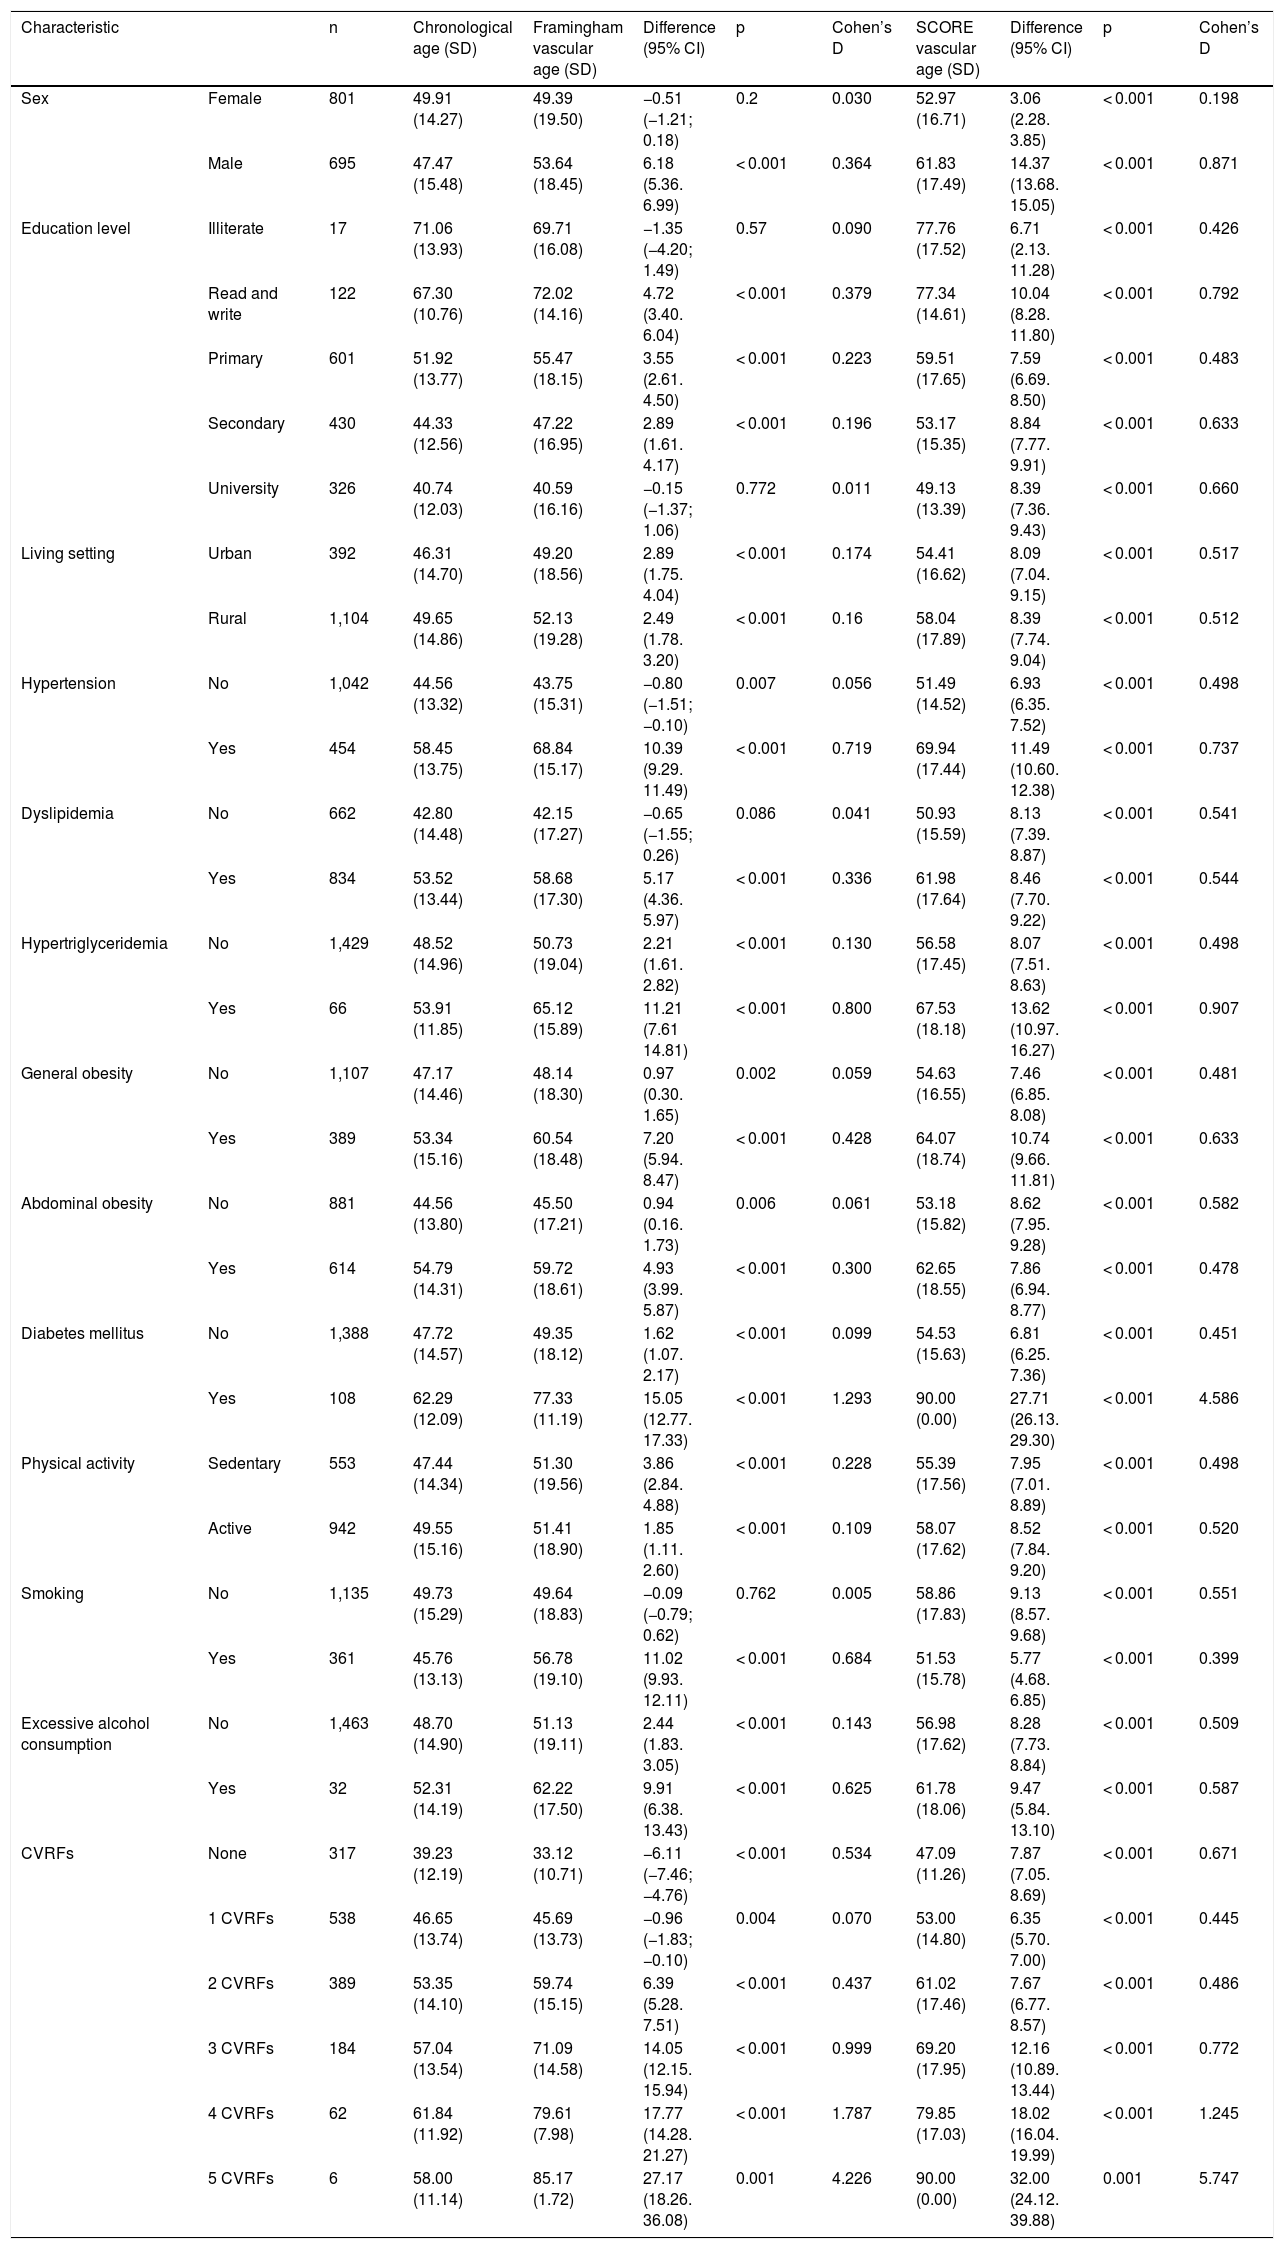
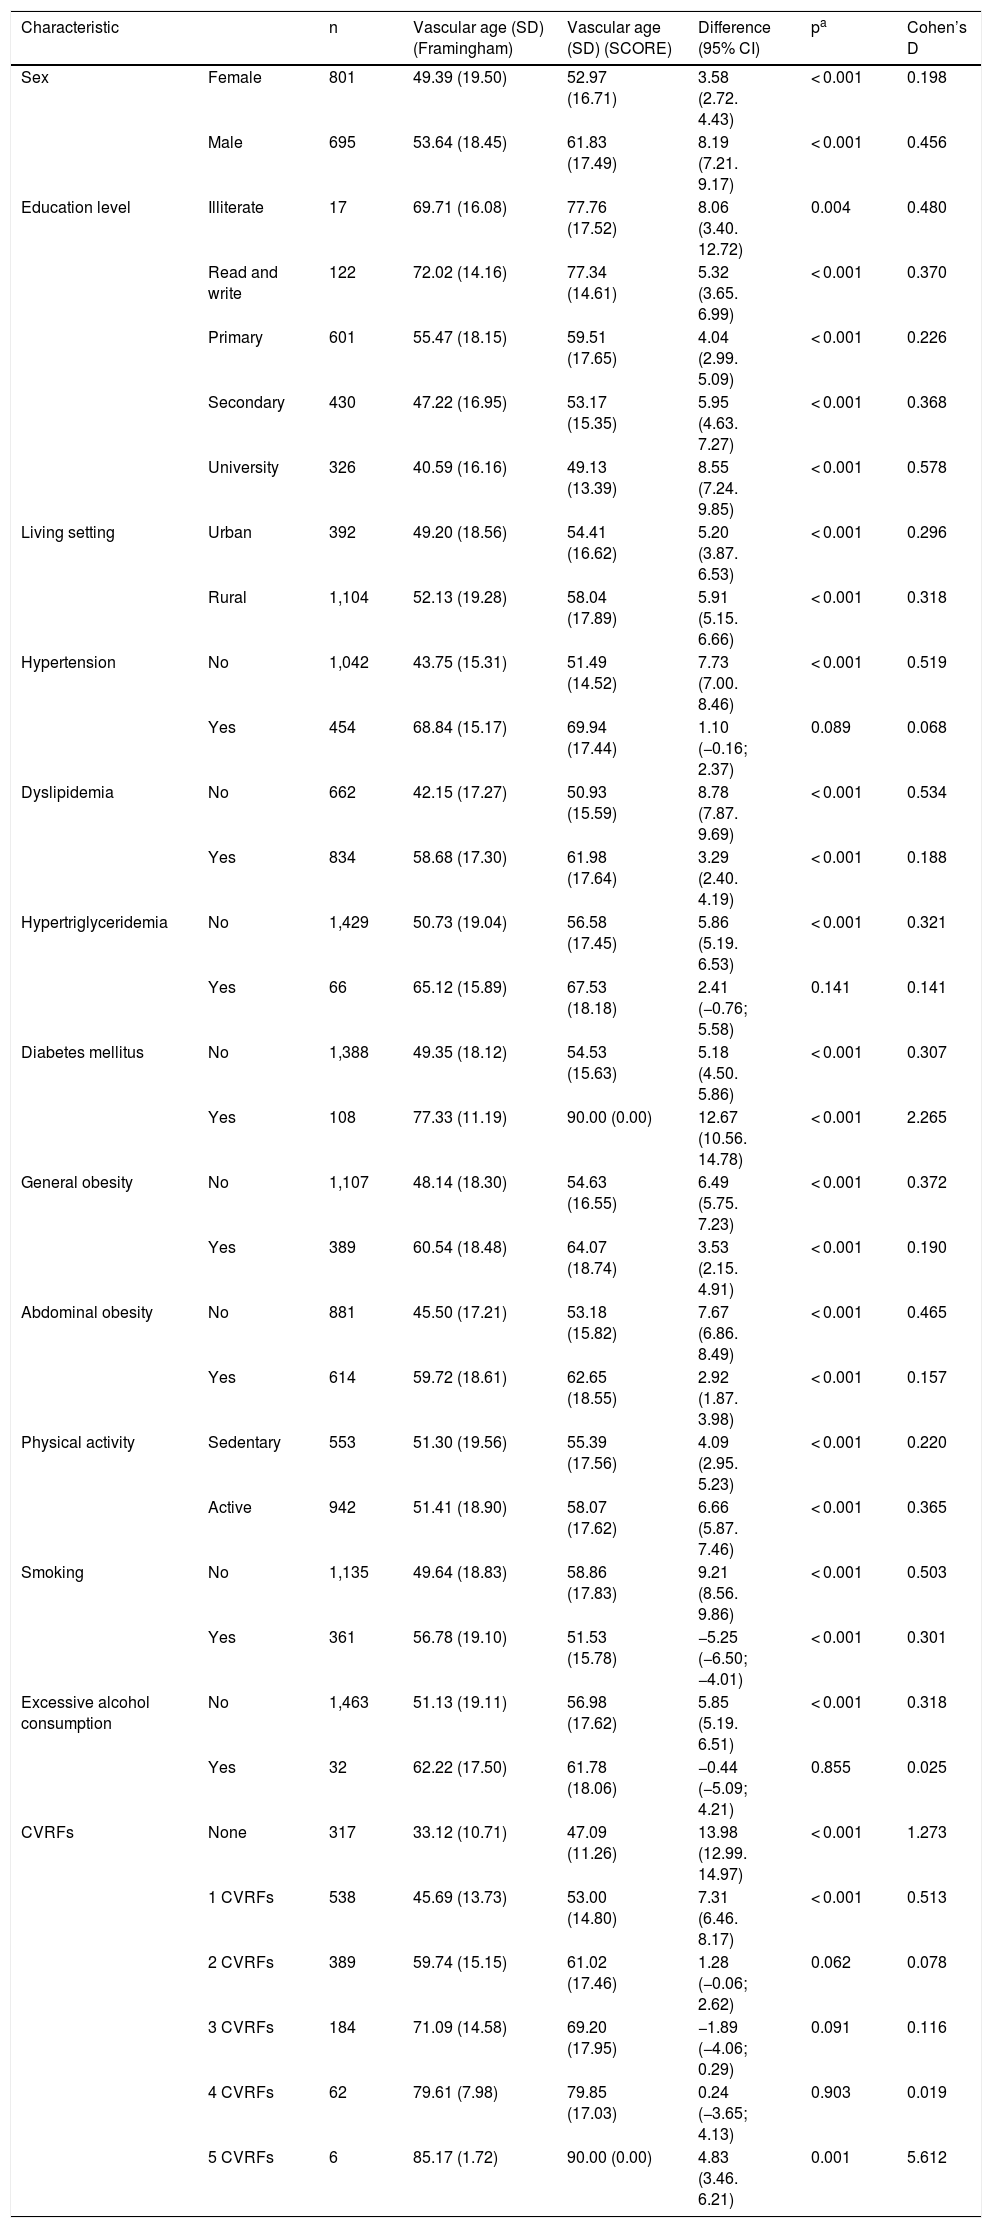
Results1,496 subjects (53.54% women) were analyzed. Mean (SD) age was 48.77 (14.89) years old and. Mean VA was 51.37 (19.13) with Framingham equation and 57.09 (17.63) years old with SCORE equation. VA was significantly higher in men, low education level, arterial hypertension, dyslipidemia, hypertriglyceridemia, diabetes mellitus, abdominal obesity, general obesity, smoking and in individuals with 5 CVR factors vs none (P < .001 in all). Higher differences (Cohen’s D > 0.5) were found in non-diabetic vs diabetic people (1.58 Framingham; 2.44 SCORE), normotensive vs hypertensive subjects (1.64 Framingham; 1.19 SCORE), and non-dyslipidemia vs presence of dyslipidemia (0.95 Framingham; 0.66 SCORE).
ConclusionsVA of our sample is two and a half years older than chronological one with Framingham equation and more than eight years with SCORE equation. Control of CVR factors is the key to get a VA closer to real and to obtain a better cardiovascular health in the population.
Conocer la edad vascular (EV) de una muestra de población general del área sanitaria de Toledo incluida en el estudio RICARTO.
Pacientes y métodoEstudio epidemiológico transversal realizado en población general ≥ 18 años, aleatorizada según tarjeta sanitaria. La EV se calculó a partir del riesgo cardiovascular (RCV) absoluto estimado con las escalas de Framingham y SCORE (la presencia de diabetes mellitus duplicó el RCV obtenido en varones y lo cuadruplicó en mujeres). Se excluyeron los sujetos con patología cardiovascular o renal. Se realizó ANCOVA para ajustar y comparar las medias de EV por edad y sexo.
ResultadosSe analizaron 1.496 individuos (53,54% mujeres), con una edad media (DE) de 48,77 (14,89) años. La EV media fue 51,37 (19,13) años con Framingham y 57,09 (17,63) años con SCORE, resultando significativamente mayor en varones, nivel de estudios bajo, hipertensión arterial, dislipidemia, hipertrigliceridemia, diabetes mellitus, obesidad abdominal, obesidad general, tabaquismo y en sujetos con 5 factores de RCV frente a ninguno (p < 0,001 en todos). Las mayores diferencias (D de Cohen > 0,5) se hallaron entre no diabéticos y diabéticos (1,58 Framingham; 2,44 SCORE), normotensos e hipertensos (1,64 Framingham; 1,19 SCORE) y no dislipidémicos y dislipidémicos (0,95 Framingham; 0,66 SCORE).
ConclusionesEn nuestra muestra la EV es 2,5 años superior a la cronológica con la ecuación de Framingham y más de 8 años con la del SCORE. El control de los factores de RCV es clave para lograr una EV más próxima a la real y lograr una mejor salud cardiovascular de la población.


