

This research evaluated the inter-batch variability in the identification and quality control of glucose, according to international specifications detailed in the guide CLSI EP-15. Type of qualitative research, analytical, not experimental, prospective cross-sectional conducted at the Department of Clinical Laboratory at Polyclinic “La Fe” during January 2015 was performed. The inter-batch variability for glucose in the semi-automated biochemical analyzer URIT-810 with liquid enzyme glucose-LS reagent (GOD-PAP) Valtek® batch 140825 was evaluated. The calibrators (CS) were the lot CS-A: 140 428, CS-B: 120912 and CS-C: 131 202. Data analysis was performed in SPSS version 20.0 statistical analyzer and Microsoft Office Excel 2010 for Windows. The values found by calculating the sigma metric were: 2 (ΔSE −0.35), 0 (ΔSE 1.65) −0.9 (ΔSE −0.75) to CS-A, CS-B and CS-C, respectively (p<0.05). Only CS-A might be able to improve their performance, although with greater cost. Sub-optimal performance characteristics by using standard calibrators show high inter-lot variability, suggesting the choice and search for a new and better calibration method to ensure results that contain no medically important errors affecting patient health.
Glucose is the main energetic biomolecule for most living systems, responsible for maintaining cellular functions through glucid catabolism. Since its isolation in 1747 by Andreas Sigismund, and the discovery of its configuration in 1902 by Emil Fisher, the function of glucose has been explained and correlated with the development of diverse disorders and homeostatic mechanisms for its control.1 Thus, glucose allows for the diagnosis of several disorders, such as diabetes mellitus, Cushing's syndrome, meningeal inflammatory processes, metabolic syndrome, heredofamilial intracorpuscular hemolysis, and even enzymopathies, intolerance or improper carbohydrate enteric absorption, kidney diseases, and in vitro tests for cellular functional status evaluation, in addition to being used as a preservation agent for haemocomponents, among others.2 Hence, glucose is transcendental for diagnosis in almost all clinical laboratories areas.
It is mainly used for diagnosing diabetes mellitus (DM), a metabolic disease which imposes a high economic and social cost in the world today, especially type II DM. Diagnosis is made through signs and symptoms and stimuli/response tests, such as the oral glucose tolerance test (OGTT), among others.3,4 Moreover, explorations of carbohydrate metabolism are employed, such as random glycemias, fasting plasmatic glycemias, the glucose tolerance with corticoids test and, recently, with the glycated hemoglobin A1C test, as well as plasmatic insulin level evaluations, peptide C and glucagon dosing, and glucose in urine and lipid profiles.5–7
Determined values indicate how the organism controls glucose. Biochemical determination is generally performed with reducing methods, enzymatic methods (hexokinase, glucose-oxidase, and glucose-dehydrogenase), and commercial determinations by dry chemistry for clinical diagnosis, as well as for in-home monitoring and immunoradiometric trials. Enzymatic methods in commercial presentations are the most utilized, followed by patient monitoring by dry chemistry, usually with acceptable sensitivity ranges and error margins.8 Nevertheless, glucose is one of the metabolites which suffers more pre-analytic and analytic changes, and one which presents an elevated biological intra- and inter-individual variability. However, the reagent maker incorporates internationally-validated technical specifications; due to different factors, these cannot be reproduced in the routine laboratory, thus making quality control under work conditions which guarantee the quality of their results necessary.9,10
Parameters to ensure quality in clinical biochemistry, as described by the Clinical Laboratory Standards Institute (CLSI), include analytical methods and verification guides which lead to a correct planning and choosing of quality control rules for continuous monitoring of performance under work conditions. Obtaining of these dates the total error of laboratory method (Tea) is comparable to the maximum permissible error designed from different sources like the Clinical Laboratory Improvement Amendments 1988 (CLIA’88), biological variability, RCPA regulatory requirements, etc. Subsequently, planning and method control as well as quality will show continuous improvement.11
Quality verification of a method's analytical characteristics is applicable to all kinds of laboratories. In addition to measurable data on the system's performance (inaccuracy and bias), quality requirements and real reference values are necessary.12 Quality requirements for glucose are diverse, with maximum quantifiable permissible error values up to ±10% (±6mg/dl) in most sources.5,13
Subsequent to the establishment of internal quality control, the same reagent lot should be maintained in biochemistry (and hematology) for a year, in order to control performance.14 Likewise, variability of the control materials from lot-to-lot should be minimal. Since it represents a small amount of observed variation, this should not exceed 10%.15 Amongst the community, the circulation of lyophilized controls is predominant, which, unlike liquid controls, present higher error and stability and lower cost, but require careful handling of volumetric material, distilled water and reconstitution.
Within the community, there are few clinical analysis laboratories with quality systems in biochemistry. Consistent with the evolution of laboratories, most National hospitals and some private Health Centers in Lima maintain internal, external and inter-laboratory quality implementation without a cosmopolitan reach in the capital. The vast majority of new clinical laboratories with economic limitations, interest of profit, or those which are unfamiliar with the clinical impact of results without a quality system only use “standard calibrator” controls, usually semiautomatic biochemical analyzers provided by the manufacturer as a quality reference for work performance evaluation and result reliability.
It is evident that the lack of conscience about this subject and the ample uncertainty produced in the result, since the error is not quantified or corrected, will be magnified progressively and become uncontrollable. In this regard, some of the most commonly used reagents in clinical chemistry amongst the community do not have the same lot inside the kit (in other words, a different lot for the enzymatic reagent and for the standard calibrator). Then, how can the quality of the results be ensured in these conditions?
The objective of this investigation was to assess inter-batch variability in the determination and quality control of glucose, according to the international specifications detailed in the CLSI EP-15-A3 guide.
Method and materialsA qualitative, analytic, non-experimental, prospective cross-sectional study was conducted in the Clinical Laboratory Department at the biochemical area of the “La Fe” Polyclinic Health Care Center during January, 2015. Glucose inter-batch variability was assessed according to the CLSI EP15-A3 guide, highlighting the usefulness of “control letters” (metric sigma, power control chart and Normalized OPSpecs chart).12
SampleOn-probabilistic, sampling intentionally by convenience.
Biochemical analyzerIn order to perform determinations, we used aURIT-810 Medical Electronic (Guangxi, PR China) semiautomatic biochemical analyzer, which was stabilized to 220V, 100 VA.
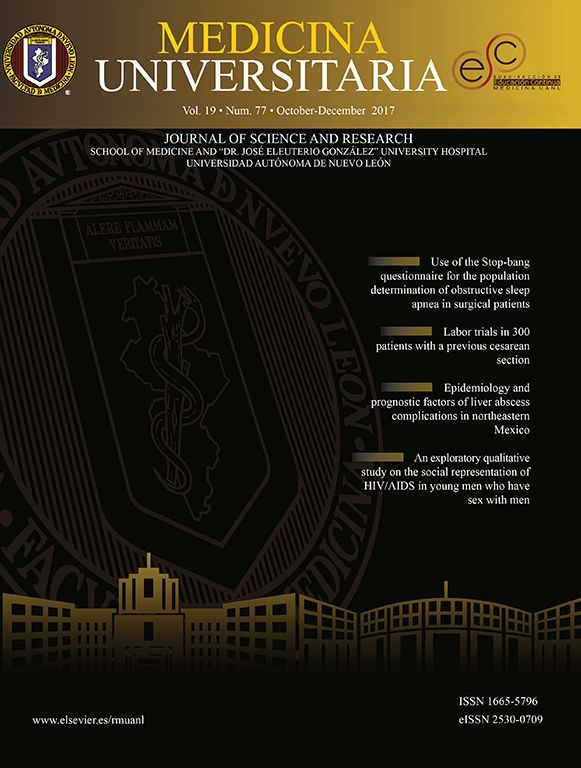
ReagentsValtek®Glucose-LS enzymatic liquid reagent (Valtek diagnosis, Santiago de Chile, Chile) lot 140825, with a storage range between 2 and 8°C, 50ml bottle, with glucose oxidase-peroxidase (GOD-PAP) enzymatic colorimetric method, modified based on the publication by Trinder in 1969.16 First level calibrator kit (calibrator standard glucose “CS” (CS-A)) and normal fixed value (100±1mg/dl) of lot 140428, B and C calibrators (CS-B and CS-C) of lot 120912 and 131202, respectively (100±1mg/dl).
Control reagentIn order to perform method verification, the kit's “standard calibrators” were utilized as controls according to operative needs.
Data recollection technique and sample processingAccording to the maker's recommendations, CSs were stabilized at room temperature (room temperature 25±2°C) for 10min before processing. The equipment stabilized for 10min before the analytic runs. A blank reagent was used before the analysis verification from lot-to-lot. In order to evaluate precision, three sets of measurements were made five days in a row. For the evaluation of veracity, duplicates of the 5 days of the precision protocol of the 3 control materials for glucose were necessary (CS-A, CS-B and CS-C).12 Analytic runs were conducted by the institution's personnel under the work's protocol specifications.17 Procedures for glucose verification were conducted using the CLSI EP-15-A3 guide, measured in standard deviation (SD) and variance coefficient (%VC) to asses bias and imprecision. With the data obtained from %VC, bias and Tea, the dot and operative lines were determined to evaluate the performance of the methodology, demonstrated in graphics within control letters. These determine the amount of controls necessary for the analytical run, as well as the clinical assay control rules.18 The work outline is shown in Fig. 1.
Data analysis technique
Data analysis was done using the statistical analyzer IBM SPSS, version 21 (Armonk, USA) and MS Excel 2010 (Redmond, USA) for windows. The quality matrix was developed in an Excel sheet showing SD, %VC, Tea, six sigma and critical systemic error (SDE or ΔSE).
LimitationsSeveral limitations ought to be addressed before interpreting results.
First, there may be failures in the conservation or stability of standard calibrators, within domestic distribution by franchises or the brand's commercial distributors. These may be the cause for erroneous results. A second limitation is the fact that we were not able to compare the inter-batch glucose variability results found in this study with those described by Valtek reagents for glucose, which do not show significant systemic differences in accuracy and imprecision when compared to other commercial reagents, obtained using the BS series MINDRAY auto-analyzer.16 A third limitation is that the clinical biochemistry laboratory where the study was conducted is not accredited under the ISO 15189 norm, but it does have the technical and managerial requirements of the ISO 9001 norm implemented. The fourth limitation is control sera VALTROL-N (code 210-100) and VALTROL-P (code 210-110) are used in the biochemical field on a weekly basis. Lastly, not all linked protocols were analyzed with method verification (linearity, detection limit, reference values, etc.)11,17. Despite these limitations, this research is the first to describe verification processes, planning and quality control using standard calibrators such as control sera in clinical biochemistry.
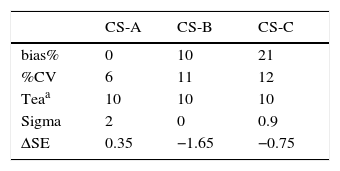
ResultsOf the conducted research, the values found by the sigma metric calculation were 2, 0 and −0.9, for CS-A, CS-B and CS-C, respectively. These indicate a very poor performance, which cannot be controlled or maintained within the application of a statistical control (p<0.05).19 (Table 1)
Average bias%, %CV, tea for glucose with three CS.
| CS-A | CS-B | CS-C | |
|---|---|---|---|
| bias% | 0 | 10 | 21 |
| %CV | 6 | 11 | 12 |
| Teaa | 10 | 10 | 10 |
| Sigma | 2 | 0 | 0.9 |
| ΔSE | 0.35 | −1.65 | −0.75 |
Sigma metric is a process improvement methodology. Its only goal is to reach less than one defect per million (99.9997% successes). Although quality requirements are different for each magnitude, these unify with six sigma in order to compare methods with a single value.20 In this sense, we are able to express values and know statistical control strategies based on sigma, as shown in Fig. 2 as an example.
 provides a robusteness with CS for glucose control.")
Sigma metric for glucose CS-A. The deficient performances shown not optimal quality control process with calibrator standard glucose, none of them quality stimations (National Test Quality, National Method Quality and Local Method Quality) provides a robusteness with CS for glucose control.
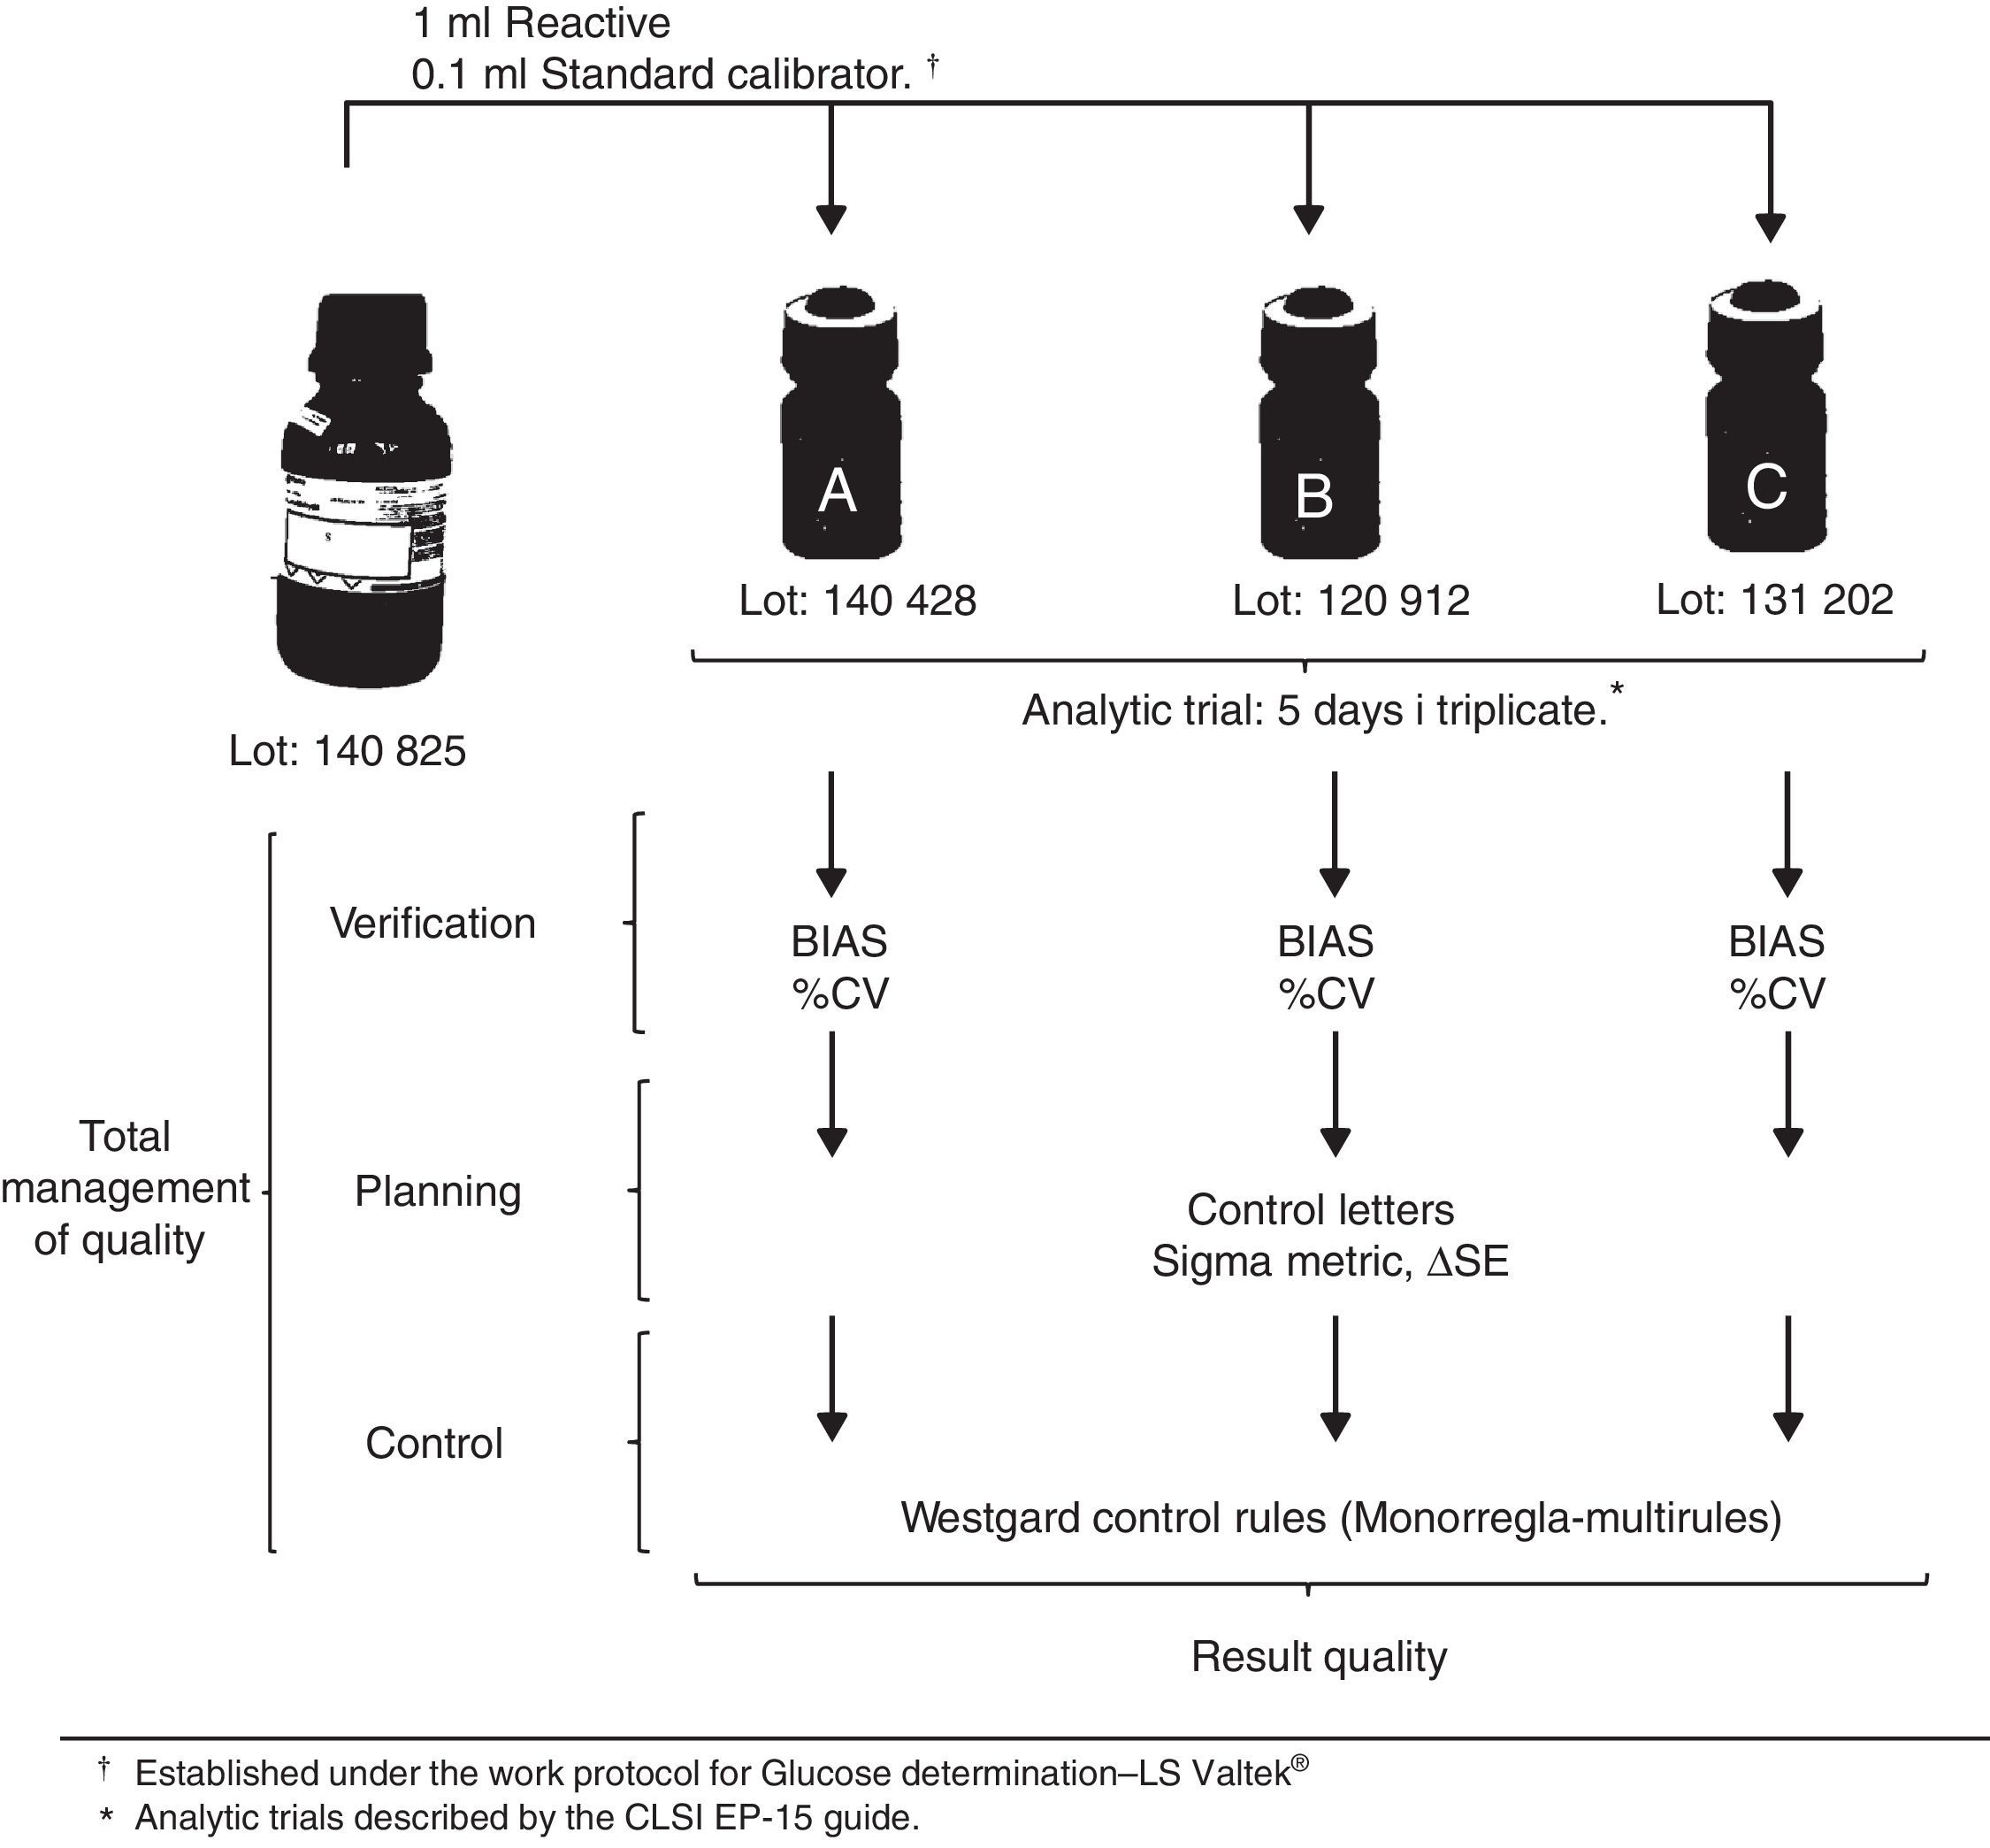
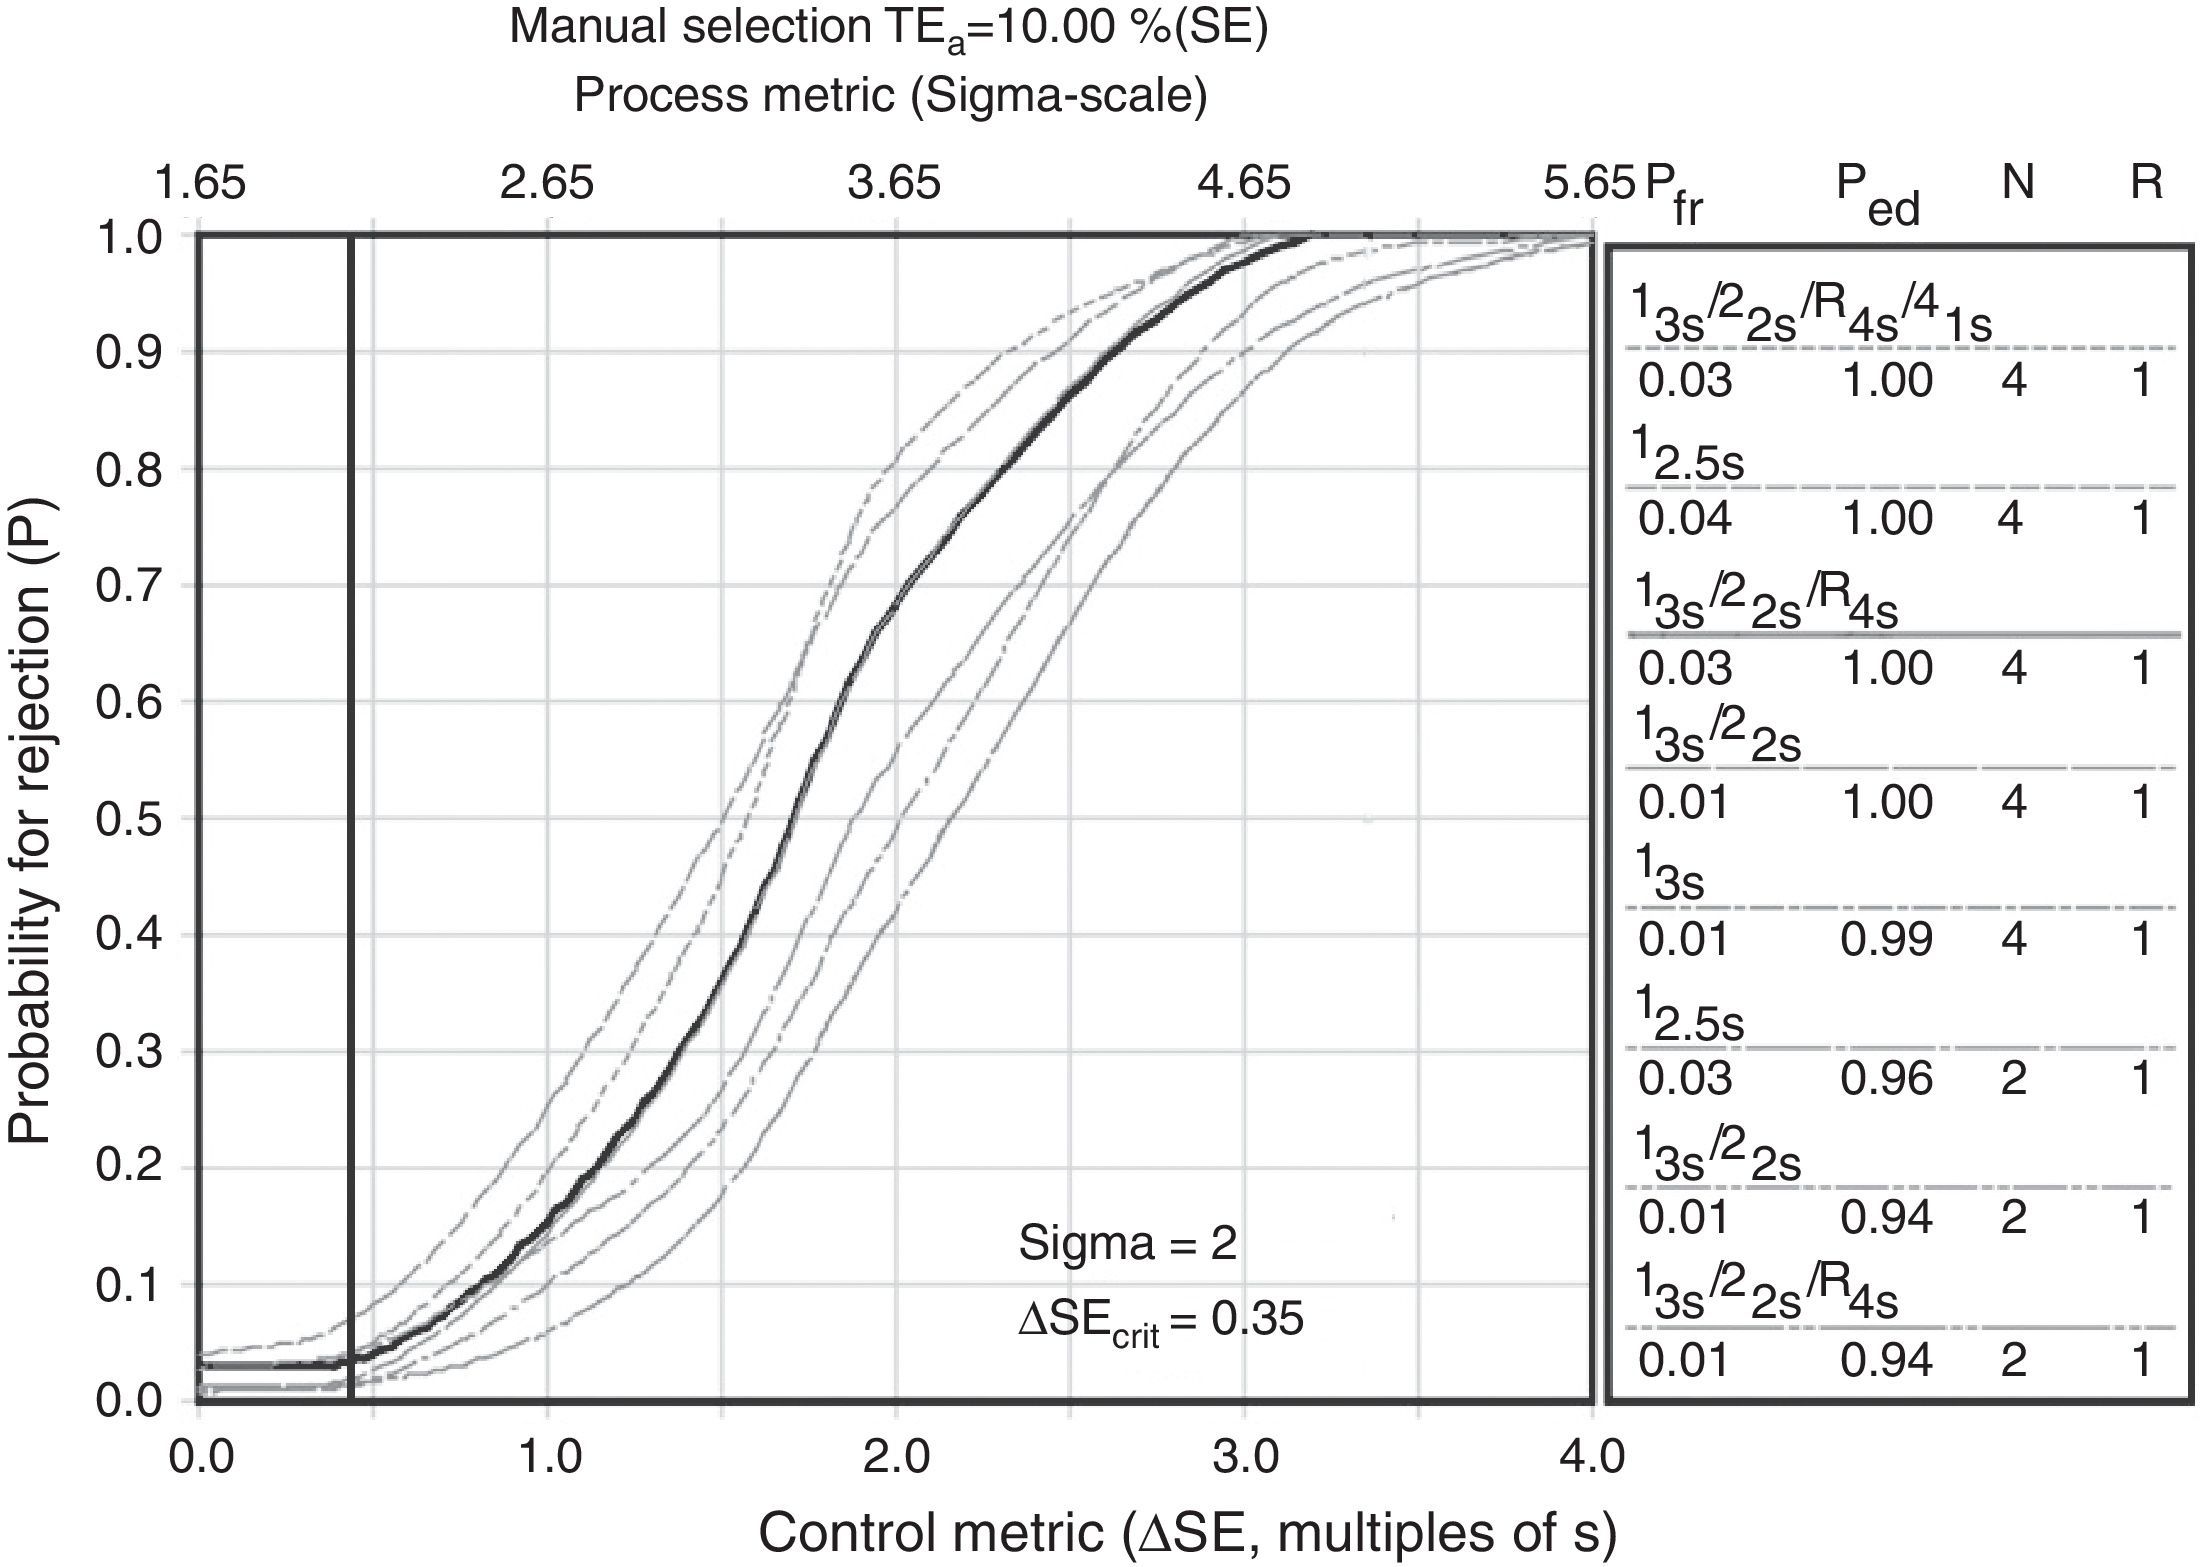
Other control letters are operative specification graphics (OPSpecs) and power control chart. Power control chart represent the most powerful graphic because of the vast amount of data which can be obtained from them during quality planning. These requires ΔSE calculations, based on the method's maximum permissible error, which should not be more than the quality requirements (up to 90% of quality assurance), which equals the statistical value of 1.65 standard deviations.21 These functions present the information about the performance of a rejection probability graphic control rule versus the analytic error measures, as shown in Fig. 3.

Every one of the cases underwent 2 control levels for every analytical run (n=2). Choosing one control rule for every analyte, there are fewer alarms in internal control, thus freeing the analytical run with a good chance of error detection and a low probability of rejecting good runs. Every letter begins with the choice of control rules, according to each case (mono-rules or multi-rules) which evaluate and control immeasurable systemic and random mistakes.
DiscussionPerformance characteristics were not optimal with the use of standard calibrators for glucose determination, according to the sigma metric evaluation (Table 1). These deficient performances (sigma<3) suggest a choice and search for a new and improved calibration method which improves precision, since there is no minimum quality control under the studied conditions. The analysis of results with statistical control strategy charts based on sigma metrics proves that analytical quality control management with standard calibrators provided by the manufacturer are not enough to ensure results free of medically significant errors affecting the health of the patient. Moreover, statistics show the specific concentration test performance in work conditions inherent to the mentioned laboratory.22
The vast majority of clinical chemistry laboratories in Lima, which use manual or semiautomatic methodologies, present a high degree of inaccuracy in glucose and cholesterol determinations, highlighting not only the poor quality of lab results, but also the need for dynamic and efficient controls which ensure quality in processes.23 By not using Good Clinical Laboratory Practices, the error is not quantified, thus uncertainty in the result creates a bad clinical diagnosis. It is worth noting that quality is not a common characteristic amongst biochemical laboratories in Lima. A contrario sensu, with the development and normalization of clinical medicine, doctors and patients are expecting high quality results, which is a challenge for all laboratories in the community.
Results provided during the calibrator's analytical run should be truthful and precise in order to certify that routine analytical determinations ensure a minimum quality and a correct clinical interpretation, in addition to being useful for their inter-laboratory comparability.22,23
OPSpecs’ statistical control letters as well, as power control chart, describe the acceptable imprecision and inaccuracy for a method and quality control necessary to supervise performance, as well as the test performance under stable conditions, and warn if there are any changes that may affect the report. The goal is to obtain <90% probability of error detection (Ped or AQA) and less than 5% probability of false rejection (Pfr), with an N (amount of controls being analyzed) as low as possible and in a single analytical run.24 In the example shown in Fig. 3, none of the rules is eligible, with two controls per analytical run. Through the use of control materials “CS” and a proper statistical management, we are able to prove that no rule or control is useful in the verification of the method.25,26,27
In the same manner, the error in Valtek's critical glucose-LS levels were estimated. The systemic error is the difference between the conventionally truthful value and the median value of a number of determinations which are experimentally measured. Within this investigation, we were able to find a 0%, 10% and 20% of bias for CS-A, CS-B and CS-C, respectively. On the other hand, the systemic error, that is to say the resultant precision of the approximation's repeated measured values, were 6%, 11% and 12% of CS-A, CS-B and CS-C, respectively. These continuous quantitative variables, when expressed graphically, show the wide inter-batch variability and error for glucose. Of these, only lot 140428 (CS-A) could be capable of improving its performance of being indispensable for analysis in the laboratory, in other words, capable of recognizing, monitoring, minimizing and correcting errors, although it would be costly to maintain it within quality.14,15,17
The causes of this variability could be linked to different motives, which it is not an objective of this investigation to describe. But it is to consider whether or not some factors are directly interfering, such the matrix type, signal variation between equipment, lack of noise control, CS behavior in work conditions, measured commutability, transportation and control storage and lack of preventive maintenance, to name a few. In consequence, full routine monitoring is ineludible.
Glucose concentration is very important for endocrinologists, diabetologists and diabetic patients, even when dysglycemic or apparently healthy, particularly when the concentration is close to the upper limit of the reference interval (±10% or 6.1mmol/L).28 The concerning prevalence of diabetes and prediabetes suggests the immediate prioritization of health care in order to avoid future complications. Diagnosis by stimuli-response and/or explorations of the carbohydrate metabolism ought to be evaluated for all phenomena which may intervene during every analysis and generate non-quantifiable errors, which will not ensure quality in results.3,29
ConclusionsIn this investigation, the measure of standard glucose calibrators was performed in order to prove inter-batch variability and the application of control letters, following evaluation procedures recommended by the CLSI EP15 guide. Total error was identified and quality control necessary to control the method performance was evaluated.
The wide inter-batch variety works against result reproducibility and quality, hence we must opt for a different control material for quality monitoring in glucose-LS determination with Valtek® reagents. Quality planning helps clinical analysis laboratories which don’t quantify errors or guarantee a trustworthy diagnosis face quality challenges. However, the problem with variability and quality control estimations is that most laboratory users are not familiarized with the concepts and the measuring process is still hierarchically restrained to reference methods, which ensure process traceability, but are not accessible for every clinical laboratory nationwide.
It is not a problem for our method to work with a certain degree of error. The problem is for this error to be greater than the maximum permissible amount, according to the method's quality specifications. In this sense, quality of results is not guaranteed by using only standard calibrators provided by the manufacturer; this evaluation should be the starting point to develop quality processes.
Analytical chemistry should not only equilibrate a collection of data and methods, but obtain representative samples, optimize methods and interference management and guarantee quality of data. We hope this investigation is able to promote the use of optimal control materials for correct planning and quality control in clinical analysis laboratories.
Funding sourcesSelf-financed by the authors.
Conflict of interestThe authors declare not to have any conflicts of interest.