Multiple illnesses are frequently present in elderly patients, and several different population studies have demonstrated that the number of illnesses per subject increases with age.1 This phenomenon and the ageing population as a whole, new diagnostic and therapeutic developments, and improved health education are some of the factors that have led to an overall increase in the consumption of healthcare resources.2 Studies have indicated that 24% of the population over 65 and 31.4% of the population over 85 have 4 or more chronic conditions.3,4 Neurological disorders (NDs) are a group of diseases affecting the central and peripheral nervous systems. They affect all ages, but consequences in elderly patients are more severe. As a result, neurological disorders comprise one of the groups of diseases that generate the highest costs, not only for the healthcare system (direct costs), but also for society at large (indirect costs).5–7 Care for NDs is frequently provided at the primary care level.8 The purpose of our study is to describe the association between the number of chronic comorbidities and the presence of NDs in patients older than 64 years in a normal clinical practice setting in multiple primary care (PC) clinics in Catalonia. The study also measures health costs associated with these patients.
We completed a retrospective multi-centre study based on medical records (digital medical histories) from patients treated in PC clinics. The study population was made up of subjects of both sexes in 13 PC clinics in Catalonia, administered by 4 providers (Badalona Serveis Assistencials, Consorci Sanitari Integral, GesClínic and La Roca del Vallès). These clinics provide service to a district containing approximately 313500 inhabitants. The study population contained mainly lower-to-middle class residents from an urban industrial area. The study included all patients seeking medical care and registered at 1 of the 13 clinics in 2008. We excluded subjects referred from other PC clinics and subjects whose primary care doctors were in a different district. The study analysed the following variables: (a) general data with age and sex; (b) cases and comorbidities (diagnostic data); and (c) healthcare costs. Comorbidity was determined according to criteria defined by ICPC-2, the International Classification of Primary Care.9,10 The following groups were compared to the general population: (a) all NDs (Table 1) by major diagnostic groups or categories, and (b) certain specific NDs with high prevalence rates (peripheral polyneuropathy and neuritis; cerebrovascular accident [CVA], and vascular/Alzheimer-type dementias). The model used to calculate costs per patient was created by differentiating between semi-fixed costs (operational costs) and variable costs (depending on the activity of each patient creating costs). The main accounting items listed as fixed costs are as follows: staff, purchases, external services, and an array of costs pertaining to infrastructure maintenance and clinic management. The amount of semi-fixed costs assigned per patient was determined by that patient's number of visits to the clinic. Variable costs were calculated according to diagnostic procedures ordered, treatment used (drug prescriptions), and referrals requested by medical personnel at the clinic. These items were listed in the study as laboratory, radiology, or complementary tests; consults with other services; and prescriptions (those paid for by the Catalan Public Health Service). Prices were taken from analytic accounting studies carried out in the clinics and from providers’ bills for intermediate products. Cost per patient was calculated as follows: CPP=(mean cost per visit×number of visits [semi-fixed costs])+(variable costs). We completed a bivariate analysis using ANOVA, the chi-square test, and the Pearson correlation coefficient. Various forward stepwise logistic regression models (Wald statistic) were used to determine comorbidities associated with NDs in general, and neuropathies, CVA, and dementia in particular. They were corrected for age and sex. Healthcare costs (direct costs) were compared using analysis of covariance (ANCOVA) with marginal mean estimate (Bonferroni correction). Statistical analysis was performed using SPSS version 18 for Windows. Statistical significance was set at P<.05.
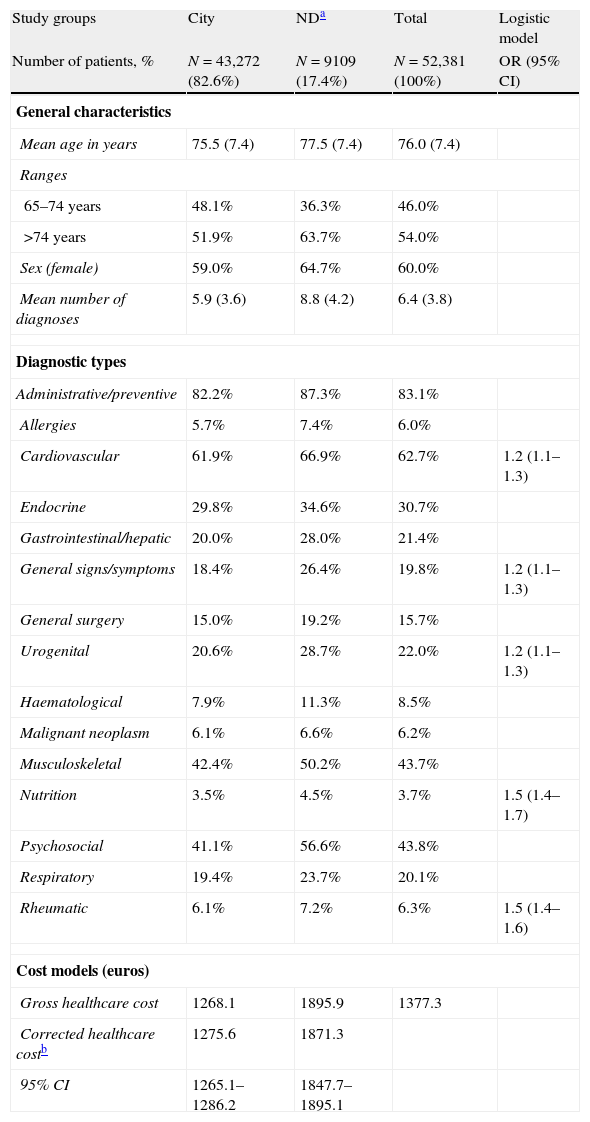
General characteristics of the series studied. Diagnostic groups and healthcare costs associated with neurological disorders compared to costs in the general population.
| Study groups | City | NDa | Total | Logistic model |
| Number of patients, % | N=43,272 (82.6%) | N=9109 (17.4%) | N=52,381 (100%) | OR (95% CI) |
| General characteristics | ||||
| Mean age in years | 75.5 (7.4) | 77.5 (7.4) | 76.0 (7.4) | |
| Ranges | ||||
| 65–74 years | 48.1% | 36.3% | 46.0% | |
| >74 years | 51.9% | 63.7% | 54.0% | |
| Sex (female) | 59.0% | 64.7% | 60.0% | |
| Mean number of diagnoses | 5.9 (3.6) | 8.8 (4.2) | 6.4 (3.8) | |
| Diagnostic types | ||||
| Administrative/preventive | 82.2% | 87.3% | 83.1% | |
| Allergies | 5.7% | 7.4% | 6.0% | |
| Cardiovascular | 61.9% | 66.9% | 62.7% | 1.2 (1.1–1.3) |
| Endocrine | 29.8% | 34.6% | 30.7% | |
| Gastrointestinal/hepatic | 20.0% | 28.0% | 21.4% | |
| General signs/symptoms | 18.4% | 26.4% | 19.8% | 1.2 (1.1–1.3) |
| General surgery | 15.0% | 19.2% | 15.7% | |
| Urogenital | 20.6% | 28.7% | 22.0% | 1.2 (1.1–1.3) |
| Haematological | 7.9% | 11.3% | 8.5% | |
| Malignant neoplasm | 6.1% | 6.6% | 6.2% | |
| Musculoskeletal | 42.4% | 50.2% | 43.7% | |
| Nutrition | 3.5% | 4.5% | 3.7% | 1.5 (1.4–1.7) |
| Psychosocial | 41.1% | 56.6% | 43.8% | |
| Respiratory | 19.4% | 23.7% | 20.1% | |
| Rheumatic | 6.1% | 7.2% | 6.3% | 1.5 (1.4–1.6) |
| Cost models (euros) | ||||
| Gross healthcare cost | 1268.1 | 1895.9 | 1377.3 | |
| Corrected healthcare costb | 1275.6 | 1871.3 | ||
| 95% CI | 1265.1–1286.2 | 1847.7–1895.1 | ||
SD: standard deviation; CI: confidence interval; OR: Odds ratio; ND: neurological disorders.
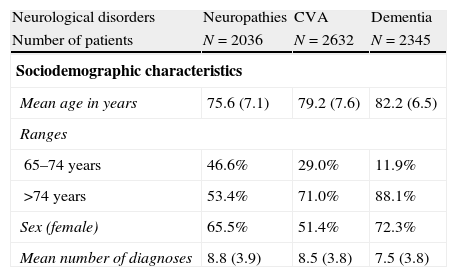
The total number of patients seen in 2008 was 227235. Of this total, 23.1% were aged 65 or older (N=52381); these patients were diagnosed with a mean of 6.4 (3.8) conditions and recorded 10.3 (12.2) visits per year. Mean age was 76.0 years and 60.0% of the patients were female. Table 1 displays the general characteristics of the series, as well as diagnostic categories or groups and healthcare costs associated with NDs in this series as compared to those in the general population. Patients with NDs (compared to the general population) were older (77.5 years vs 75.5 years; P<.001) and included a higher percentage of women (64.6% vs 59.1%; P<.001). The most prevalent conditions were vertigo/dizziness (26.5%) and headaches (18.9%). At least 1 ND was present in 17.4% of the cases (95% CI: 17.2%–17.6%). Mean cost/total corrected unitary cost was €1871 vs €1276. Mean cost/total corrected unitary cost for drugs was €1190 vs €787, with P<.001. The mean number of episodes/diagnoses in patients with NDs was 8.8 vs 5.9, P<.001. There was a slight linear correlation between age and cost of care (r=0.136); the correlation was more pronounced between age and number of diagnoses (r=0.498). Chronic comorbidity in patients with at least 1 ND accounted for 25.4% of the variation in care costs (R2 corrected for age and sex). The result of the final logistical model produced by comparing each of the 3 NDs analysed (independent variable) to data from the general population is shown in Table 2. Dementia has a large impact on comorbidity rates and healthcare costs.
Result of the final logistical model produced by comparing each of the 3 NDs analysed (independent variable) to general population data.
| Neurological disorders | Neuropathies | CVA | Dementia |
| Number of patients | N=2036 | N=2632 | N=2345 |
| Sociodemographic characteristics | |||
| Mean age in years | 75.6 (7.1) | 79.2 (7.6) | 82.2 (6.5) |
| Ranges | |||
| 65–74 years | 46.6% | 29.0% | 11.9% |
| >74 years | 53.4% | 71.0% | 88.1% |
| Sex (female) | 65.5% | 51.4% | 72.3% |
| Mean number of diagnoses | 8.8 (3.9) | 8.5 (3.8) | 7.5 (3.8) |
| Logistic modelOR (95% CI) | Logistic modelOR (95% CI) | Logistic modelOR (95% CI) | |
| General comorbidity | |||
| Ischaemic heart disease (N=3247) | 1.4 (1.1–1.7) | ||
| Cardiac arrhythmias (N=4367) | 1.8 (1.6–2.1) | ||
| Dyslipidaemia (N=13543) | 1.3 (1.1–1.5) | ||
| Arterial hypertension (N=22410) | 1.7 (1.3–2.2) | ||
| Osteoporosis (N=5804) | 1.4 (1.1–1.8) | ||
| Thyroid diseases (N=5049) | 1.4 (1.1–1.6) | ||
| Diabetes mellitus (N=8129) | 1.8 (1.3–2.5) | 1.3 (1.1–1.5) | |
| Degenerative diseases (N=7229) | 1.3 (1.1–1.5) | 1.4 (1.2–1.7) | |
| Bone fractures (N=4399) | 1.8 (1.4–2.4) | ||
| Chronic lower back pain (N=6501) | 1.4 (1.2–1.6) | ||
| Social disorders (N=15205) | 1.8 (1.6–2.0) | 1.9 (1.6–2.3) | |
| Depressive syndrome (N=4956) | 1.7 (1.4–2.0) | 1.9 (1.5–2.3) | |
| COPD (N=3888) | 1.3 (1.2–1.5) | ||
| Cost models (euros) | |||
| Gross healthcare cost | 1798.1 | 2072.5 | 2750.6 |
CVA: cerebrovascular accident (stroke, transient ischaemic attack); SD: standard deviation; dementia: Alzheimer-type and vascular dementia; COPD: chronic obstructive pulmonary disorder; CI: confidence interval; neuropathies: peripheral neuropathies and neuritis; OR: odds ratio.
Logistic model: corrected for age and sex.
P<.001.
Data indicate that generally speaking, NDs are diseases that incur high costs and considerable social repercussions (not measured in our study). It is interesting to note that PC doctors are dedicating considerable effort to treating cardiovascular diseases or addressing cardiovascular risk factors, as the tendency in the immediate future will entail channelling increasing amounts of resources towards these patients, especially elderly ones. Therefore, one short-term scenario for PC personnel involving cost measurement (allotting costs based on cases), flexible adjustment of the list of services (homecare, support for dependent persons, etc.), and disease prevention could improve the volume of good outcomes and social outreach on the PC level.
Our results should only be extrapolated to other populations with caution. The study's greatest limitation is the external validity of the results, since the clinics we analysed do not necessarily represent all clinics in general. Organisational models, clinical practice styles, and patients’ specific characteristics may all constitute biases. However, data obtained from PC clinics may play an important role in helping health authorities adopt measures that are appropriate and cost-effective on the primary-care level, since this level is becoming increasingly involved in ND care. In conclusion, patients in our study who seek treatment for an ND present frequent chronic comorbidities and incur high yearly costs. The impact of dementia is particularly high.
Catalonia Group (Concepción Violan-Fors, Alba Aguado-Jodar, Soledad Velasco-Velasco, Milagrosa Blanca-Tamayo, Esperanza Escribano-Herranz, Ferran Flor-Serra, Josep Ramón Llopart-López, Daniel Rodríguez-López, Encarna Sánchez-Fontcuberta, Josep Maria Vilaseca-Llobet); Balearic Isles Group (José Estelrich-Bennasar, Vicente Juan Verger, María Antònia Mir-Pons, María Vega Martín-Martín, Juan Antonio Pérez-Artigues); and Aragon Group (José María Abad-Díez, María Mercedes Aza Pascual-Salcedo, Daniel Bordonaba-Bosque, Amaya Calderón-Larrañaga, Francisca González-Rubio, Anselmo López-Cabañas, Jesús Magdalena-Belio, Beatriz Poblador-Plou, Antonio Poncel-Falcó).


