Organisational capacity in terms of resources and care circuits to shorten response times in new stroke cases is key to obtaining positive outcomes. This study compares therapeutic approaches and treatment outcomes between traditional care centres (with stroke teams and no stroke unit) and centres with stroke units.
MethodsWe conducted a prospective, quasi-experimental study (without randomisation of the units analysed) to draw comparisons between 2 centres with stroke units and 4 centres providing traditional care through the neurology department, analysing a selection of agreed indicators for monitoring quality of stroke care. A total of 225 patients participated in the study. In addition, self-administered questionnaires were used to collect patients’ evaluations of the service and healthcare received.
ResultsCentres with stroke units showed shorter response times after symptom onset, both in the time taken to arrive at the centre and in the time elapsed from patient's arrival at the hospital to diagnostic imaging. Hospitals with stroke units had greater capacity to respond through the application of intravenous thrombolysis than centres delivering traditional neurological care.
ConclusionCentres with stroke units showed a better fit to the reference standards for stroke response time, as calculated in the Quick study, than centres providing traditional care through the neurology department.
La capacidad organizativa en términos de recursos y circuitos asistenciales que permiten acortar el tiempo de respuesta ante un nuevo caso de ictus es clave para obtener un buen resultado. En este estudio se compararon el abordaje terapéutico y los resultados del tratamiento de centros de asistencia tradicional (equipos de ictus, sin Unidad de Ictus) y con Unidad de Ictus.
MétodosEstudio de tipo prospectivo, cuasiexperimental (sin aleatorización de las unidades analizadas) para realizar comparaciones entre 2 centros con Unidad de Ictus y 4 centros con atención tradicional por Neurología, sobre una selección de indicadores consensuados para monitorizar la calidad de la atención en ictus. Participaron 225 pacientes. Además, se utilizaron cuestionarios autoadministrados para recoger la valoración del servicio y la asistencia sanitaria recibida por parte de los pacientes.
ResultadosLos centros con Unidad de Ictus mostraron menores tiempos de respuesta tras el inicio de los síntomas, tanto al tiempo para llegar al centro, como para el diagnóstico por imagen considerando la hora de llegada del paciente al hospital. La capacidad de respuesta para aplicar tratamiento con trombólisis intravenosa fue mayor entre los hospitales con Unidad de Ictus frente a los centros con atención tradicional por Neurología.
ConclusiónLos centros con Unidad de Ictus mostraron un mejor ajuste a los estándares de tiempos de respuesta de referencia en el ictus, calculados en el estudio Quick frente a los centros con atención tradicional por Neurología.
Stroke is the second most frequent cause of death, the leading cause of disability, and the second leading cause of dementia. The high morbidity and mortality rates associated with the disease have led to the increasing availability of specialised units and the creation of comprehensive action plans.1–5
To ensure adequate treatment response, it is essential to organise resources and care pathways in order to reduce response times in the event of a new case of stroke.6–12 Despite this knowledge, Spanish hospitals show marked differences in stroke care; this makes care quality monitoring a particularly important task.
The objective of this study is to compare treatment approaches and outcomes at traditional healthcare centres (with stroke teams but not dedicated stroke units) and at hospitals with stroke units.
Patients and methodsWe performed a prospective, quasi-experimental study (the participating units were not randomised), comparing a set of indicators between 2 centres with stroke units (group A: Hospital Ramón y Cajal and Complejo Hospitalario de Pamplona) and 4 centres with traditional stroke teams belonging to the neurology department (group B: Hospital de Jaén, Hospital Serranía de Ronda, Hospital San Jorge [Huesca], and Complejo Asistencial de Salamanca). Together, these 6 centres serve a population of 1685008. All hospitals except Hospital Ramón y Cajal and Hospital Serranía de Ronda receive patients with stroke transferred from other local centres. Pre-hospital and in-hospital code stroke protocols are applied at all centres.13 The nurse-to-patient ratio was the same in both hospital groups, although there were differences in the availability of an on-call neurologist on site. All centres except Hospital Serranía de Ronda were equipped to perform magnetic resonance imaging (MRI) and all had computed tomography (CT) scanners. All centres volunteered to participate in the study, having been informed of its objectives, methodology, and the indicators used for monitoring and data comparison.
In this study, the term stroke unit is used to refer to a non-intensive acute care unit with a limited number of beds, inside or belonging to the neurology ward, that exclusively treats patients with stroke.13 Care must be protocolised, with a set of pre-established criteria for admission and a systematic process for diagnosis and specific treatment. The term stroke team is used to refer to a multidisciplinary group of specialists collaborating in the diagnosis and treatment of patients with stroke, coordinated by an expert neurologist and using systematised care protocols, with no geographically delimited structure.13
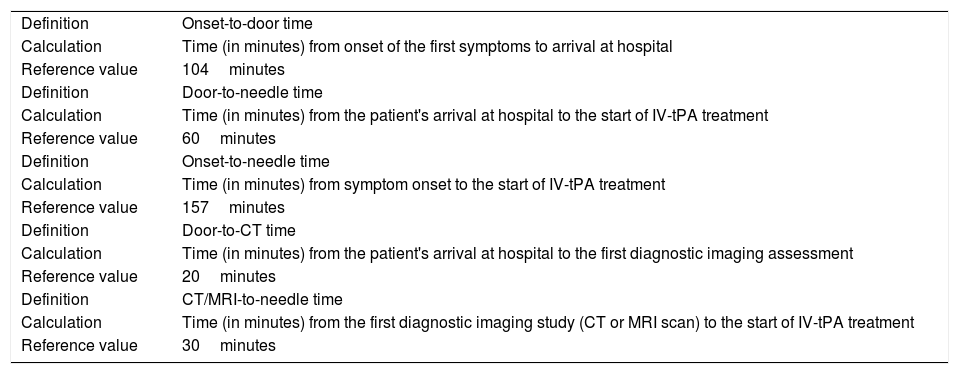
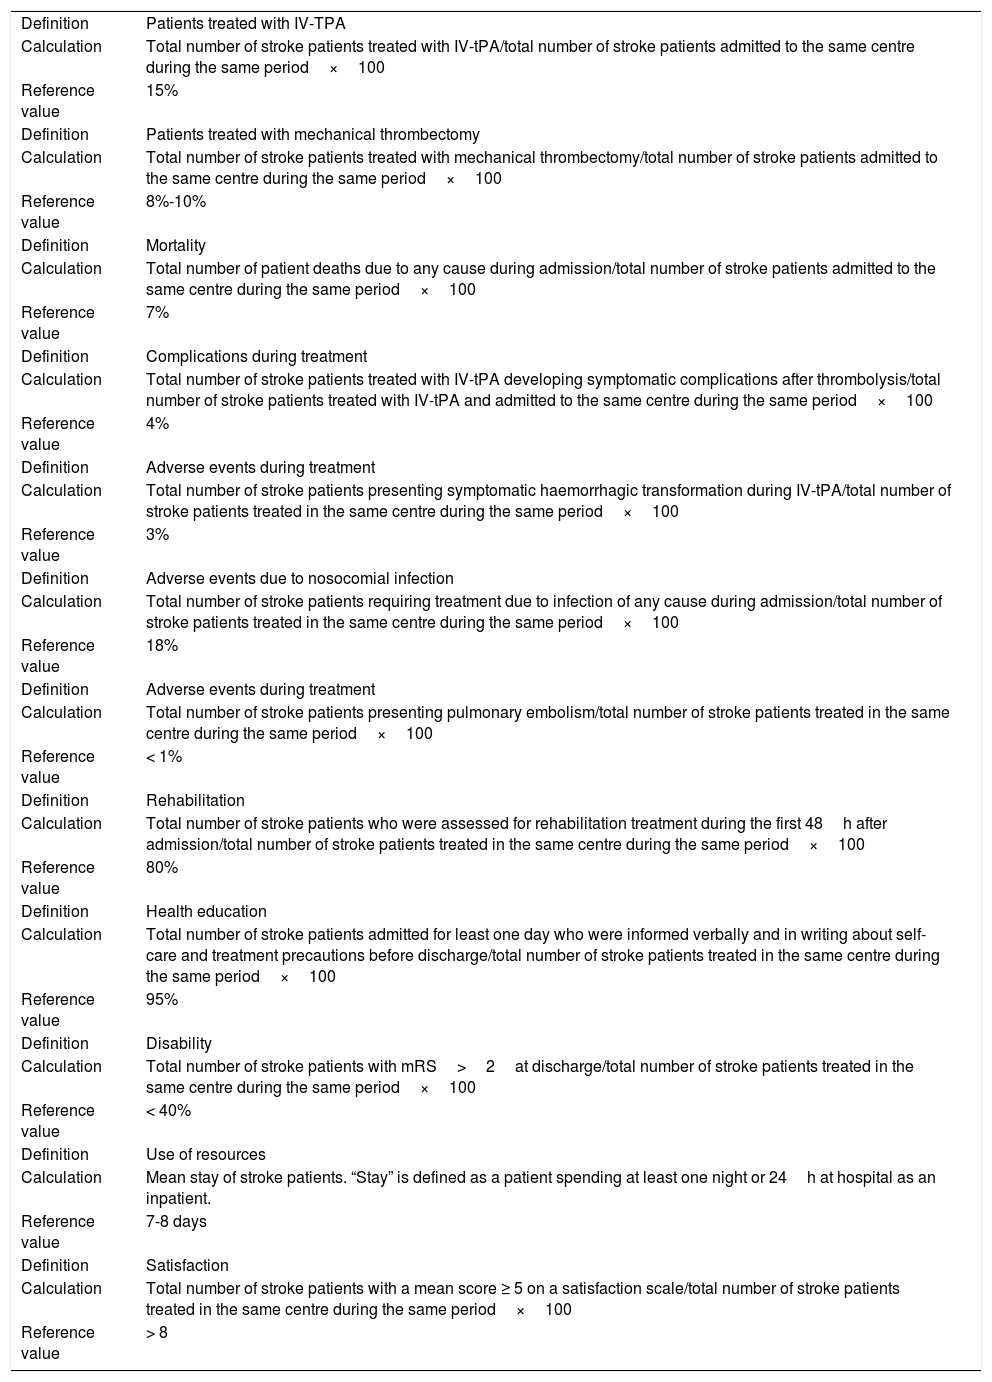
The indicators used (Appendices 1 and 2) were based on the findings of a previous study into stroke care quality indicators.14
Patients were sampled systematically from among all those patients who were admitted between 18 January and 31 May 2016, met the inclusion criteria and none of the exclusion criteria, and agreed to participate in the study, until the established sample size was reached. The sample size was calculated with the aim of detecting differences of 15 or more percentage points between hospitals, assuming a proportion of 0.5 and a drop-out rate of 25%. We considered a confidence level of 95% and a statistical power of 0.8 to be acceptable. This yielded a total sample size of 240 (120 in each group).
We included patients admitted to hospital due to acute ischaemic stroke. Patients could be referred to the neurology department from a primary care centre or from the emergency department at the same hospital or at another centre. We excluded cases of in-hospital stroke and haemorrhagic stroke.
All patients gave informed consent to participate. Patients were identified using a simple blinding system, guaranteeing their privacy and anonymity.
Indicator data were recorded digitally using Google Forms. Each centre had an individual web address for data storage; the forms remained active throughout the established data collection period. They were password-protected and accessible only by the individual responsible for each centre's participation in the study. Data were also recorded on patient perception of the service and care received; these subjective measures are included within the set of indicators and were evaluated using self-administered paper questionnaires, which patients completed at discharge.
In the statistical analysis, the chi-square test was used to compare proportions and the t test or Mann-Whitney U test (depending on whether data were normally distributed) were used to compare means; the median test was also used. The threshold for statistical significance was set at P<.05.
The study was approved as a non–post-authorisation observational study by the Spanish Agency of Medicines and Medical Devices and the research ethics committees of Universidad Miguel Hernández and Hospital de Jaén.
ResultsWe recruited a total of 225 patients (120 in group A and 105 in group B), with 99% of the patients consulted agreeing to participate in the study. The mean age (standard deviation) in our sample was 75 years (12); 96 (43%) were women and approximately half had completed primary education only. The most frequent stroke risk factors were dyslipidaemia (47%) and arterial hypertension (> 70%). Patients in both groups presented similar stroke severity, as measured with the National Institutes of Health Stroke Scale (NIHSS) at admission (Table 1).
Description of the sample.
| Total (n=225) | Group A (n=120) | Group B (n=105) | P | ||||
|---|---|---|---|---|---|---|---|
| Age | |||||||
| Mean | 75.1 | 74.1 | 76.3 | .176a | |||
| Standard deviation | 12.5 | 14.3 | 10.0 | ||||
| Minimum | 13 | 13 | 43 | ||||
| Maximum | 93 | 93 | 93 | ||||
| n | % | n | % | n | % | P | |
|---|---|---|---|---|---|---|---|
| Sex | |||||||
| Men | 126 | 56.8 | 70 | 59.8 | 56 | 53.3 | .329b |
| Women | 96 | 43.2 | 47 | 40.2 | 49 | 46.7 | |
| Highest level of study completed | |||||||
| None | 27 | 12.0 | 10 | 8.3 | 17 | 16.2 | .017b |
| Primary studies | 107 | 47.6 | 50 | 41.7 | 57 | 54.3 | |
| Secondary studies | 65 | 28.9 | 41 | 34.2 | 24 | 22.9 | |
| Professional training | 15 | 6.7 | 12 | 10.0 | 3 | 2.9 | |
| Personal history | |||||||
| Stroke | 47 | 20.9 | 24 | 20.0 | 23 | 21.9 | .726b |
| Diabetes | 54 | 24.0 | 25 | 20.8 | 29 | 27.6 | .234b |
| Dyslipidaemia | 106 | 47.1 | 50 | 41.7 | 56 | 53.3 | .080b |
| Hypertension | 168 | 74.7 | 90 | 75.0 | 78 | 74.3 | .902b |
| Heart failure | 13 | 5.8 | 5 | 4.2 | 8 | 7.6 | .268b |
| Atrial fibrillation | 56 | 24.9 | 35 | 29.2 | 21 | 20.0 | .113b |
| Ischaemic heart disease | 20 | 8.9 | 13 | 10.8 | 7 | 6.7 | .273b |
| Smoking | 44 | 19.6 | 20 | 16.7 | 24 | 22.9 | .243b |
| NIHSS score at admission | |||||||
| Median | 5 | 5 | 5 | ||||
| 0-4 | 104 | 46.2 | 53 | 44.2 | 51 | 48.6 | .213c |
| 5-7 | 42 | 18.7 | 19 | 15.8 | 23 | 21.9 | |
| ≥ 8 | 79 | 35.1 | 48 | 40.0 | 31 | 29.5 | |
Group A: hospitals with stroke units.
Group B: hospitals in which patients with stroke are attended by the neurology department.
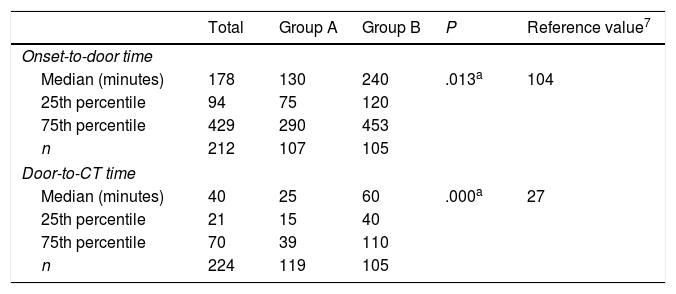
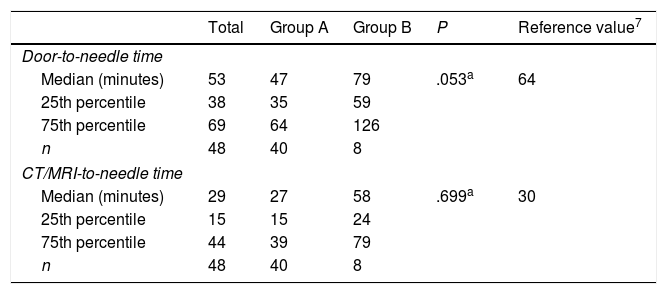
Code stroke was activated before the patient's arrival at hospital in 96 cases (43%), 71 (59%) in group A and 25 (24%) in group B (P<.0001), and during hospitalisation in 116 (52%), 94 (78%) in group A and 22 (21%) in group B (P<.0001). Hospitals in group A had shorter response times than those in group B, both for onset-to-door time and for door-to-CT time (Table 2). Management times (door-to-needle time and CT/MRI-to-needle time) were also shorter in group A hospitals (Table 3).
Comparison of onset-to-door and door-to-CT times in hospitals with and without stroke units (all patients).
| Total | Group A | Group B | P | Reference value7 | |
|---|---|---|---|---|---|
| Onset-to-door time | |||||
| Median (minutes) | 178 | 130 | 240 | .013a | 104 |
| 25th percentile | 94 | 75 | 120 | ||
| 75th percentile | 429 | 290 | 453 | ||
| n | 212 | 107 | 105 | ||
| Door-to-CT time | |||||
| Median (minutes) | 40 | 25 | 60 | .000a | 27 |
| 25th percentile | 21 | 15 | 40 | ||
| 75th percentile | 70 | 39 | 110 | ||
| n | 224 | 119 | 105 | ||
Group A: hospitals with stroke units.
Group B: hospitals in which patients with stroke are attended by the neurology department.
Comparison of process indicators between hospitals with and without stroke units (patients receiving reperfusion treatment with intravenous thrombolysis).
| Total | Group A | Group B | P | Reference value7 | |
|---|---|---|---|---|---|
| Door-to-needle time | |||||
| Median (minutes) | 53 | 47 | 79 | .053a | 64 |
| 25th percentile | 38 | 35 | 59 | ||
| 75th percentile | 69 | 64 | 126 | ||
| n | 48 | 40 | 8 | ||
| CT/MRI-to-needle time | |||||
| Median (minutes) | 29 | 27 | 58 | .699a | 30 |
| 25th percentile | 15 | 15 | 24 | ||
| 75th percentile | 44 | 39 | 79 | ||
| n | 48 | 40 | 8 | ||
Group A: hospitals with stroke units.
Group B: hospitals in which patients with stroke are attended by the neurology department.
Intravenous tissue plasminogen activator (IV-tPA) was administered to 48 patients (21.3%), 40 (33.3%) in group A and 8 (7.6%) in group B (P<.0001). In group B, pre-hospital code stroke activation was not associated with a higher proportion of patients receiving IV-tPA (4 vs 4; P=.17).
Most patients receiving IV-tPA were admitted to hospital following pre-hospital code stroke activation (34 vs 14; P<.0001). In group A, this was also the case: 30 of the 40 patients receiving IV-tPA were admitted following pre-hospital code stroke activation (P<.05). In group B, on the other hand, this association was not observed (4 vs 4, P=.17). In-hospital code stroke activation was also recorded in a higher proportion of patients receiving IV-tPA, both in the total sample (45 vs 3; P<.001) and in each subgroup (group A: 39 vs 1, P<.001; group B: 6 vs 2, P<.001).
Eleven patients from group A hospitals (4.9%) received endovascular treatment (mechanical thrombectomy). This procedure was not performed in any of the patients treated at group B hospitals.
The 79 patients with NIHSS scores ≥ 8 (60th percentile) at admission showed a greater mortality rate than those scoring < 8 (13.9% vs 0.7%, P<.000), as well as poorer prognosis according to the modified Rankin Scale (mRS) (64.6% vs 28.1%; P<.000). Furthermore, patients with higher NIHSS scores at admission more frequently received IV-tPA (28 vs 20; P<.001) in group A hospitals; this was not the case in group B hospitals (6 vs 25; P<.003). Patients receiving IV-tPA presented higher rates of haemorrhagic complications (7.6% vs 0.7%; P<.004) and nosocomial infections (35.4% vs 6.2%; P<.000).
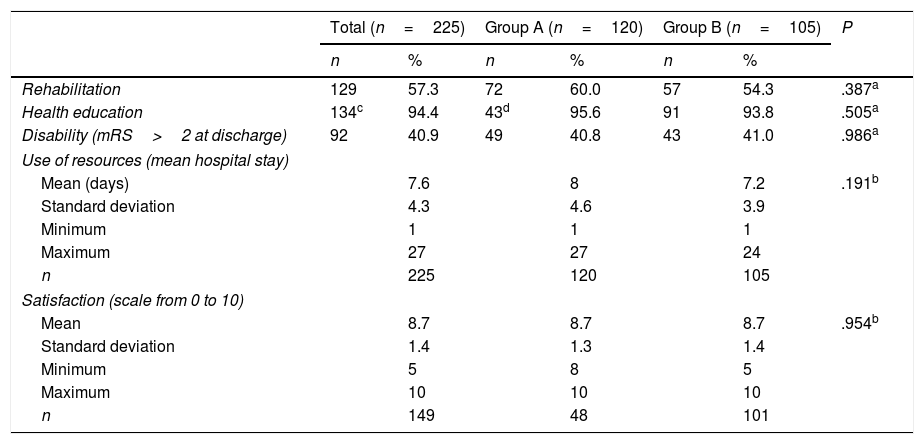
A similar proportion of patients in both groups received rehabilitation (P=.387) (Table 4). In group A hospitals, rehabilitation was indicated in similar numbers of patients receiving IV-tPA and those not receiving this treatment (25 vs 15; P=.693). In group B, on the other hand, rehabilitation was more frequently necessary among patients who received IV-tPA than among those who did not (7 vs 50; P<.05). Health education was given in a similar number of cases in both hospital groups (P=.505). Hospitalisation time was also similar in both groups (P=.191). Neither did we observe differences between groups in the number of patients presenting disability at discharge (mRS>2; P=.986) or the level of satisfaction with the care received (P=.954). However, we did observe a lower rate of disability at discharge among patients who received IV-tPA than among those who did not, in both hospital groups (group A: 19 vs 30, P<.05; group B: 2 vs 41, P<.001).
Comparison of outcome indicators between hospitals with and without stroke units.
| Total (n=225) | Group A (n=120) | Group B (n=105) | P | ||||
|---|---|---|---|---|---|---|---|
| n | % | n | % | n | % | ||
| Rehabilitation | 129 | 57.3 | 72 | 60.0 | 57 | 54.3 | .387a |
| Health education | 134c | 94.4 | 43d | 95.6 | 91 | 93.8 | .505a |
| Disability (mRS>2 at discharge) | 92 | 40.9 | 49 | 40.8 | 43 | 41.0 | .986a |
| Use of resources (mean hospital stay) | |||||||
| Mean (days) | 7.6 | 8 | 7.2 | .191b | |||
| Standard deviation | 4.3 | 4.6 | 3.9 | ||||
| Minimum | 1 | 1 | 1 | ||||
| Maximum | 27 | 27 | 24 | ||||
| n | 225 | 120 | 105 | ||||
| Satisfaction (scale from 0 to 10) | |||||||
| Mean | 8.7 | 8.7 | 8.7 | .954b | |||
| Standard deviation | 1.4 | 1.3 | 1.4 | ||||
| Minimum | 5 | 8 | 5 | ||||
| Maximum | 10 | 10 | 10 | ||||
| n | 149 | 48 | 101 | ||||
Group A: hospitals with stroke units.
Group B: hospitals in which patients with stroke are attended by the neurology department.
Our data show that activation of the code stroke protocol increases the number of patients treated with IV-tPA; this finding is consistent with the results of other studies.1,3,5,8 In our sample, up to 5 times more patients received this treatment when the necessary provisions were made within the hospital organisation.
Data recorded on process indicators show that group A hospitals achieved better stroke response times than group B hospitals, according to the reference values calculated in the Quick project.7 A higher rate of patients treated with IV-tPA was observed in group A hospitals. Furthermore, treatment with mechanical thrombectomy was only recorded in hospitals from group A. In group B, no patients were referred to stroke centres due to the lack of a care pathway. Indirectly, this demonstrates the need for smaller hospitals, which usually lack stroke units, to review and restructure neurology department care processes in order to respond appropriately to cases of acute stroke, including pathways for the referral of patients to stroke reference centres.
However, the results of patient surveys did not significantly differ between hospital groups, with patients from both groups reporting a similar level of satisfaction with the care received.
Several limitations should be taken into account when interpreting these data. While the study included centres belonging to different healthcare administrations, and therefore with different organisational models, it should be noted that all centres volunteered to participate and were not selected randomly. Some of the smaller hospitals did not receive the anticipated number of patients due to a lower number of cases during the data collection period; this resulted in a 6% reduction in cases with respect to the established sample size. The availability of an on-call neurologist, either on site or off site, in accordance with the practices at each hospital, probably had an impact on the differences observed between hospitals in group B as well as on the differences found between both hospital groups.
Taken as a whole, our findings suggest that hospitals not equipped with a stroke unit should restructure their care processes to enable a better response in cases of acute stroke, and that rehabilitation of these patients should be started during the acute phase in order to improve patient outcomes.
FundingThis study was sponsored within the framework of a collaboration agreement with Boehringer Ingelheim España, S.A.
Conflicts of interestThe authors have no conflicts of interest to declare.
| Definition | Onset-to-door time |
| Calculation | Time (in minutes) from onset of the first symptoms to arrival at hospital |
| Reference value | 104minutes |
| Definition | Door-to-needle time |
| Calculation | Time (in minutes) from the patient's arrival at hospital to the start of IV-tPA treatment |
| Reference value | 60minutes |
| Definition | Onset-to-needle time |
| Calculation | Time (in minutes) from symptom onset to the start of IV-tPA treatment |
| Reference value | 157minutes |
| Definition | Door-to-CT time |
| Calculation | Time (in minutes) from the patient's arrival at hospital to the first diagnostic imaging assessment |
| Reference value | 20minutes |
| Definition | CT/MRI-to-needle time |
| Calculation | Time (in minutes) from the first diagnostic imaging study (CT or MRI scan) to the start of IV-tPA treatment |
| Reference value | 30minutes |
| Definition | Patients treated with IV-TPA |
| Calculation | Total number of stroke patients treated with IV-tPA/total number of stroke patients admitted to the same centre during the same period×100 |
| Reference value | 15% |
| Definition | Patients treated with mechanical thrombectomy |
| Calculation | Total number of stroke patients treated with mechanical thrombectomy/total number of stroke patients admitted to the same centre during the same period×100 |
| Reference value | 8%-10% |
| Definition | Mortality |
| Calculation | Total number of patient deaths due to any cause during admission/total number of stroke patients admitted to the same centre during the same period×100 |
| Reference value | 7% |
| Definition | Complications during treatment |
| Calculation | Total number of stroke patients treated with IV-tPA developing symptomatic complications after thrombolysis/total number of stroke patients treated with IV-tPA and admitted to the same centre during the same period×100 |
| Reference value | 4% |
| Definition | Adverse events during treatment |
| Calculation | Total number of stroke patients presenting symptomatic haemorrhagic transformation during IV-tPA/total number of stroke patients treated in the same centre during the same period×100 |
| Reference value | 3% |
| Definition | Adverse events due to nosocomial infection |
| Calculation | Total number of stroke patients requiring treatment due to infection of any cause during admission/total number of stroke patients treated in the same centre during the same period×100 |
| Reference value | 18% |
| Definition | Adverse events during treatment |
| Calculation | Total number of stroke patients presenting pulmonary embolism/total number of stroke patients treated in the same centre during the same period×100 |
| Reference value | < 1% |
| Definition | Rehabilitation |
| Calculation | Total number of stroke patients who were assessed for rehabilitation treatment during the first 48h after admission/total number of stroke patients treated in the same centre during the same period×100 |
| Reference value | 80% |
| Definition | Health education |
| Calculation | Total number of stroke patients admitted for least one day who were informed verbally and in writing about self-care and treatment precautions before discharge/total number of stroke patients treated in the same centre during the same period×100 |
| Reference value | 95% |
| Definition | Disability |
| Calculation | Total number of stroke patients with mRS>2at discharge/total number of stroke patients treated in the same centre during the same period×100 |
| Reference value | < 40% |
| Definition | Use of resources |
| Calculation | Mean stay of stroke patients. “Stay” is defined as a patient spending at least one night or 24h at hospital as an inpatient. |
| Reference value | 7-8 days |
| Definition | Satisfaction |
| Calculation | Total number of stroke patients with a mean score ≥ 5 on a satisfaction scale/total number of stroke patients treated in the same centre during the same period×100 |
| Reference value | > 8 |
Please cite this article as: Masjuan J, Gállego Culleré J, Ignacio García E, Mira Solves JJ, Ollero Ortiz A, Vidal de Francisco D, et al. Resultados en el tratamiento del ictus en hospitales con y sin Unidad de Ictus. Neurología. 2020;35:16–23.
Part of this study was presented at the 34th Congress of the Spanish Society for Healthcare Quality.


