


Supplement "Advances in Musculoskeletal Radiology"
More infoLow back pain (LBP) is one of the most frequent reasons for medical consultation. Most of the patients will have nonspecific LBP, which usually are self-limited episodes. It is unclear which of the diagnostic imaging pathways is most effective and costeffective and how the imaging impacts on patient treatment. Imaging techniques are usually indicated if symptoms remain after 6 weeks. Magnetic resonance imaging (MRI) is the diagnostic imaging examination of choice in lumbar spine evaluation of low back pain; however, availability of MRI is limited.
ObjectivesTo evaluate the diagnostic accuracy of computed tomography (CT) with MRI (as standard of reference) in the evaluation of chronic low back pain (LBP) without red flags symptoms. To compare the results obtained by two radiologists with different grades of experience.
Materials and methodsPatients with chronic low back pain without red flags symptoms were retrospectively reviewed by two observers with different level of experience. Patients included had undergone a lumbar or abdominal CT and an MRI within a year. Once the radiological information was collected, it was then statistically reviewed. The aim of the statistical analysis is to identify the equivalence between both diagnostic techniques. To this end, sensitivity, specificity and validity index were calculated. In addition, intra and inter-observer reliability were measured by Cohen’s kappa values and also using the McNemar test.
Results340 lumbar levels were evaluated from 68 adult patients with chronic low back pain or sciatica. 63.2% of them were women, with an average age of 60.3 years (SD 14.7). CT shows high values of sensitivity and specificity (>80%) in most of the items evaluated, but sensitivity was low for the evaluation of density of the disc (40%) and for the detection of disc herniation (55%). Moreover, agreement between MRI and CT in most of these items was substantial or almost perfect (Cohen’s kappa-coefficient > 0’8), excluding Modic changes (kappa = 0.497), degenerative changes (kappa0.688), signal of the disc (kappa = 0.327) and disc herniation (kappa = 0.639). Finally, agreement between both observers is mostly high (kappa > 0.8). Foraminal stenosis, canal stenosis and the grade of the canal stenosis were overdiagnosed by the inexperienced observer in the evaluation of CT images.
Conclusions and significanceCT is as sensitive as lumbar MRI in the evaluation of most of the items analysed, excluding Modic changes, degenerative changes, signal of the disc and disc herniation. In addition, these results are obtained regardless the experience of the radiologist. The rising use of diagnostic medical imaging and the improvement of image quality brings the opportunity of making a second look of abdominal CT in search of causes of LBP. Thereby, inappropriate medical imaging could be avoided (2). In addition, it would allow to reduce MRI waiting list and prioritize other patients with more severe pathology than LBP.
La lumbalgia y la lumbociatalgia crónica son una de las causas más frecuentes de consulta médica. La mayor parte de los pacientes se diagnostican con criterios clínicos, no necesitando pruebas de imagen y siendo episodios autolimitados. No existe consenso actualmente sobre el mejor manejo de estos pacientes ni cuál es la medida más costo-eficaz. Sin embargo, generalmente las pruebas de imagen están indicadas en el caso de que sea crónico (>6 semanas). El gold standard es la resonancia magnética (RM), lo que supone una sobrecarga en los servicios de radiología debido a la alta prevalencia de esta patología y la generación de importantes listas de espera.
ObjetivosEvaluar si la tomografía computerizada lumbar (TC) presenta la misma validez que la RM lumbar en el estudio de la lumbalgia/lumbociatalgia crónica. Valorar si existe concordancia de los resultados obtenidos entre dos radiólogos con distinto grado de experiencia.
Materiales y métodosEstudio restrospectivo de pacientes con lumbalgia/lumbociatalgia crónica, a los que se les realizó tanto RM lumbar como TC lumbar. La lectura de las imágenes la han realizado un radiólogo experto con más de 25 años de experiencia y un adjunto de primer año de manera independiente. Se estiman los índices de validez de sensibilidad y especificidad y se analizaron la concordancia intra e interbservadores mediante el cálculo del índice Kappa de concordancia y del test de asimetría de McNemar.
ResultadosSe han evaluado un total de 340 niveles vertebrales en 68 pacientes adultos con lumbalgia o lumbociatalgia crónica, mujeres en un 63.2% y con una edad media de 60.3 años (DE 14.7). La TC presenta índices de sensibilidad y especificidad altos (>80%) en todas las variables, pero la sensibilidad es muy baja en la señal de disco (40%) y en el diagnóstico de hernia (55%). La concordancia entre ambas técnicas es buena (kappa > 0.7), salvo para los cambios Modic (kappa = 0.497), los cambios degenerativos (kappa = 0.688), la señal de disco (kappa = 0.327) y la hernia discal (kappa = 0.639). En cuanto a la concordancia entre observadores, en general es alta con kappa > 0.8. En TC, las discrepancias asimétricas se presentan en la valoración de la estenosis foraminal, la estenosis de canal y del grado de estenosis de canal, sobrediagnosticadas por el observador inexperto.
ConclusionesLa TC lumbar permite valorar la mayoría de las variables con una sensibilidad y especificidad similar a la RM excepto en los cambios de la densidad del disco, la presencia de hernia y los cambios Modic tipo I y II. También estos datos se obtienen independientemente del grado de experiencia del radiólogo. Así, se concluye que la información que aporta cualquiera de las dos técnicas es igual de válida para el correcto manejo de los pacientes.
European guidelines define low back pain as ‘pain and discomfort’ localised below the costal margin and above the inferior gluteal folds, with or without leg pain.1
Low back pain is one of the most frequent reasons that patients are seen in both primary care and emergency departments. In fact, it is one of the four most frequent reasons patients aged between 18 and 65 attend emergency departments2; it is often reported as an occupational injury.3
It is important to differentiate between two clinical situations: acute low back pain (duration < six weeks) and chronic low back pain (duration > six weeks). This is because most episodes of low back pain are self-limiting and do not require imaging tests, as a thorough clinical examination and history taking are sufficient.4,5
Thus, the American College of Radiology (ACR), the American Association of Family Physicians, the North American Spine Society and the European guidelines for the management of low back pain advise that imaging studies should only be performed when symptoms persist or progress beyond six weeks (i.e. the pain is chronic) or when there are red flags suggesting the presence of a tumour, infection, fracture, cauda equina syndrome or acute aortic syndrome.1,6–8 However, only a very small percentage of imaging requests are related to conditions that meet the red flag criteria.
Despite the fact that most episodes of low back pain can be diagnosed clinically and are self-limiting, there has been an exponential growth in the use of imaging tests for its diagnosis in recent decades.3
This increase in requests for imaging tests has overburdened radiology services, generating considerable waiting lists and administrative pressures. It has also led to a significant increase in healthcare spending.3
If the test is indicated according to the latest guidelines for the management of non-specific chronic low back pain,9,10 magnetic resonance imaging (MRI) is the gold standard for assessing the lumbar spine of patients with refractory low back pain who have been managed conservatively for more than six weeks. This means that lumbar MRIs take up a significant percentage of medical attention and drain a lot of resources.11,12 In most cases, computed tomography (CT) is not considered, since while it may be faster and more efficient, it has poorer tissue and contrast resolution and involves radiation.
Our hypothesis is that lumbar spine CT provides similar information to MRI for patients with chronic low back pain in the absence of traumatic, infectious or neoplastic history. Therefore, the aim of this study is to assess the diagnostic accuracy of lumbar CT compared with lumbar MRI.
Material and methodsType of study and subjectsThis is an observational and retrospective study covering the period between January 2015 and December 2020.
The study included 68 adult patients with chronic low back pain who had undergone both a lumbar MRI and lumbar CT within a twelve-month period. Each patient was assessed at each of the five lumbar levels (L1-L2, L2-L3, L3-L4, L4-L5 and L5-S1).
The inclusion criteria were:
- -
Adult patients (>18 years of age).
- -
With chronic low back pain (>6 weeks since onset).
- -
Have undergone a CT and MRI of the lumbar spine within a maximum interval of one year; both tests being of optimal technical quality and acquisition.
- -
CT scans should show coronal and sagittal reconstructions.
The exclusion criteria were:
- -
Patients < 18 years of age.
- -
Presence of a primary or metastatic tumour.
- -
Suspicion of infectious aetiology.
- -
Trauma prior to the onset of symptoms.
- -
History of lumbosacral spine surgery.
A number of variables were analysed independently and randomly in the CT and MRI scans with the MRI being considered the reference standard. First, all the MRI scans were reviewed, and then the CT scans were reviewed in a second stage. In addition, each of the studies was independently reviewed by two radiologists with different levels of expertise: one with more than 25 years’ experience (expert observer), and the other with one year of experience (inexperienced observer).
Study variablesDemographic and radiological variables were analysed for each patient. The variables were agreed by two traumatologists (with more than 20 years’ experience in lumbar spine pathology) and the two radiologists who participated in the study.
The socio-demographic variables of the patients included gender, age and reason for the imaging test (low back pain).
In addition, the following variables were independently analysed at each of the five lumbar levels on both the CT and MRI scans (from L1-L2 to L5-S1):
- -
Lumbosacral transitional vertibrae: presence of lumbarisation of S1, sacralisation of L5, or absence.
- -
Alterations in alignment of the vertebral bodies in the sagittal plane: presence of anterolisthesis, retrolisthesis, or no alteration in alignment.
- -
Spondylolysis: presence or absence of disruption of the pars interarticularis.
- -
Scoliosis: presence or absence.
- -
Vertebral body height: normal or decreased height.
- -
Modic changes in the vertebral endplates: in this case specifying both whether Modic changes are present or not and, where applicable, the type of change. Modic changes are defined as type I when they are oedematous (hypointense on T1-weighted (T1W) and hyperintense on T2-weighted (T2W) and STIR); type II if there are high levels of fat present (hyperintense on T1W and T2W, with signal drop on STIR sequence) and type III if they are sclerotic (hypointense on T1W, T2W and STIR). On CT, Modic type III changes could only be detected by increased bone density in the vertebral discs, due to the limitations of the diagnostic technique.
- -
Facet degenerative changes: presence or absence. This includes the presence of osteophytes, joint space narrowing, joint fluid, synovial hypertrophy, subchondral sclerosis, cyst formation or oedema. Thus, facet arthrosis is considered to be present when at least one of the above elements is present.
- -
Vertebral osteophytes: presence or absence.
- -
Intervertebral disc height: alteration is considered to be present when the intervertebral disc is more reduced than the other discs included in the study or if there is a complete collapse of the intersomatic space.
- -
Intervertebral disc density or signal: normal or altered. On CT, alteration is considered to be present if there is decreased attenuation. On MRI, alteration is considered to be present if there is hypointensity or heterogeneity on T2W and STIR.
- -
Vacuum phenomenon: presence or absence of intradiscal gas secondary to disc degeneration and nitrogen accumulation.
- -
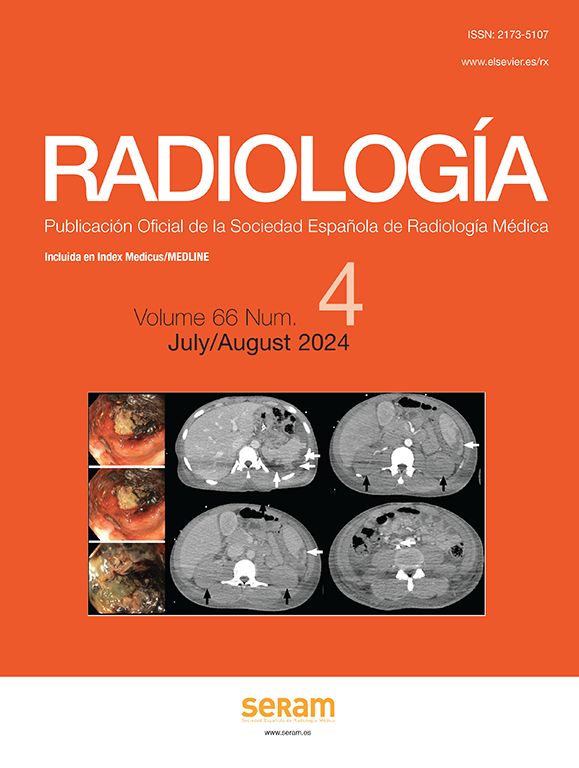
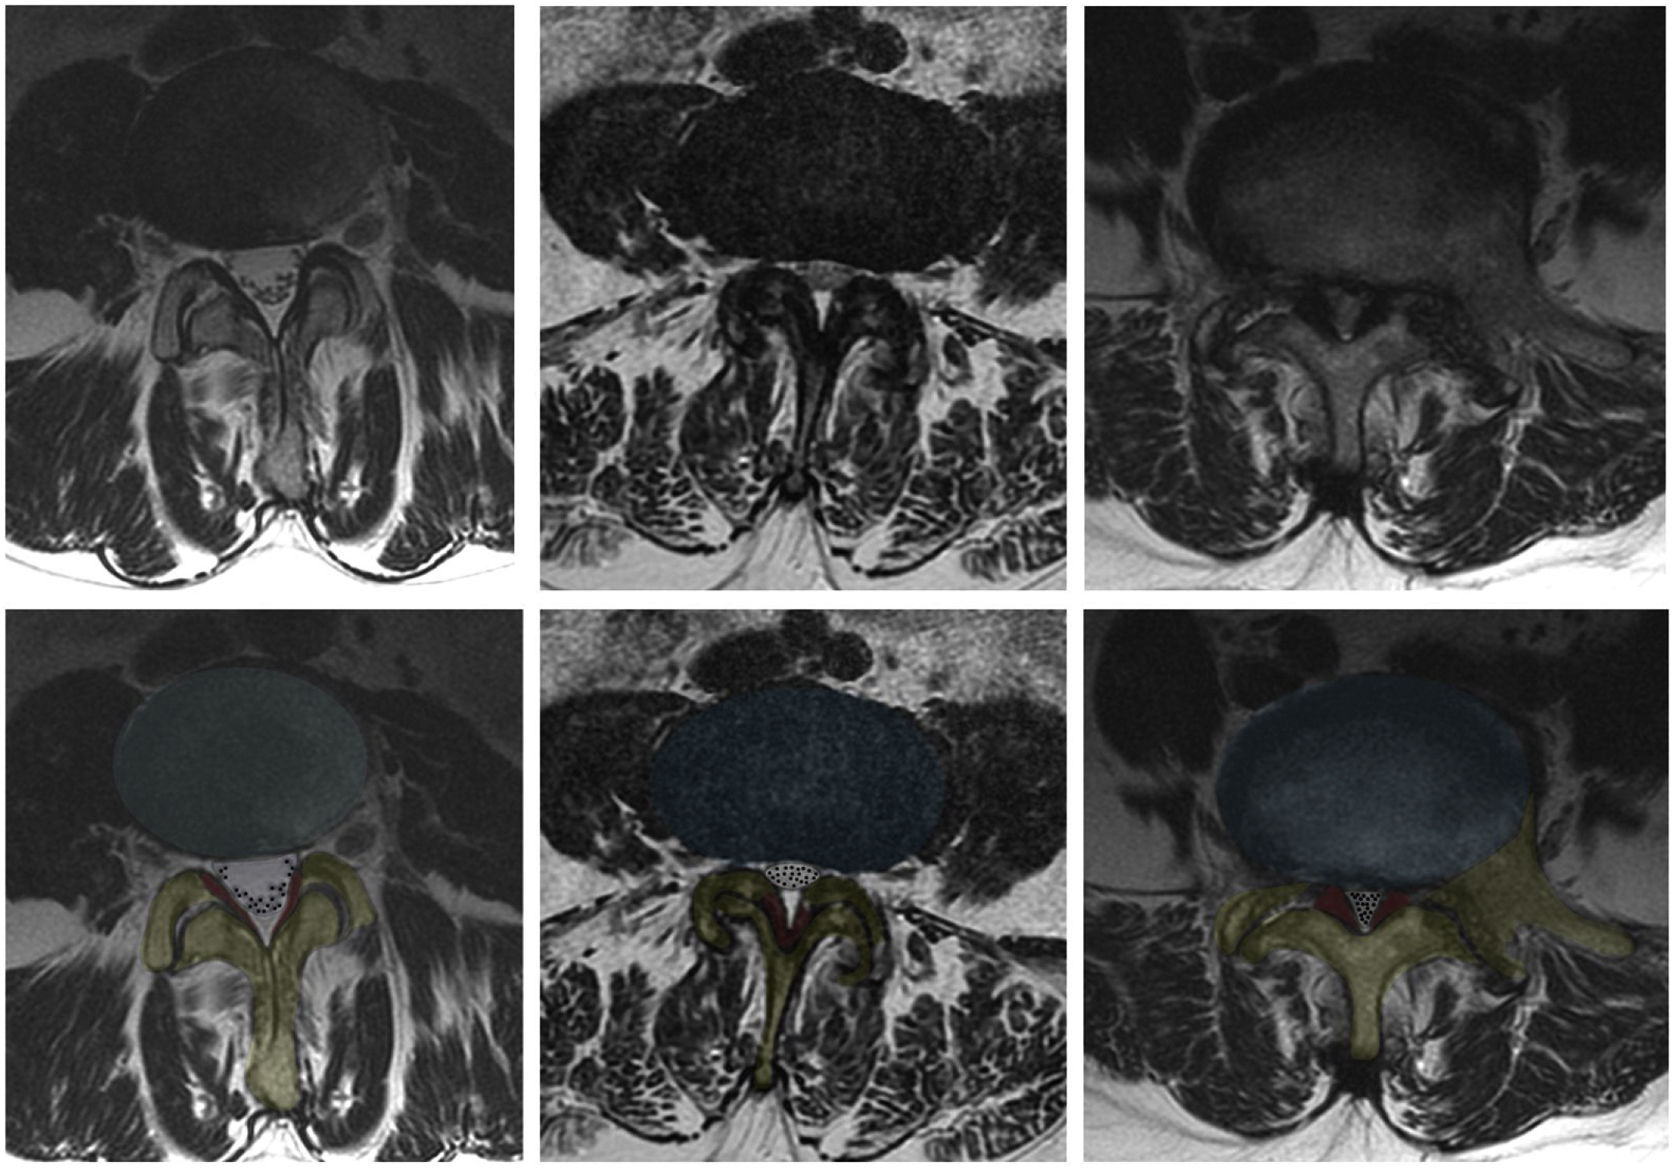
Disc bulging: presence or absence of disc bulging, defined as diffuse displacement of disc material beyond the limits of the disc space and involving more than 25% of the disc circumference (Fig. 1).
- -
Herniated disc: presence or absence of displacement of disc material beyond the limits of the disc space and involving less than 25% of the circumference (Fig. 1).
- -
Severe disc herniation: imaging criteria were applied and disc herniation was considered to be severe in cases where both disc herniation and nerve root involvement were observed.
- -
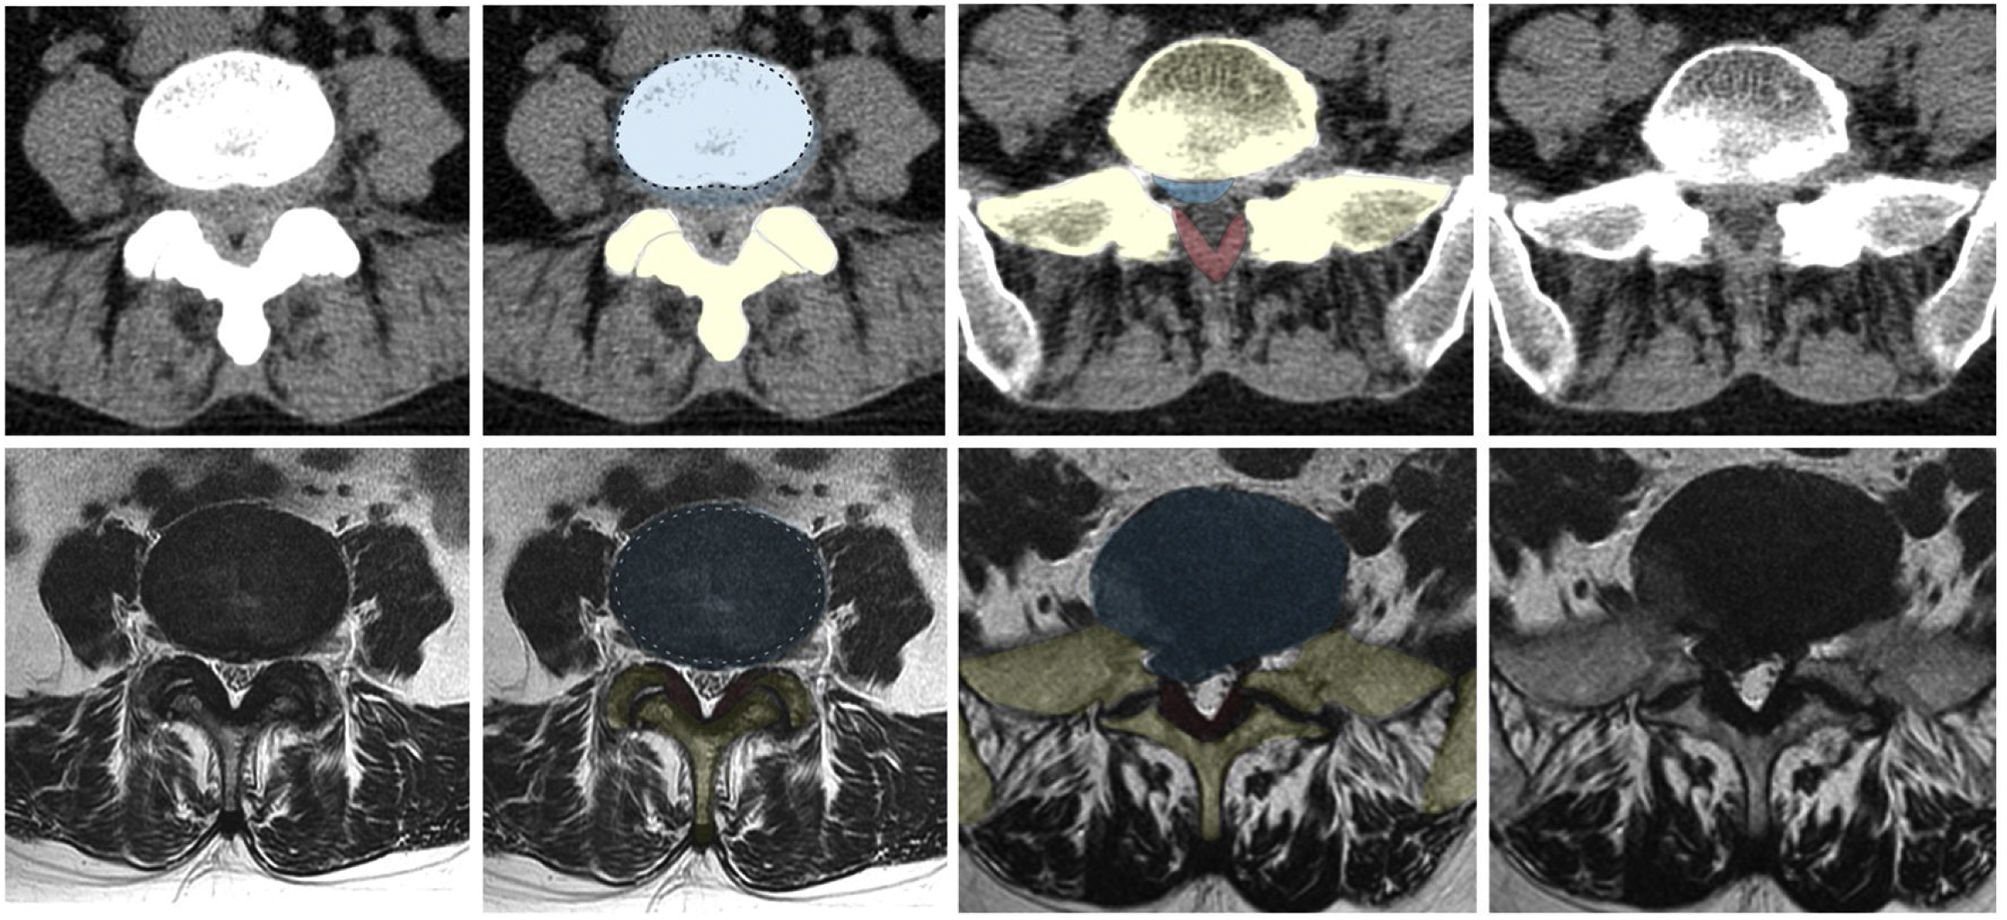
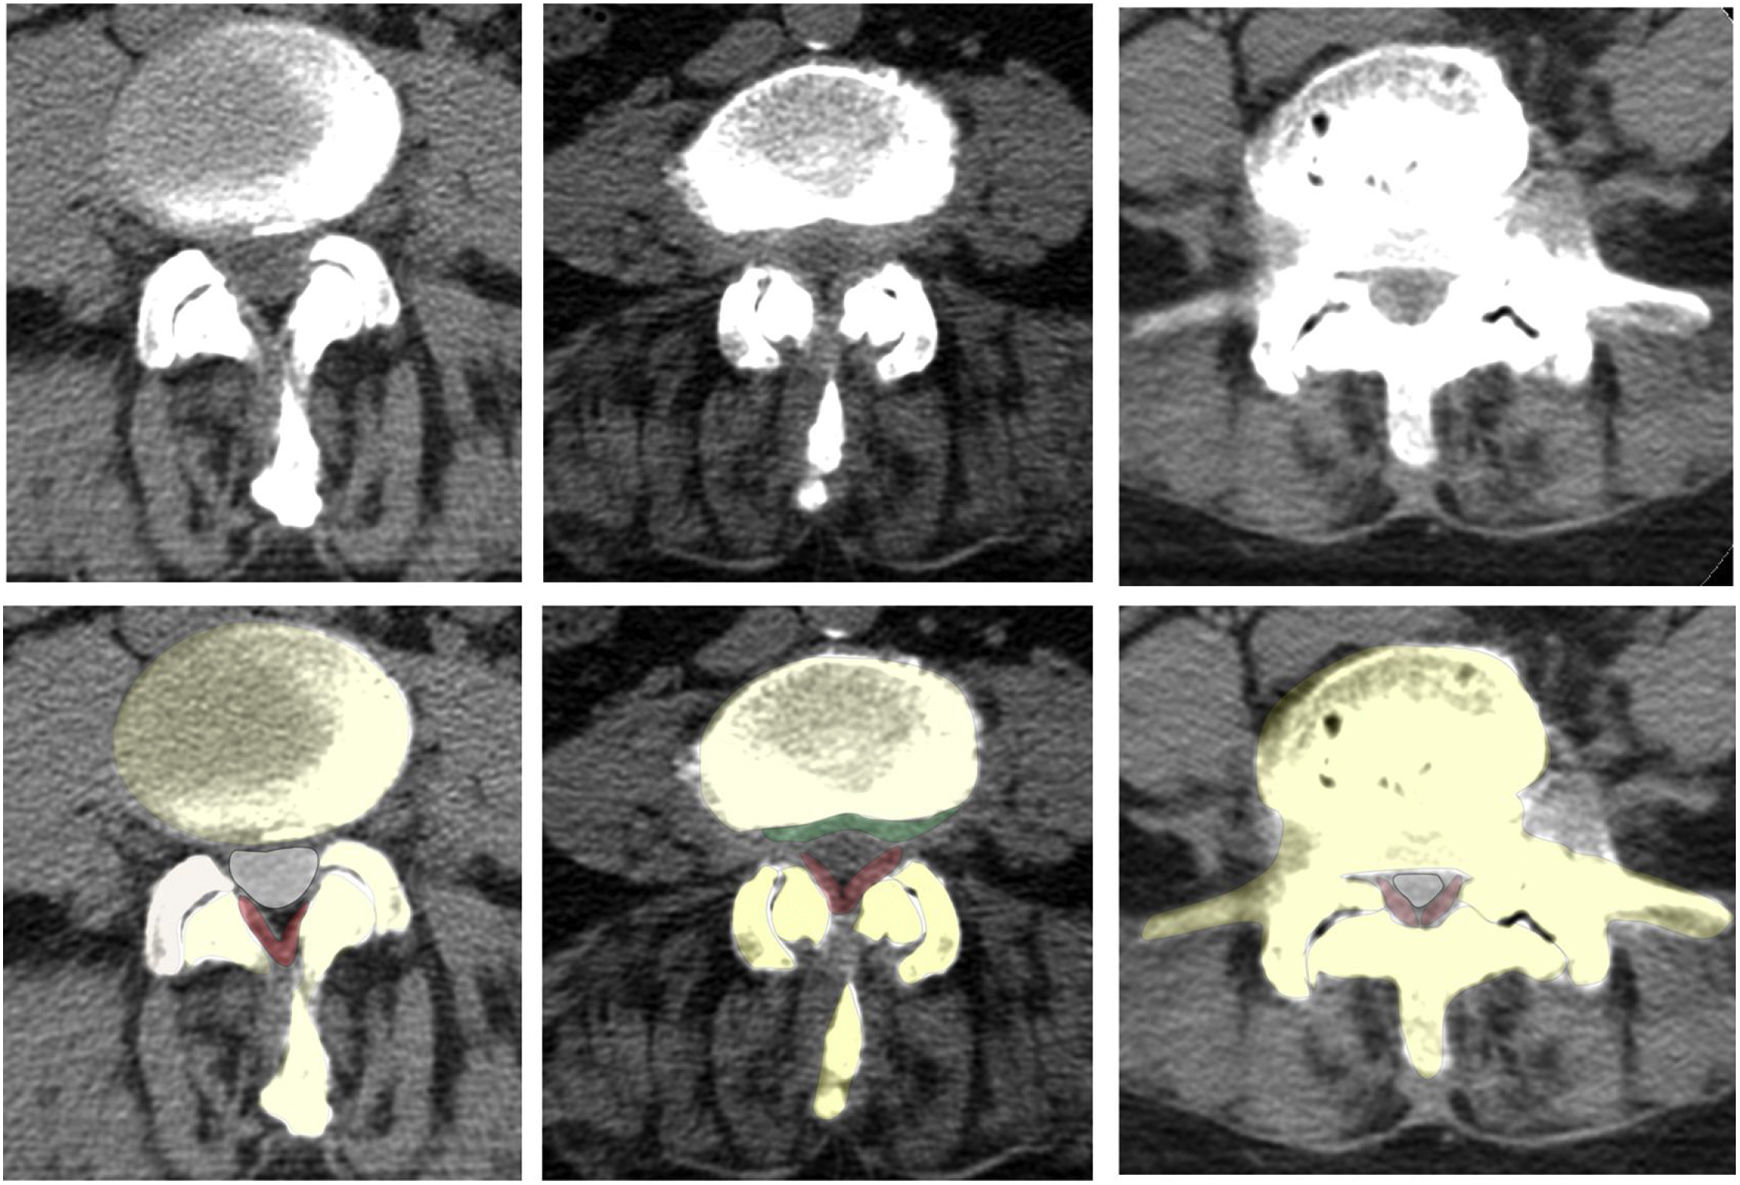
Foraminal stenosis: decreased total area of the foramina.13 Presence or absence (Figs. 2–3).
- -
Nerve root compromise: nerve root contact or compression.
- -
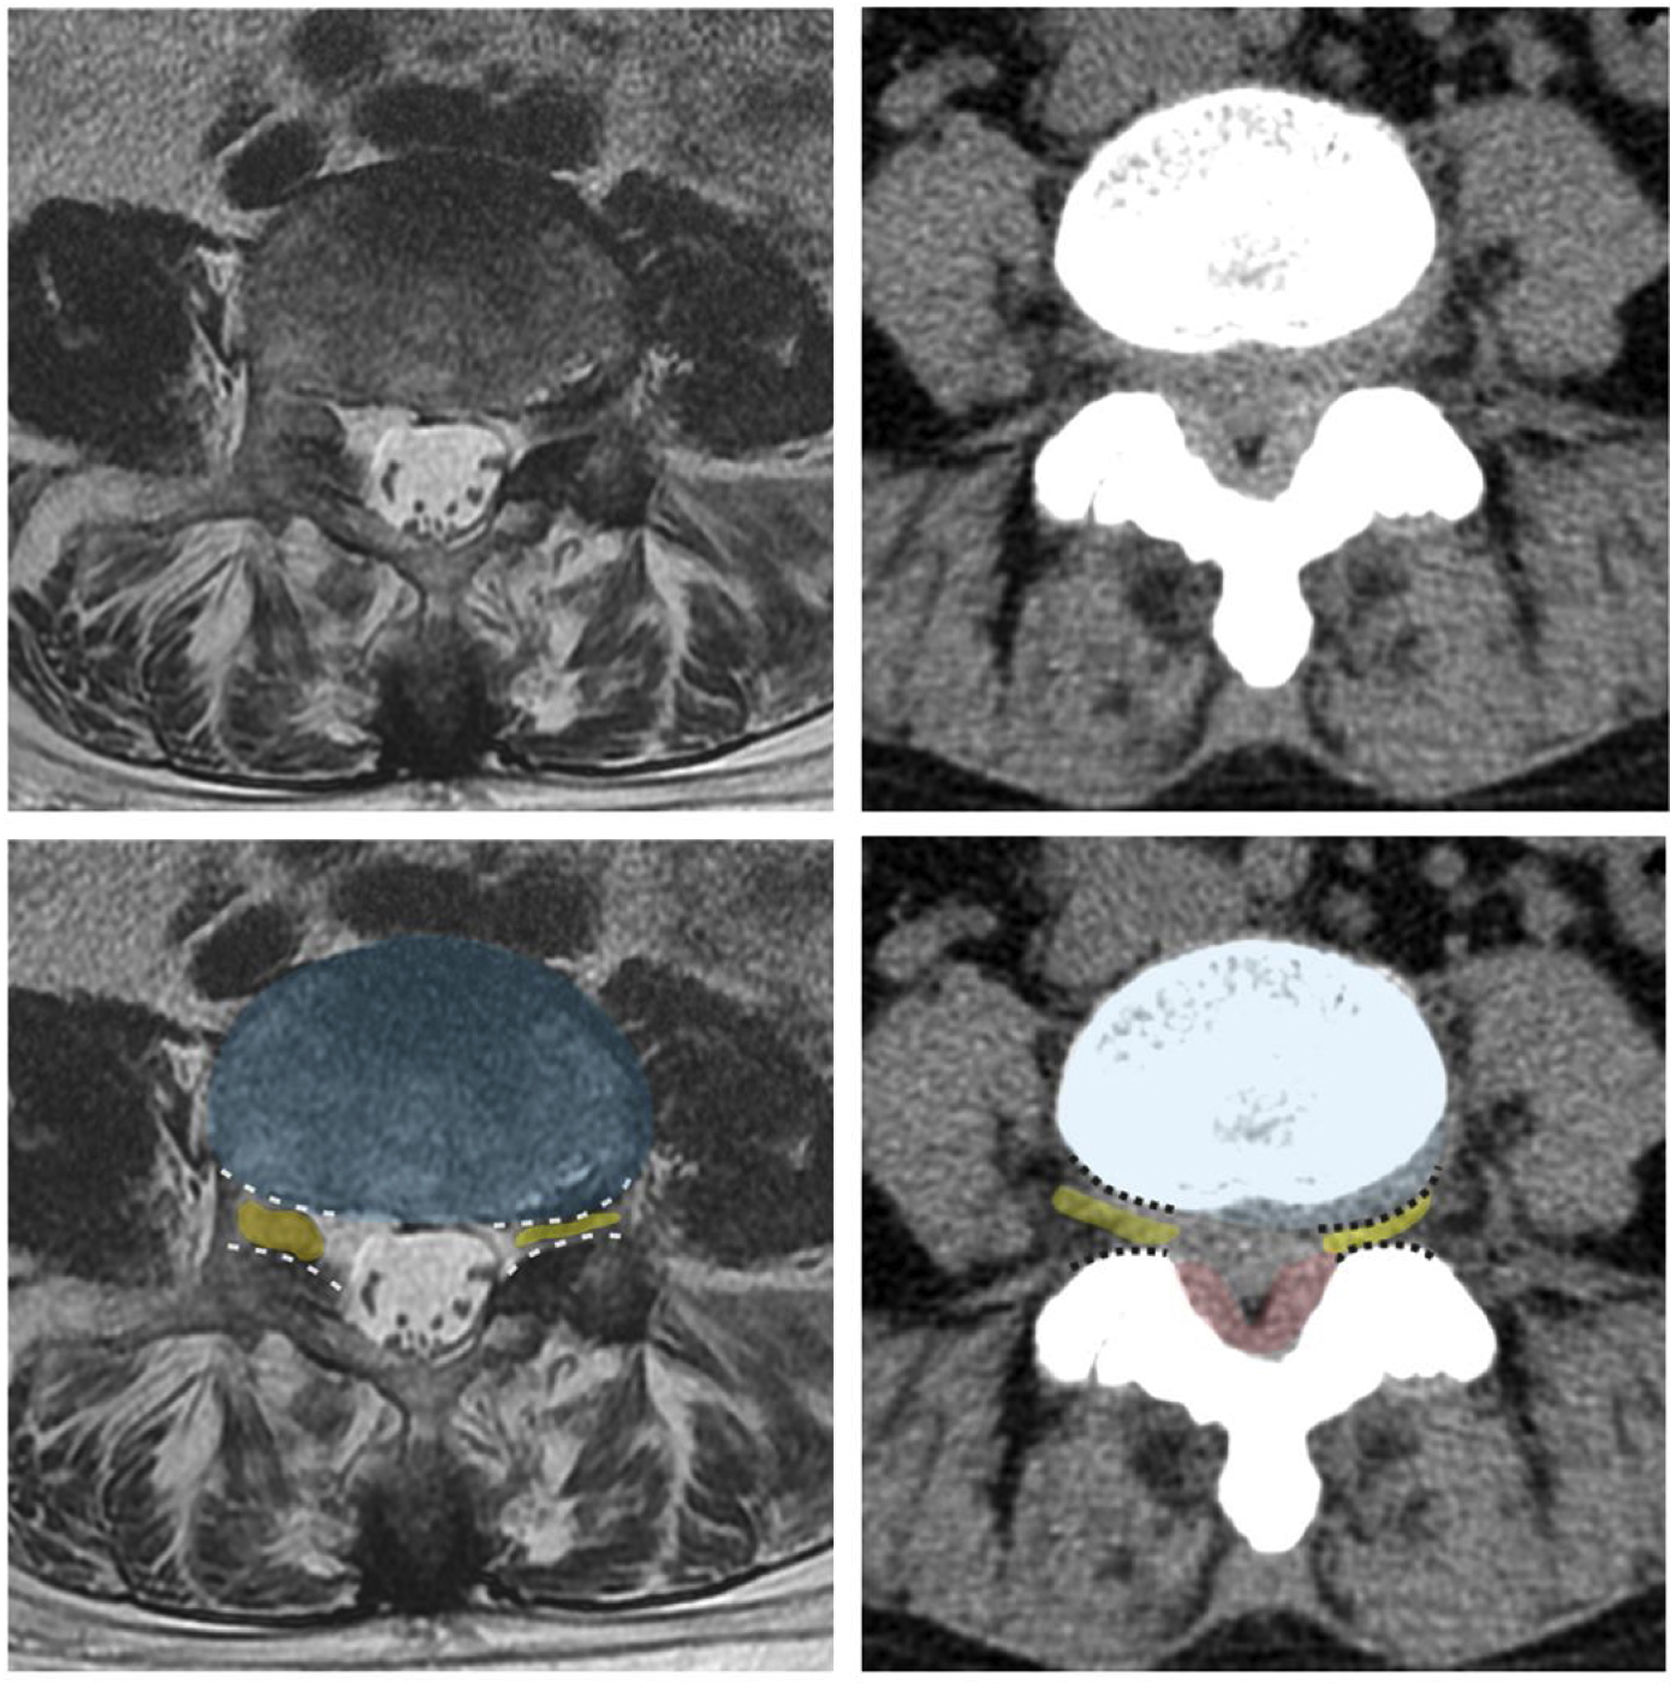
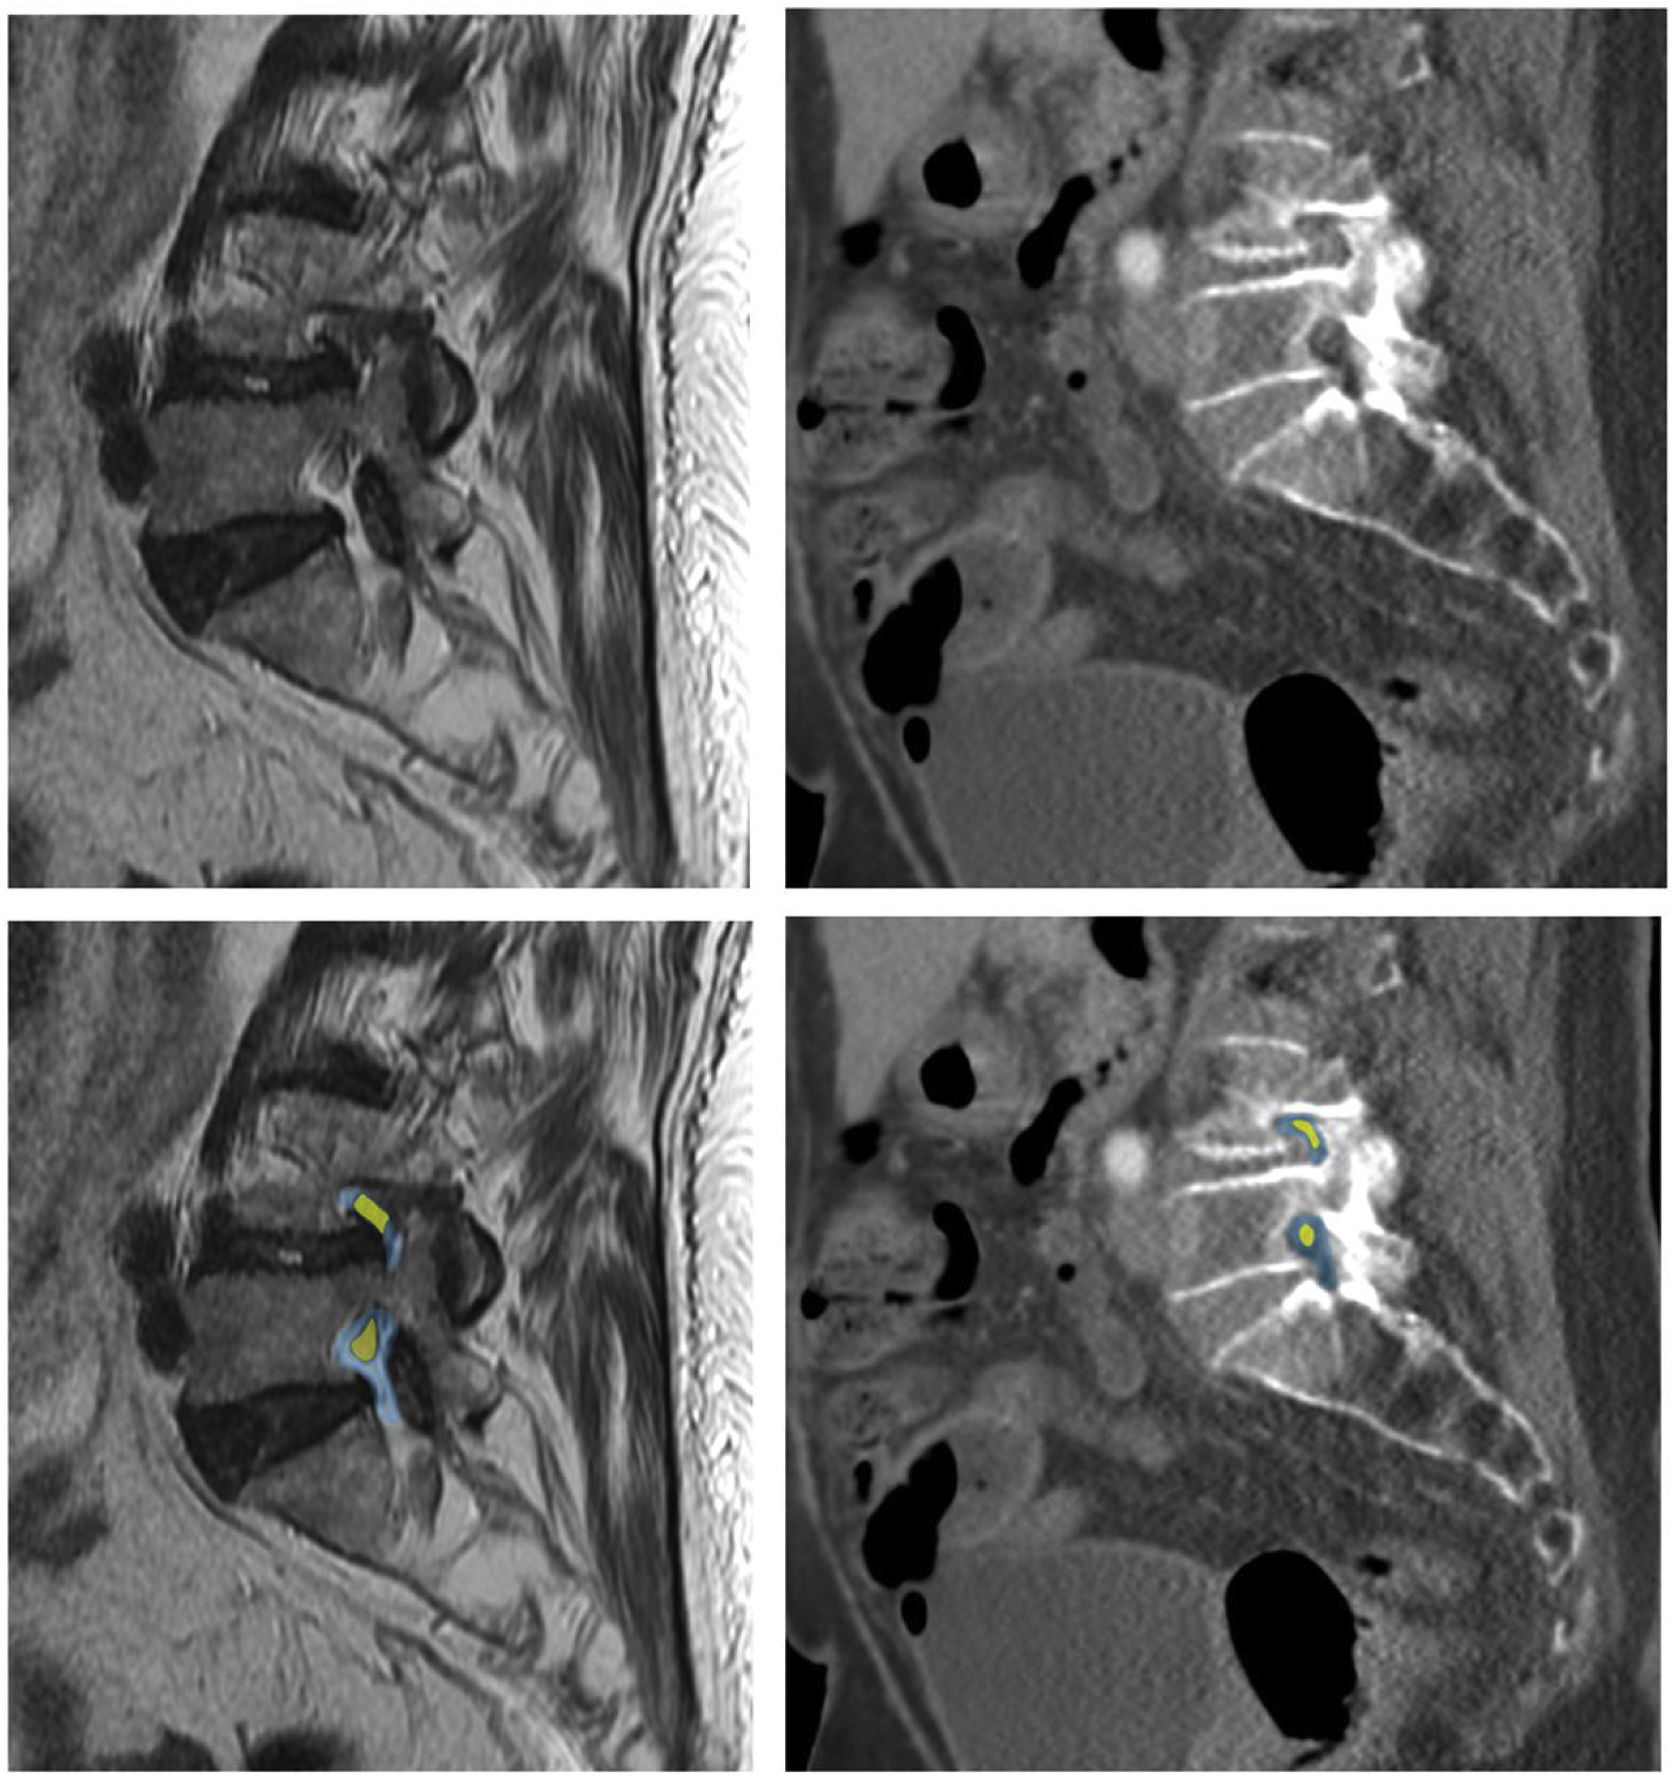
Lumbar canal stenosis: narrowing of the lumbar canal.13 Presence or absence (Figs. 4–5).
- -
Degree of lumbar canal stenosis: three grades of stenosis can be distinguished14,15 (Figs. 4–5):
- •
Mild: the anterior cerebrospinal fluid (CSF) space is mildly obliterated producing slight deformity to the dural sac margin but all cauda equina can be clearly separated from each other (Fig. 6).
- •
Moderate: dural sac margin deformed. Some of the cauda equina are aggregated in the dural sac but CSF remains between them.
- •
Severe: cauda equina appears as one bundle in the dural sac and no CSF is present between them.
- •
As cauda equina nerve root aggregation and the presence of CSF cannot be assessed by CT due to its poorer soft tissue resolution, central canal stenosis has been assessed in the axial plane as mild (obliteration < 1/3), moderate (2/3) or severe (>2/3) in order to assess if these CT findings correlate with the findings described above.
- •
. The two images on the right: right paracentral disc protrusion (above, CT image and below, axial T2W MRI).")


The MRI studies were performed using a 1.5-T MRI scanner (SIGNA Voyager model, General Electric Medical Systems, Milwaukee, USA). Imaging was performed without intravenous contrast and with the following sequences: T1W FSE (repetition time [RT] 700 ms and echo time [ET] 25 ms), T2W FSE (RT 2100 ms and ET 80 ms), STIR (RT 2100 ms, ET 65 ms and inversion time 140 ms) in the sagittal plane, and T2W FSE in the axial plane at the levels of interest.
The CT studies were performed with a scanner that generated 128 slices per rotation (Revolution Evo model, General Electric, Milwaukee, USA). The acquisition protocol consists of 1.25 mm thick slices in both soft tissue and bone windows without intravenous contrast. As this was a retrospective study, we only included patients for whom 2-mm-thick reformatting was also obtained in axial, coronal and sagittal planes at the time of acquisition.
Statistical analysisSPSS 17 (SPSS Inc., Chicago, USA) and STATA 17 (StataCorp LLC, Lakeway, USA) were used for statistical analysis. The distribution of qualitative variables is presented using absolute and relative frequencies and the quantitative variables using mean and standard deviation (SD).
To assess the validity of CT compared to MRI, sensitivity and specificity indices are estimated, accompanied by the corresponding 95% confidence interval (95% CI).
The degree of concordance between the findings using both techniques is also presented and assessed using the expert observer's Kappa index of concordance. To assess the degree of discrepancy, McNemar's test of asymmetry is calculated. Concordance is considered weak if the Kappa index value is lower than 0.4; moderate if it is between 0.4 and 0.6; good if it is between 0.6 and 0.8 and very good if higher than 0.8.
Intra-observer CT reliability is analysed by calculating the Kappa concordance coefficients of the two observations for each observer, and inter-observer reliability by calculating the Kappa concordance coefficients of the observations of the expert and of the inexperienced observer.
For hypothesis testing, a P-value of less than .05 is considered statistically significant.
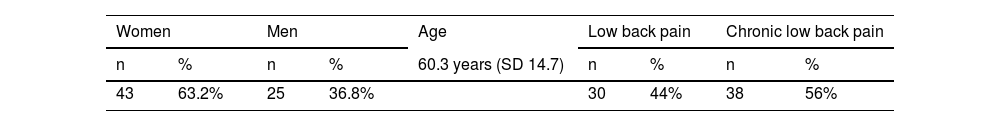
ResultsA total of 340 lumbar levels were evaluated, corresponding to the L1-L2 to L5-S1 spaces of 68 adult patients with low back pain (n = 30) or chronic low back pain (n = 38). 63.2% were female (n = 43) and the mean age was 60.3 years (SD 14.7). The results are shown in Table 1. No patients were excluded.
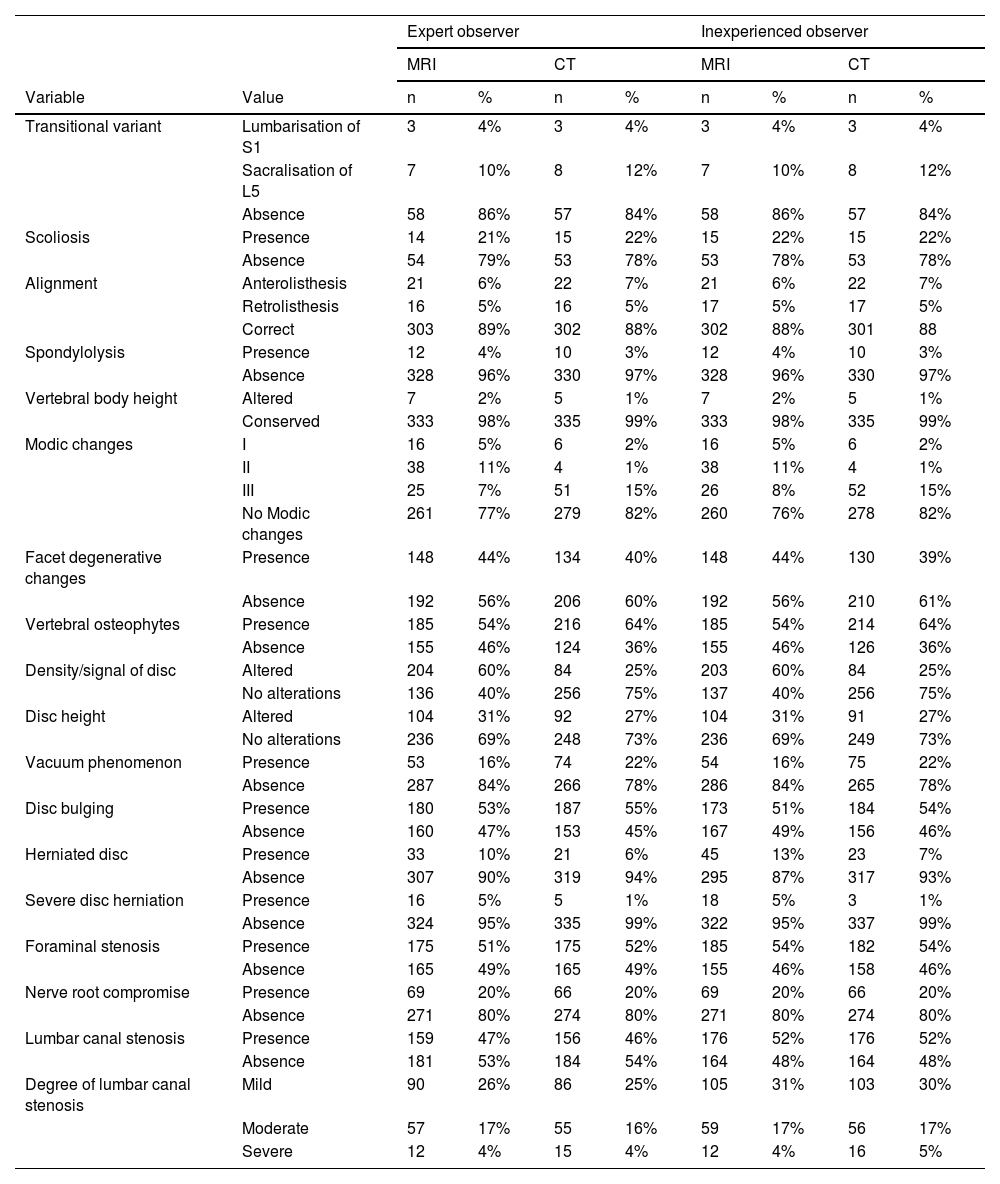
Table 2 shows that MRI is better at detecting severe disc herniation, as it identified the condition in 5% of the subjects compared to 1% with CT. However, CT detected more cases of vertebral osteophytes (64% compared to 54% with MRI), Modic type III changes (15% compared to 7% with MRI) and the disc vacuum phenomenon (22% compared to 16% with MRI). Regarding lumbar canal stenosis—one of the most commonly associated variables for chronic low back pain—the detection rate is similar for both techniques (47% for MRI vs. 46% for CT) and severe stenosis is equally detected by both techniques (4%). The most frequent alterations detected by MRI are disc signal, followed by the presence of osteophytes, disc bulging and foraminal stenosis, while CT detects osteophytes, followed by disc bulging and foraminal stenosis more frequently.
Description of findings according to technique and observer.
| Expert observer | Inexperienced observer | ||||||||
|---|---|---|---|---|---|---|---|---|---|
| MRI | CT | MRI | CT | ||||||
| Variable | Value | n | % | n | % | n | % | n | % |
| Transitional variant | Lumbarisation of S1 | 3 | 4% | 3 | 4% | 3 | 4% | 3 | 4% |
| Sacralisation of L5 | 7 | 10% | 8 | 12% | 7 | 10% | 8 | 12% | |
| Absence | 58 | 86% | 57 | 84% | 58 | 86% | 57 | 84% | |
| Scoliosis | Presence | 14 | 21% | 15 | 22% | 15 | 22% | 15 | 22% |
| Absence | 54 | 79% | 53 | 78% | 53 | 78% | 53 | 78% | |
| Alignment | Anterolisthesis | 21 | 6% | 22 | 7% | 21 | 6% | 22 | 7% |
| Retrolisthesis | 16 | 5% | 16 | 5% | 17 | 5% | 17 | 5% | |
| Correct | 303 | 89% | 302 | 88% | 302 | 88% | 301 | 88 | |
| Spondylolysis | Presence | 12 | 4% | 10 | 3% | 12 | 4% | 10 | 3% |
| Absence | 328 | 96% | 330 | 97% | 328 | 96% | 330 | 97% | |
| Vertebral body height | Altered | 7 | 2% | 5 | 1% | 7 | 2% | 5 | 1% |
| Conserved | 333 | 98% | 335 | 99% | 333 | 98% | 335 | 99% | |
| Modic changes | I | 16 | 5% | 6 | 2% | 16 | 5% | 6 | 2% |
| II | 38 | 11% | 4 | 1% | 38 | 11% | 4 | 1% | |
| III | 25 | 7% | 51 | 15% | 26 | 8% | 52 | 15% | |
| No Modic changes | 261 | 77% | 279 | 82% | 260 | 76% | 278 | 82% | |
| Facet degenerative changes | Presence | 148 | 44% | 134 | 40% | 148 | 44% | 130 | 39% |
| Absence | 192 | 56% | 206 | 60% | 192 | 56% | 210 | 61% | |
| Vertebral osteophytes | Presence | 185 | 54% | 216 | 64% | 185 | 54% | 214 | 64% |
| Absence | 155 | 46% | 124 | 36% | 155 | 46% | 126 | 36% | |
| Density/signal of disc | Altered | 204 | 60% | 84 | 25% | 203 | 60% | 84 | 25% |
| No alterations | 136 | 40% | 256 | 75% | 137 | 40% | 256 | 75% | |
| Disc height | Altered | 104 | 31% | 92 | 27% | 104 | 31% | 91 | 27% |
| No alterations | 236 | 69% | 248 | 73% | 236 | 69% | 249 | 73% | |
| Vacuum phenomenon | Presence | 53 | 16% | 74 | 22% | 54 | 16% | 75 | 22% |
| Absence | 287 | 84% | 266 | 78% | 286 | 84% | 265 | 78% | |
| Disc bulging | Presence | 180 | 53% | 187 | 55% | 173 | 51% | 184 | 54% |
| Absence | 160 | 47% | 153 | 45% | 167 | 49% | 156 | 46% | |
| Herniated disc | Presence | 33 | 10% | 21 | 6% | 45 | 13% | 23 | 7% |
| Absence | 307 | 90% | 319 | 94% | 295 | 87% | 317 | 93% | |
| Severe disc herniation | Presence | 16 | 5% | 5 | 1% | 18 | 5% | 3 | 1% |
| Absence | 324 | 95% | 335 | 99% | 322 | 95% | 337 | 99% | |
| Foraminal stenosis | Presence | 175 | 51% | 175 | 52% | 185 | 54% | 182 | 54% |
| Absence | 165 | 49% | 165 | 49% | 155 | 46% | 158 | 46% | |
| Nerve root compromise | Presence | 69 | 20% | 66 | 20% | 69 | 20% | 66 | 20% |
| Absence | 271 | 80% | 274 | 80% | 271 | 80% | 274 | 80% | |
| Lumbar canal stenosis | Presence | 159 | 47% | 156 | 46% | 176 | 52% | 176 | 52% |
| Absence | 181 | 53% | 184 | 54% | 164 | 48% | 164 | 48% | |
| Degree of lumbar canal stenosis | Mild | 90 | 26% | 86 | 25% | 105 | 31% | 103 | 30% |
| Moderate | 57 | 17% | 55 | 16% | 59 | 17% | 56 | 17% | |
| Severe | 12 | 4% | 15 | 4% | 12 | 4% | 16 | 5% | |
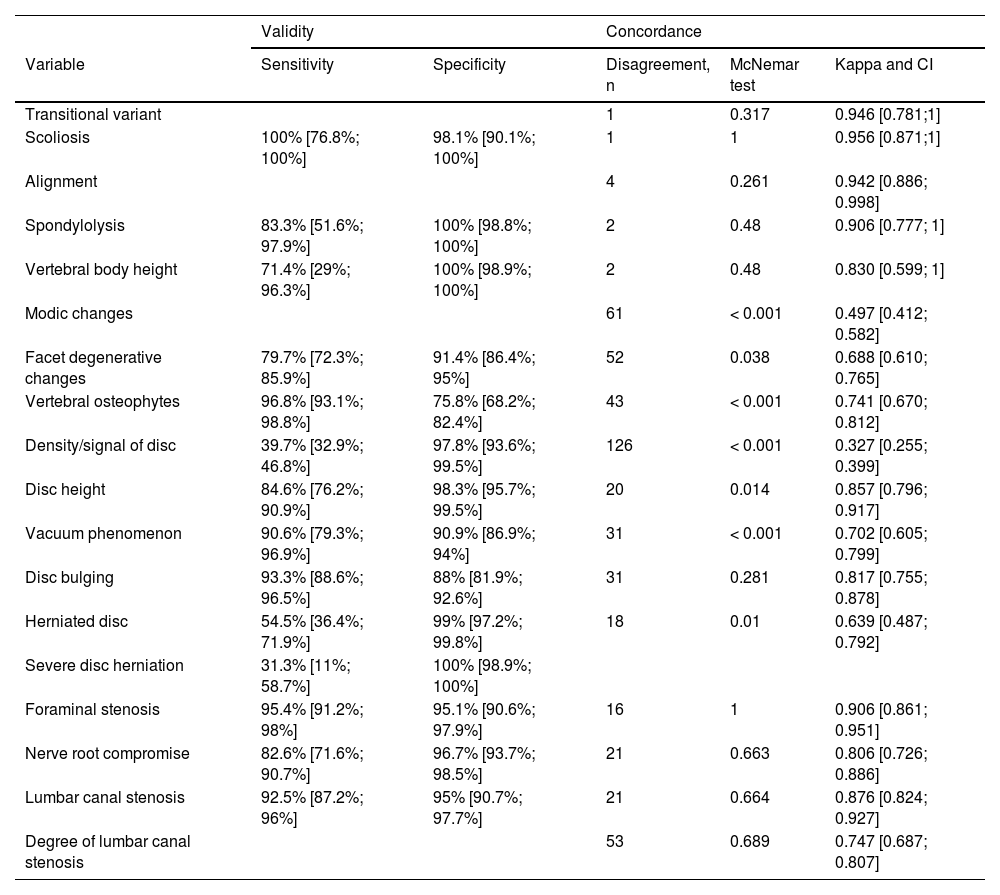
As can be seen from the CT validity results shown in Table 3, specificity values are high for all variables, though sensitivity is very low for disc signal (40%) and herniation diagnosis (55%). These results are similar when the assessments of the inexperienced observer are analysed.
Validity of CT compared with MRI and concordance between techniques (expert observer evaluations).
| Validity | Concordance | ||||
|---|---|---|---|---|---|
| Variable | Sensitivity | Specificity | Disagreement, n | McNemar test | Kappa and CI |
| Transitional variant | 1 | 0.317 | 0.946 [0.781;1] | ||
| Scoliosis | 100% [76.8%; 100%] | 98.1% [90.1%; 100%] | 1 | 1 | 0.956 [0.871;1] |
| Alignment | 4 | 0.261 | 0.942 [0.886; 0.998] | ||
| Spondylolysis | 83.3% [51.6%; 97.9%] | 100% [98.8%; 100%] | 2 | 0.48 | 0.906 [0.777; 1] |
| Vertebral body height | 71.4% [29%; 96.3%] | 100% [98.9%; 100%] | 2 | 0.48 | 0.830 [0.599; 1] |
| Modic changes | 61 | < 0.001 | 0.497 [0.412; 0.582] | ||
| Facet degenerative changes | 79.7% [72.3%; 85.9%] | 91.4% [86.4%; 95%] | 52 | 0.038 | 0.688 [0.610; 0.765] |
| Vertebral osteophytes | 96.8% [93.1%; 98.8%] | 75.8% [68.2%; 82.4%] | 43 | < 0.001 | 0.741 [0.670; 0.812] |
| Density/signal of disc | 39.7% [32.9%; 46.8%] | 97.8% [93.6%; 99.5%] | 126 | < 0.001 | 0.327 [0.255; 0.399] |
| Disc height | 84.6% [76.2%; 90.9%] | 98.3% [95.7%; 99.5%] | 20 | 0.014 | 0.857 [0.796; 0.917] |
| Vacuum phenomenon | 90.6% [79.3%; 96.9%] | 90.9% [86.9%; 94%] | 31 | < 0.001 | 0.702 [0.605; 0.799] |
| Disc bulging | 93.3% [88.6%; 96.5%] | 88% [81.9%; 92.6%] | 31 | 0.281 | 0.817 [0.755; 0.878] |
| Herniated disc | 54.5% [36.4%; 71.9%] | 99% [97.2%; 99.8%] | 18 | 0.01 | 0.639 [0.487; 0.792] |
| Severe disc herniation | 31.3% [11%; 58.7%] | 100% [98.9%; 100%] | |||
| Foraminal stenosis | 95.4% [91.2%; 98%] | 95.1% [90.6%; 97.9%] | 16 | 1 | 0.906 [0.861; 0.951] |
| Nerve root compromise | 82.6% [71.6%; 90.7%] | 96.7% [93.7%; 98.5%] | 21 | 0.663 | 0.806 [0.726; 0.886] |
| Lumbar canal stenosis | 92.5% [87.2%; 96%] | 95% [90.7%; 97.7%] | 21 | 0.664 | 0.876 [0.824; 0.927] |
| Degree of lumbar canal stenosis | 53 | 0.689 | 0.747 [0.687; 0.807] | ||
CI: confidence interval.
The expert observer ratings in Table 4 show that the concordance between the two techniques is generally good (kappa > 0.7), except for Modic changes (kappa = 0.497), degenerative changes (kappa = 0.688), disc signal (kappa = 0.327) and disc herniation (kappa = 0.639). Furthermore, the discrepancies in all of these are asymmetric (test for asymmetry < 0.05). This would explain the discordance of results between the two techniques in the variables for Modic and degenerative changes, disc signal and disc herniation, which are more frequently detected by MRI than by CT, which underestimates them.
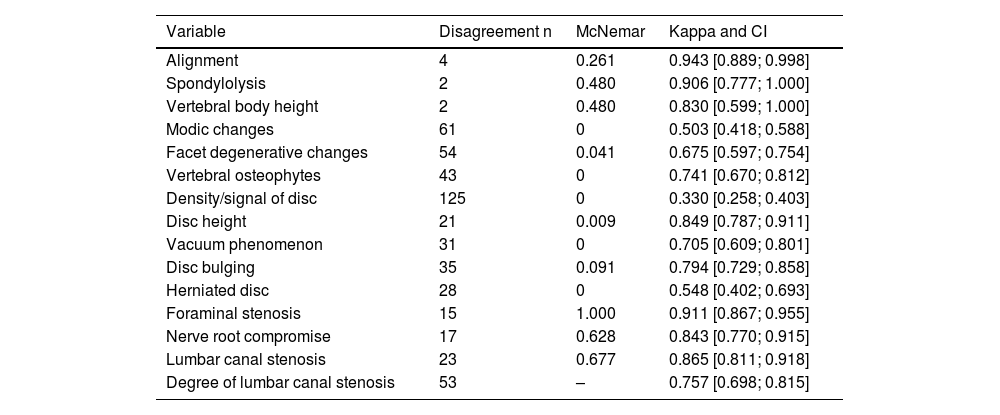
Concordance between techniques (inexperienced expert observations).
| Variable | Disagreement n | McNemar | Kappa and CI |
|---|---|---|---|
| Alignment | 4 | 0.261 | 0.943 [0.889; 0.998] |
| Spondylolysis | 2 | 0.480 | 0.906 [0.777; 1.000] |
| Vertebral body height | 2 | 0.480 | 0.830 [0.599; 1.000] |
| Modic changes | 61 | 0 | 0.503 [0.418; 0.588] |
| Facet degenerative changes | 54 | 0.041 | 0.675 [0.597; 0.754] |
| Vertebral osteophytes | 43 | 0 | 0.741 [0.670; 0.812] |
| Density/signal of disc | 125 | 0 | 0.330 [0.258; 0.403] |
| Disc height | 21 | 0.009 | 0.849 [0.787; 0.911] |
| Vacuum phenomenon | 31 | 0 | 0.705 [0.609; 0.801] |
| Disc bulging | 35 | 0.091 | 0.794 [0.729; 0.858] |
| Herniated disc | 28 | 0 | 0.548 [0.402; 0.693] |
| Foraminal stenosis | 15 | 1.000 | 0.911 [0.867; 0.955] |
| Nerve root compromise | 17 | 0.628 | 0.843 [0.770; 0.915] |
| Lumbar canal stenosis | 23 | 0.677 | 0.865 [0.811; 0.918] |
| Degree of lumbar canal stenosis | 53 | – | 0.757 [0.698; 0.815] |
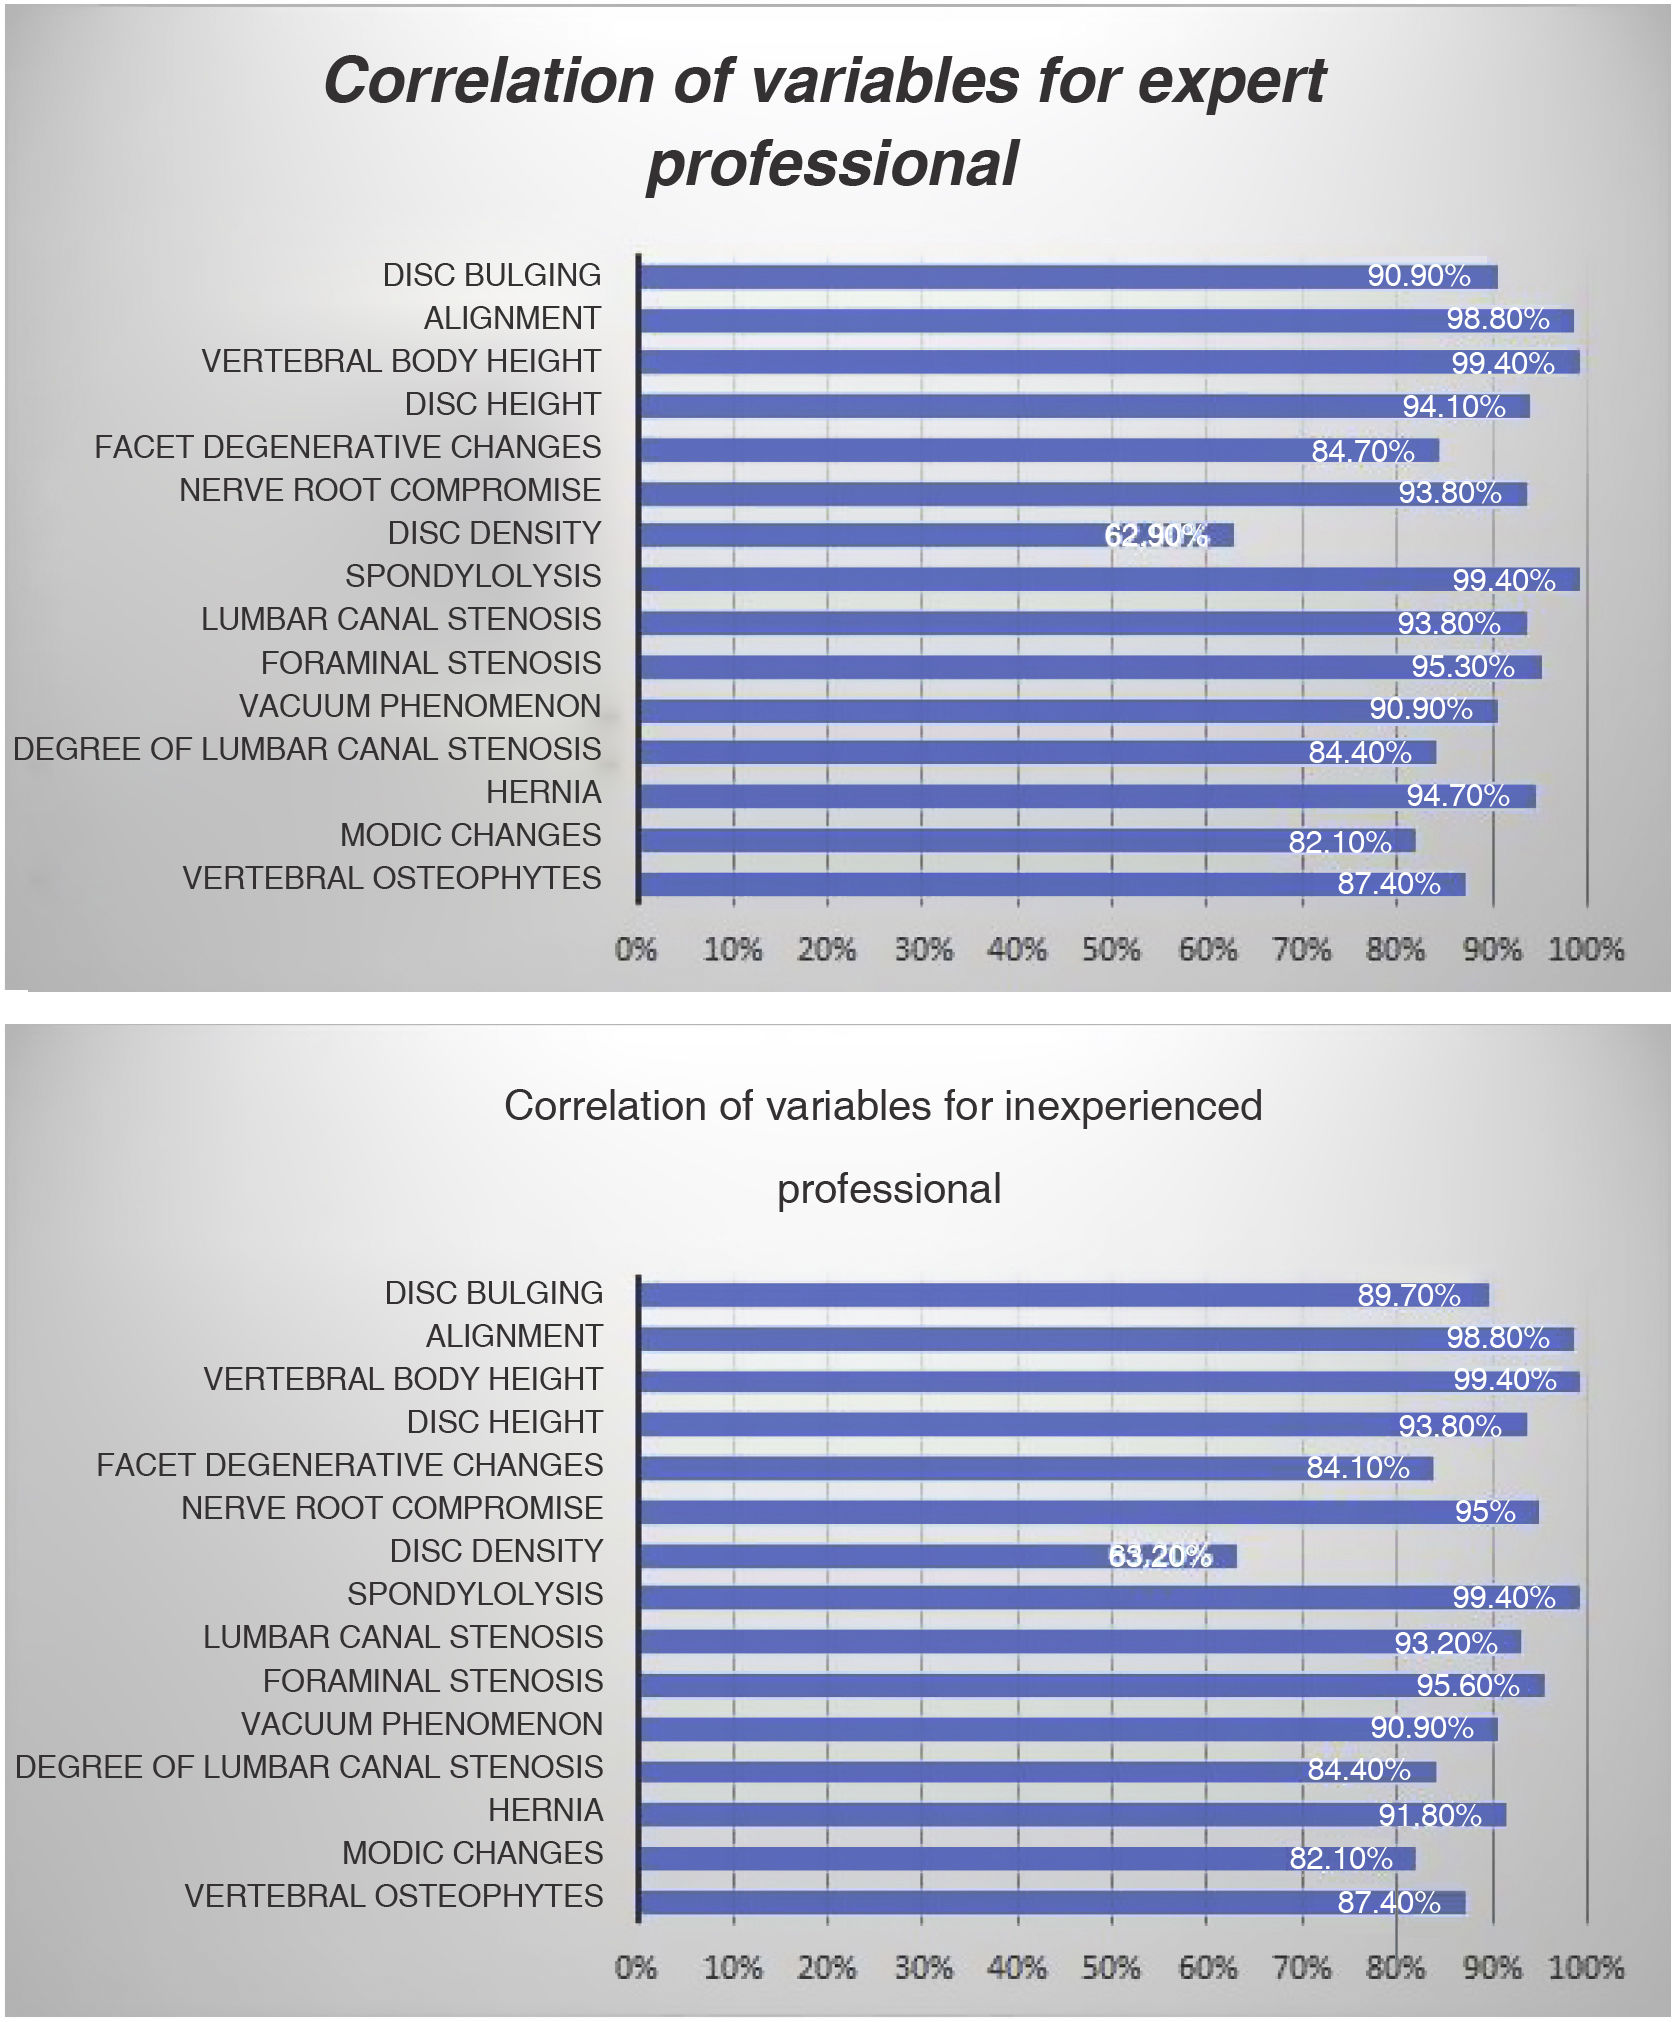
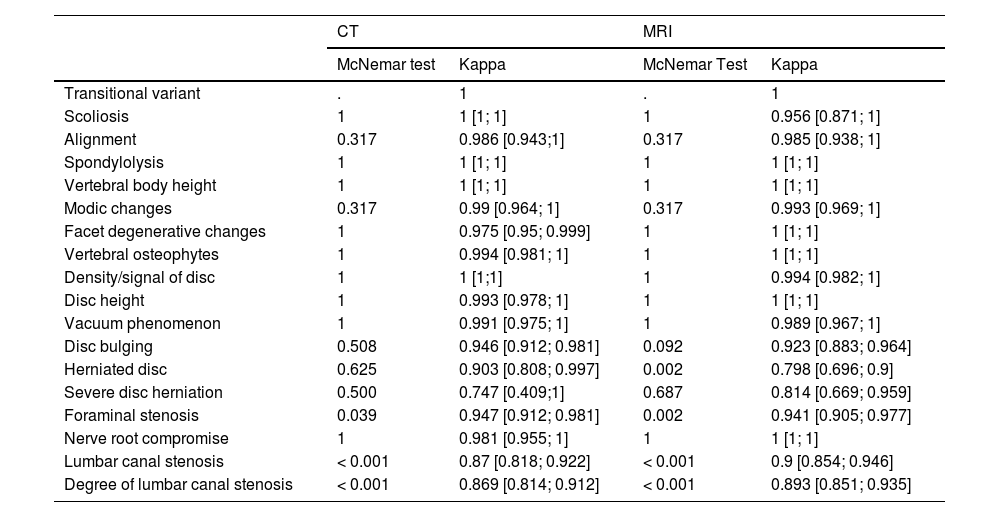
For its part, the inter-observer agreement shown in Table 5 is generally high, with kappa > 0.8. With CT, asymmetric discrepancies occur in the assessment of foraminal stenosis, lumbar canal stenosis and the degree of lumbar canal stenosis, which were overdiagnosed by the inexperienced observer.
Inter-observer agreement for each technique.
| CT | MRI | |||
|---|---|---|---|---|
| McNemar test | Kappa | McNemar Test | Kappa | |
| Transitional variant | . | 1 | . | 1 |
| Scoliosis | 1 | 1 [1; 1] | 1 | 0.956 [0.871; 1] |
| Alignment | 0.317 | 0.986 [0.943;1] | 0.317 | 0.985 [0.938; 1] |
| Spondylolysis | 1 | 1 [1; 1] | 1 | 1 [1; 1] |
| Vertebral body height | 1 | 1 [1; 1] | 1 | 1 [1; 1] |
| Modic changes | 0.317 | 0.99 [0.964; 1] | 0.317 | 0.993 [0.969; 1] |
| Facet degenerative changes | 1 | 0.975 [0.95; 0.999] | 1 | 1 [1; 1] |
| Vertebral osteophytes | 1 | 0.994 [0.981; 1] | 1 | 1 [1; 1] |
| Density/signal of disc | 1 | 1 [1;1] | 1 | 0.994 [0.982; 1] |
| Disc height | 1 | 0.993 [0.978; 1] | 1 | 1 [1; 1] |
| Vacuum phenomenon | 1 | 0.991 [0.975; 1] | 1 | 0.989 [0.967; 1] |
| Disc bulging | 0.508 | 0.946 [0.912; 0.981] | 0.092 | 0.923 [0.883; 0.964] |
| Herniated disc | 0.625 | 0.903 [0.808; 0.997] | 0.002 | 0.798 [0.696; 0.9] |
| Severe disc herniation | 0.500 | 0.747 [0.409;1] | 0.687 | 0.814 [0.669; 0.959] |
| Foraminal stenosis | 0.039 | 0.947 [0.912; 0.981] | 0.002 | 0.941 [0.905; 0.977] |
| Nerve root compromise | 1 | 0.981 [0.955; 1] | 1 | 1 [1; 1] |
| Lumbar canal stenosis | < 0.001 | 0.87 [0.818; 0.922] | < 0.001 | 0.9 [0.854; 0.946] |
| Degree of lumbar canal stenosis | < 0.001 | 0.869 [0.814; 0.912] | < 0.001 | 0.893 [0.851; 0.935] |
In cases where imaging is indicated, this study has shown that lumbar CT demonstrates good levels of validity and concordance compared with MRI in the analysis of most of the variables studied. MRI should however be used to assess certain variables which are underdiagnosed with CT due to its lower sensitivity, including disc density, the presence of herniation and Modic changes types I and II; although specificity in these cases is high.
Furthermore, most of these results are reproducible regardless of the radiologist's level of experience. This study found that the inexperienced observer only overdiagnosed foraminal stenosis, lumbar canal stenosis and the degree of lumbar canal stenosis.
The correlation between alterations in imaging and clinical findings is controversial. There is an overlap between incidental findings of age-related degenerative changes and findings that are clinically causative.16
However, when symptoms and surgical indications are both present, certain imaging findings for the variables studied are of greater significance, namely: disc bulges or herniated discs, neural compressions, lumbar canal and foraminal stenosis and oedematous changes.17–20 Of these, lumbar canal stenosis is the leading reason for lumbar surgery in people aged over 65.18–21 This study has shown that CT is as valid as MRI for the assessment of these variables. Other studies, including that of Eun et al.22 also concluded that CT and MRI are equally valid for identifying lumbar canal stenosis. Furthermore, both this study and that of Oei et al.17 stress that CT is superior at differentiating yellow ligament thickening from cortical bone in the posterior region of the spine evaluated in the axial plane, serving as additional information for minimally invasive surgeries.
Oedematous changes in the vertebral endplates (Modic type I changes) also tend to produce symptoms. This is one of the variables that cannot be analysed by CT. However, a number of articles have evaluated the usefulness of dual-energy CT to compensate for this lack of information in terms of assessing the presence of bone marrow oedema in the lumbar spine. Shinohara et al.23 compared the validity of calcium-free dual-energy CT virtual imaging versus MRI for assessing degenerative disc changes and found a positive correlation, demonstrating that this could be a valid alternative assessment method. Future research could explore the use of spectral CT in other pathological cases with inflammatory or infectious aetiology, post-traumatic bone marrow oedema24 or other variables for which this study has demonstrated that MRI is superior to CT, namely the assessment of disc signal changes and disc herniation.11 However, dual-energy CT is not yet implemented as a routine tool, as most hospitals do not yet have the technology.
In our study, a distinction has been made between bulging and herniated discs, with CT identified as inferior in the detection of the latter. This is probably due to the fact that soft tissue resolution is lower with CT with the result that some hernias were characterised as bulging when this technique was used. However, other studies including that of Notohamiprodjo et al.25 have demonstrated that CT imaging provides excellent validity and accuracy in the detection of lumbar disc herniation as well as foraminal stenosis. Some authors have also compared it with myelography.26
In any case, as previously explained, MRI and CT are equally valid in the detection of foraminal and/or lumbar canal stenosis, which is caused by disc pathology and is the most important aspect for patient management. Furthermore, some studies such as that of Dutta et al.19 demonstrate that there is no significant correlation between disc prolapse morphology and the presence of clinical manifestations. A limitation of this study is that recess stenosis, which can also cause radiculopathy, was not assessed.
With regard to the limitations inherent to the design of the study, recess stenosis has not been assessed; nor has the degree of foraminal stenosis been quantified. However, this is somewhat compensated for by the severe disc herniation variable, which associates disc herniation with the presence of radiculopathy.
Another drawback of using CT rather than MRI is the radiation associated with CT.27,28 However, with today's technological advances, low-dose CT and iterative reconstruction models enable these levels to be reduced.25 Moreover, this has certain connotations. On the one hand, while there is no doubt that doses above 100 mSv are associated with biological side effects, the risk associated with low-dose radiation exposures is still subject to debate.29 For spinal studies, European dose recommendations are significantly lower, being set at 8 mSv, with low doses to as low as 2 mSv.30 Thus, the benefits to the patient of a properly targeted test outweigh the minimal risks of exposure to such radiation doses.31,32 On the other hand, the population under study is elderly (with a mean age of 64). Sensitivity to the effects of radiation decreases with age, with the associated relative risk being low for people over 40 years and almost insignificant for those over 75. This is because the biological effects of radiation usually appear in the long term, with leukaemias having a latency period of 10–15 years and solid tumours of 10–60 years.33
In addition, the increase in requests for diagnostic imaging tests means that a large number of patients have had a recent abdominal CT scan, which can be examined, obviating the need for further radiological tests. MRI usually has a longer waiting list and is more resource-intensive (both in terms of machine and staff time), and also sometimes requires anaesthesiologist-assisted sedation. This study demonstrates that CT is sufficiently sensitive and specific for assessing patients with chronic low back pain when there are no red flag symptoms, thus enabling better management of the radiology department's resources. In any case, a complementary MRI could be performed if a negative CT scan is accompanied by a strong clinical suspicion of lumbar pathology, or if other causes such as tumours or inflammatory diseases are suspected.25
ConclusionLumbar CT can assess most variables with similar sensitivity and specificity to MRI, except for disc density changes, herniation and Modic type I and II changes. Thus, based on the results obtained, we propose performing lumbar CT scans on all patients who do not present red flag symptoms, as an alternative to MRI. This would enable radiology departments to manage their resources better. In the event that the CT findings do not support the clinical findings, an MRI should be performed subsequently to provide a second set of findings for those variables that CT underdiagnoses or cannot assess due to technical limitations.
Further studies are still required to assess whether re-evaluations of abdominal CTs, low-dose CTs or dual-energy CT scans can also provide valid findings for chronic low back pain in patients who do not present with red flag symptoms.
Author contributionsDr. Martel Villagrán coordinated the study and was responsible for creating the study concept and design. Dr. Martínez-Sánchez collected the data and performed the literature search. Dr. Martel Villagrán, Dr. Cebada-Chaparro and Dr. Martínez-Sánchez collaborated on the analysis and interpretation of the data, drafted the paper, performed a critical review of the manuscript and approved the final version. Elia Pérez-Fernández designed the statistical analysis. Dr. Bueno Horcajadas contributed to the critical review of the manuscript and approved the final version.
FundingThis research has not received any financial support.
Conflicts of interestThe authors declare that they have no conflicts of interest.

