


To calculate a score of metabolic syndrome (MetS) in children and set a cutoff point of this score for the prediction of MetS risk.
MethodsThe study included a random sample of 348 children aged 8 and 9 years of Viçosa, Southeast Brazil. Factor analysis by principal components (PCA) was used to determine, among various risk factors, those with higher degrees of intercorrelation. The chosen variables were: waist circumference (PC), homeostatic model assessment of insulin resistance (HOMA), high density lipoprotein (HDL), triglycerides (TAG) and mean arterial pressure (MAP). Z-scores were created for each one of these parameters and the sum of these z-scores constituted the MetS score. The receiver operating characteristic (ROC) curve was used to identify the cutoff of MetS score, using as gold standard the presence or absence of MetS determined according to criteria age-modified.
ResultsThe prevalence of MetS in the sample was 8.9% by adopting specific criteria for age, and 24% when considering the cutoff of MetS score. The selected cutoff point of 1.86 was accurate to predict the MetS risk in this sample due to its high sensitivity (96.7%), specificity (82.7%) and AUC of 0.96.
ConclusionsThis original Brazilian study presents the MetS score as a suitable alternative for the study of Metabolic Syndrome in children, given the lack of consensus for the definition of this syndrome in childhood.
Calcular um escore de síndrome metabólica (SM) em crianças e definir um ponto de corte para a predição de risco de SM nesse grupo.
MétodosEstudo com amostra aleatória de 348 crianças de 8 e 9 anos do município de Viçosa. Análise fatorial por componentes principais foi utilizada para verificar, entre vários fatores de risco, aqueles com maiores graus de intercorrelação, sendo estes: perímetro da cintura (PC), modelo homeostático de resistência à insulina (HOMA), lipoproteína de alta densidade (HDL), triacilgliceróis (TAG) e pressão arterial média (PAM). Escores-z foram criados para cada um desses parâmetros e o somatório destes constituiu o escore de SM. A curva receiver operating characteristic (ROC) foi utilizada para identificar o ponto de corte do escore, considerando-se como padrão-ouro a presença ou ausência de SM, segundo critérios modificados para a idade.
ResultadosA prevalência de SM na amostra foi de 8,9% adotando-se critérios específicos para a idade, e de 24% quando considerado o ponto de corte do escore. Foi eleito o ponto de corte de 1,86, por possuir elevadas sensibilidade (96,7%) e especificidade (82,7%), AUC de 0,96, e assim, acurácia em predizer a presença de síndrome metabólica em crianças nessa faixa etária.
ConclusõesEste inédito estudo brasileiro apresenta uma alternativa adequada para o estudo da SM em crianças, visto a ausência de definição consensual para a SM na infância.
Metabolic syndrome (MetS) is a condition consisting of several risk factors for cardiovascular disease and diabetes mellitus type 2.1 The etiology of MetS is not fully known, but probably represents a complex interaction between genetic, metabolic, environmental and dietary factors.2 Its clinical diagnosis, which has already been established for adults, is based on metabolic abnormalities that include abdominal obesity, dyslipidemia, high blood pressure (BP) and hyperglycemia.3
The extent of child obesity in Brazil can be demonstrated with data from the Pesquisa de Orçamentos Familiares (POF) carried out in the years 2008 and 2009, which showed that 33.5% of Brazilian children aged five to nine years had excess weight.4 Therefore, it is not surprising that some studies indicate the onset of MetS changes in childhood similar to those found in adults;5,6 however, there is no consensus for the diagnosis of MetS in children.
Considering these facts, many authors have used a MetS score7–16 comprising a numerical representation of the combination of metabolic and cardiovascular risk factors. However, to date, no studies have been found in Brazil that used this score. As it is a continuous variable, the MetS score is a measure that has greater statistical power when compared to the dichotomous classification of MetS (presence/absence).16,17 The use of the MetS score presupposes that the increased cardiovascular risk occurs due to the altogether progressive increase of the MetS parameters.18
Considering the increase in obesity and associated complications in children, the lack of a consensus definition for MetS at this age range, and cardiovascular risk as a progressive function of the several components of MetS, this study aimed to calculate a MetS score specific for the assessed children, using previously published methods,9,13 as well as define a cutoff indicating higher risk of MetS in the sample.
MethodThis is a cross-sectional study of a random sample of children aged 8 and 9 years, from public and private schools in urban and rural areas of the municipality of Viçosa, state of Minas Gerais, Brazil. This age group was chosen to investigate whether metabolic changes commonly observed in adolescence can already be observed, and possibly prevented, in the final stage of childhood. Data collection occurred in the years 2012 and 2013.
Sample size was calculated based on the total number of students enrolled in the 3rd and 4th grades of all the local schools (n=1297). For the calculation, we considered a 50% prevalence of MetS, as there is no consensus regarding its diagnostic criteria. By using a prevalence of 50%, the maximum sample number is guaranteed. A permissible error of 5% was considered, as well as a 95% confidence interval and sample loss of 20%, plus 10% for the multivariate analysis, resulting in an estimated sample of 385 children. The children were organized into a specific worksheet in alphabetical order and drawn using the “random” function in Microsoft Office Excel 2007 program.
The study exclusion criteria were history of cardiovascular disease and type 1 diabetes and/or use of hypotensive or lipid-lowering medications, in addition to the existence of incomplete data.
Blood samples were collected after a 12-hour fasting and analyzed in the Health Division clinical laboratory of Universidade Federal de Viçosa by trained professionals. High-density lipoprotein (HDL) and triacylglycerols (TAG) were measured by the enzymatic colorimetric method. The low-density lipoprotein (LDL) fraction was determined by the Friedewald, Fredrickson and Levy equation.19 Fasting glucose and insulin were measured by glucose oxidase and electrochemiluminescence method, respectively. The homeostatic model assessment (HOMA) was determined, which measures insulin resistance and consists in the product of fasting insulin (μUI/mL) and fasting glucose (mmol/L) divided by 22.5.20 Measures of adiposity assessed were body mass index (BMI) and waist circumference (WC). Based on measurements of weight (kg) and height (m), the Body Mass Index (BMI=body weight (kg)/height (m)2) was calculated. The WC was measured at the midpoint between the last rib and the iliac crest during a normal expiration, using a flexible, inelastic tape, with a length of 2 meters, divided into centimeters and subdivided into millimeters, being careful not to compress the soft parts.21 WC was measured in triplicate and the final value was obtained by averaging the two closest measures.21,22 Systolic (SBP) and diastolic (DBP) blood pressure of the children was measured using a digital blood pressure device and cuff size appropriate for the age group.23 For BP measurement, the child remained in the sitting position for at least five minutes prior to the measurement.23 The measurements were performed in both arms and the measure was repeated in the arm with the higher BP, which was the final measurement used.24 Before the measurements, the child was asked about the need to urinate, previous practice of physical activity and the time elapsed since the last meal, considering the influence of these factors on BP.25 Mean blood pressure (MBP) was calculated, as it represents SBP and DBP in a single variable, by applying the following formula: MBP=[(SBP-DBP/3)+DBP].8,13
MetS was assessed using two methods: (1) classification according to pre-established criteria at the National Cholesterol Education Programme Adult Treatment Panel III (NCEP/ATP III) modified for age by de Ferranti et al.26 and (2) by the MetS score. The presence of MetS, as a categorical variable, was verified by the alteration in at least three of the five criteria defined by the NCEP/ATP III, modified for age by de Ferranti et al.26 in a study using data from the Third National Health and Nutrition Examination Survey, 1988-1994 (NHANES III), which considered the following cutoffs: HDL cholesterol <50 mg/dL; triacylglycerols ≥100 mg/dL; fasting glucose ≥110 mg/dL; waist circumference >75th percentile for age and gender, and blood pressure ≥90th percentile for age, gender and height.
The variables that composed the MetS score were selected according to the results of the Principal Component Analysis (PCA).27 The following variables were included in the PCA: BMI, WC, LDL, HDL, TAG, glucose, HOMA, SBP, DBP and MBP. Variables that had factor loadings >0.3 in retained components were selected to compose the MetS score,28 as follows: WC, TAG, HDL, HOMA and MBP.
To calculate the MetS score, HDL was initially multiplied by –1, as high values of this parameter are inversely related to metabolic risk.13 Z-scores of the WC, TAG, HDL, HOMA and MBP were calculated. The sum of these z-scores constituted a MetS score for each individual. Higher scores indicate a less favorable metabolic profile.13
The MetS score cutoff for the study population was determined by the ROC curve, using as gold standard the presence of MetS according to the criteria adopted by de Ferranti et al.26 The cutoff that had maximum sensitivity and specificity was selected. We also analyzed the area under the ROC curve (AUC), which represents the capacity to use the MetS score to discriminate between those with and without MetS. The AUC was considered as the probability that a child with MetS, selected at random, would have a higher MetS score than a child randomly chosen among individuals without MetS.13 The AUC was interpreted according to the following guidelines: test due to chance (AUC=0.5); low accuracy (0.529
Descriptive statistics were used to identify the number of individual risk factors for MetS (0, 1, 2, 3, or more). The sample characterization according to the MetS components assessed was performed for the total sample and stratified above or below the MetS score cutoff. The asymmetry of all variables was verified by the Shapiro-Wilk test. Differences between groups for continuous variables were verified by Mann-Whitney tests and by Pearson's chi-square test for categorical variables. The chi-square partition with Bonferroni correction was used to compare the number of MetS components between genders. Statistical analysis was performed using the software SPSS 20.0 and Stata 9.1, with p<0.05 being considered significant.
The present study was approved by the Ethics Committee in Human Research of Universidade Federal de Viçosa, process No. 364 485/CEPH. Children's participation was voluntary, after parents/guardians allowed them to participate and read and signed the free and informed consent form.
ResultsOf the 365 participants assessed, 17 were excluded due to incomplete data, resulting in a sample of 348 children. The sample consisted of 59.2% of girls and 40.8% of boys; 48.9% were 8 years old and 51.1% were 9 years old.
As shown in Table 1, there was no significant difference between genders regarding the MetS score values. As for the frequency of the number of MetS components, only the occurrence of one MetS component in relation to the occurrence of no MetS component was higher among boys compared to girls (p=0.001). The minimum and maximum MetS score values were -7.4 and 13.0, respectively. The presence of at least one MetS component was observed in 60.3% of the children. The prevalence of MetS found (≥3 components) was 8.9%. No child had all the MetS components simultaneously.
Score and number of components of metabolic syndrome in children aged 8 and 9 years. Viçosa, MG, 2012 and 2013.
| Total sample | Girls (n=206) | Boys (n=142) | p value | |
|---|---|---|---|---|
| MetS score | —0.58 (3.6) | —0.80 (3.5) | —0.29 (3.9) | 0.220a |
| Components of MetS | ||||
| 0 | 138 (39.7) | 94 (45.6) | 44 (31.0) | 0.013b |
| 1 | 116 (33.3) | 56 (27.2) | 60 (42.2) | |
| 2 | 63 (18.1) | 36 (17.5) | 27 (19.0) | |
| 3 or more | 31 (8.9) | 20 (9.7) | 11 (7.8) | |
MetS, metabolic syndrome.
MetS score shown as median (interquartile interval). MetS Components shown as number of individuals (%).
The cutoff >75th percentile was used to classify the children's WC,26 and it corresponded to 66.05cm for girls and 67.45cm for boys. The WC was altered in 24.7% of the sample.
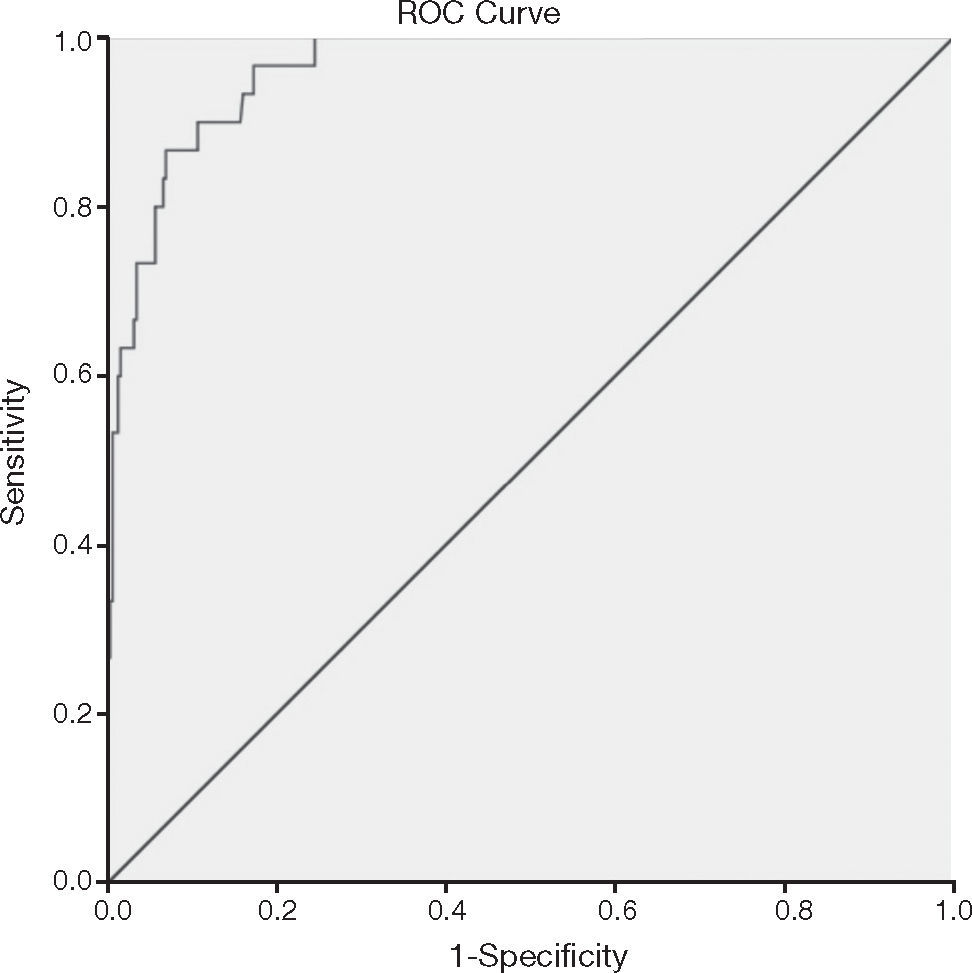
The ROC curve analysis (Fig. 1) indicated high accuracy for the score to predict MetS, verified by the AUC of 0.96 (95% CI: 0.94-0.99). The ROC curve also suggested different MetS score cutoffs, and the cutoff point of 1.86 was chosen, as it showed higher sensitivity (96.8%) and specificity (83.0%). Of the children, 24% (n=84) had MetS scores above the established cutoff (1.86), with this prevalence being much higher than that found according to the classification proposed by de Ferranti et al.26 (8.9%). It is noteworthy that higher scores indicate higher cardiovascular risk, with early risk detection being a fundamental aspect in the context of disease prevention.
 curve for the prediction of metabolic syndrome in children aged 8 and 9 years using the metabolic syndrome score. AUC=0.96 (95%CI: 0.94 to 0.99).")
Table 2 shows that children with MetS score > cutoff (>1.86) had higher levels of all risk variables, with the exception of glucose, as well as higher percentage of alteration of these variables and higher prevalence of MetS, according to the criteria of Ferranti et al.26 The most common abnormality was low HDL (44.0%), and the least common, hyperglycemia (0.6%).
Anthropometric, biochemical and clinical characteristics according to the presence or absence of metabolic syndrome according to a score in children aged 8 and 9 years. Viçosa, MG, 2012 and 2013.
| Total sample | MetS score (cutoff=1.86) | |||
|---|---|---|---|---|
| <1.86 | ≥1.86 | |||
| Cardiometabolic risk variables [median (interquartile interval)] | p valuea | |||
| BMI (kg/m2) | 16.5 (3.8) | 15.8 (2.6) | 21.0 (3.8) | <0.001 |
| WC (cm) | 59.4 (11.0) | 58.0 (7.3) | 73.4 (11.4) | <0.001 |
| Glycemia (mg/dL) | 88.0 (9.0) | 88.0 (9.0) | 89.0 (7.0) | 0.092 |
| HOMA | 1.3 (1.0) | 1.1 (0.8) | 2.3 (1.4) | <0.001 |
| HDL (mg/dL) | 52.0 (16.0) | 54.0 (15.0) | 45.0 (10.0) | <0.001 |
| TAG (mg/dL) | 63.0 (39.0) | 58.0 (30.0) | 93.0 (58.5) | <0.001 |
| SBP (mm Hg) | 98.0 (13.0) | 96.0 (11.0) | 107.5 (18.0) | <0.001 |
| DBP (mm Hg) | 59.0 (11.5) | 57.0 (9.5) | 68.0 (11.0) | <0.001 |
| MetS component alteration, according to de Ferranti et al.26[n (%)] | p valueb | |||
| Elevated WC | 86 (24.7) | 22 (8.3) | 64 (76.2) | <0.001 |
| Hyperglycemia | 2 (0.6) | 2 (0.8) | 0 (0) | 0.424 |
| Low HDL | 153 (44.0) | 92 (34.9) | 61 (72.6) | <0.001 |
| Elevated TAG | 60 (17.2) | 22 (8.3) | 38 (45.2) | <0.001 |
| Elevated BP | 38 (10.9) | 14 (5.3) | 24 (28.6) | <0.001 |
| Diagnosis of MetS, according to de Ferranti et al.26[n (%)] | p valueb | |||
| Absence of MetS | 317 (91.1) | 163 (99.6) | 54 (64.3) | <0.001 |
| Presence of MetS | 31 (8.9) | 1 (0.4) | 30 (35.7) | <0.001 |
MetS, metabolic syndrome; BMI, body mass index; WC, waist circumference; HOMA, homeostatic model assessment of insulin resistance; HDL, high-density lipoprotein; TAG, triacylglycerols; SBP, systolic blood pressure; DBP, diastolic blood pressure; BP, blood pressure; n, number of individuals.
The prevalence of MetS among children in this study, according to the criteria adopted by de Ferranti et al.,26 was 8.9%. In the study carried out by de Ferranti et al.26 in 2004, with individuals aged 12-19 years participating in the NHANES III, a MetS prevalence of 9.2% was observed, similar to that found in the present study.
In 2003, Cook et al.5 had already analyzed the same sample studied by de Ferranti et al.,26 but with different cutoffs for WC and lipid profile, and found a MetS prevalence of 4.2%. A study carried out in 2010 with children aged 7 to 9 years found a MetS prevalence, according to the criteria defined by Cook et al.,5 of 5%, also lower than that identified in this study.13 It is noteworthy that there is no consensual definition for MetS in children.
The use of the MetS score has been recommended by several authors as the most adequate alternative for epidemiological analysis in the pediatric population.7,14,16 In the Corpus Christi Child Heart Study, which involved 403 children, the variables selected to compose the MetS score, according to the factorial analysis, were: fasting insulin, TAG, HDL, SBP and BMI. In the aforementioned study, the MetS score was higher especially among Mexican-American boys compared to non-Hispanic Caucasian ones.7 In a study using data from individuals aged 12-17 years that participated in NHANES 1999-2002, the variables selected to compose the MetS score according to the confirmatory factorial analysis were WC, TAG, SBP and fasting insulin. The authors showed the higher validity of the MetS score with the inclusion of fasting insulin or HOMA index, compared to the validity when using fasting glucose to define MetS.11 A low association of glycemia with the other variables was also detected from the PCA in this study.
In this study, the AUC of 96.3%, observed in the ROC analysis, indicated the high accuracy of the MetS score to identify individuals with MetS, with the cutoff of 1.86 showing the highest sensitivity (96.7%) and specificity (82.7%). A sensitivity value higher than the specificity has implications, such as the identification of individuals as having MetS when they do not actually have the syndrome. On the other hand, if a cutoff with a higher specificity than sensitivity had been chosen, the non-identification of several children with increased risk for MetS would occur. In this study, we chose higher sensitivity, in comparison to specificity, aiming at using the MetS score for early identification of cardiometabolic risk. Thus, children with MetS score above 1.86 should not be considered as having MetS, but being at greater risk for the development of MetS, when compared to those whose score is below the selected cutoff.
A study with children aged 7 to 9 years determined a cutoff of 3.72, for which optimal values of specificity (93.9%), sensitivity (100%) and AUC (0.98) were observed, demonstrating the applicability of using the MetS score in the study population, similar to what was demonstrated in the present study.13 Martínez-Vizcaíno et al.,14 in a study of 1,020 Spanish children aged 10-13 years, confirmed the validity of the MetS score, which consisted of WC, MBP, TAG/HDL ratio and fasting insulin. The authors established a cutoff point of 4.2 from the ROC curve (sensitivity 94.1%, specificity 93.5%, AUC 0.98). In the two aforementioned studies,13,14 the NCEP/ATP III criteria was used as the gold standard for ROC analysis, modified for age by Cook et al.5
The maintenance of the MetS score has been demonstrated throughout life, emphasizing the preventive capacity of the measure for predicting the risk at older ages.7,8 The longitudinal Québec Family Study, which analyzed for 12 years a sample of 147 individuals aged 8-18 years, demonstrated stability over time of both the individual risk indicators and the MetS score, which included the following variables: low HDL and elevated TAG, MBP, glycemia, sum of three trunk skinfolds and total cholesterol/HDL ratio.8
This study has limitations, such as the use of the score in clinical practice due to the complexity of data operationalization, being more applicable to epidemiological studies. Another limitation refers to the fact that the MetS score cutoff is specific for the assessed sample, which impairs the extrapolation of results to other populations. Reproduction of this approach by other authors will require the determination of a cut-off specific for the sample. Furthermore, the use of the MetS score resulted in a large increase in the prevalence of MetS in comparison to the dichotomous classification, which indicates the need of further studies to assess the actual association of the score cutoff to higher cardiometabolic risk. It is worth mentioning that this study refers to the first phase of the investigation, which deals with the development of the score, that has good internal validity for schoolchildren aged 8-9 years. However, the external validity depends on a validation study of the score. Additionally, the study sample is representative only of children aged 8 and 9 years from the municipality of Viçosa. It is recommended to carry out similar studies with larger samples, considering their epidemiological importance at national level, regarding the early detection of cardiovascular risk and prevention.
Despite the above limitations, this is the first Brazilian study that calculated a single MetS score, which represents the overall cardiometabolic risk of all components of the syndrome. By applying this method to a sample of children, we can overcome the limitations arising from the absence of a consensual definition for MetS in childhood, as well as the individual analysis of MetS components. By employing a score for each individual, it is assumed that those who have lower values disclose a better metabolic profile than those with higher scores. The use of the MetS score is interesting, because being a numeric variable, it allows incorporating a higher level information to perform associative analysis, and by incorporating all risk factors in only one variable, it represents the overall cardiometabolic risk.
It can be concluded that the PCA identified WC, HDL, TG, HOMA and MBP as the most appropriate and intercorrelated phenotypic characteristics to compose the MetS score in the sample. The HOMA index showed to be a more adequate component than fasting glucose for the study of MetS in children, considering the results seen in the PCA and its clinical relevance in the physiopathology of the other MetS components. The results of this original Brazilian study have implications in epidemiological and clinical practice, as well as in public health, as the use of a single score for the study of MetS allows us to overcome the limitation of the lack of consensus regarding the definition of MetS in childhood and the age-specific cutoffs for each component. The cutoff selected for the score was able to identify a higher proportion of children (24%) exposed to increased cardiometabolic risk compared to the binary/dichotomous classification of MetS according to predefined criteria (8.9%). The MetS score, as a continuous variable, is a statistically more robust associative measure than the dichotomous syndrome classification, and is capable of representing the overall cardiometabolic risk of all components of MetS in a single variable.
FundingThis study did not receive funding.
Conflicts of interestThe authors declare no conflicts of interest.
