


To evaluate the nutritional status of schoolchildren, resident in a semiarid region in the Northeastern Brazil.
MethodsThis is a cross-sectional study, involving 860 children and adolescents aged from 5-19 years-old, enrolled in three public schools in the county. The selection of schools was non-probabilistic type and unintentional. The initial population, which integrated the database, was composed by 1,035 children and teenagers, and 175 students (16.9%) were excluded because of inconsistency in the anthropometric data, resulting in a sample of 860 students. The following outcomes were considered: stunting (malnutrition), overweight and obesity (overweight), being the height/age and body mass index/age (BMI/Age), indices respectively used. Children and adolescents with height <-2 standard deviations and overweight and obese weight z score ≥1 were considered stunted. The statistical analysis was descriptive.
ResultsThe prevalence of stunting and overweight/obesity was 9.1% and 24.0%, respectively. Overweight and stunting were higher in adolescents aged 15 and over, compared to other age groups analyzed. In relation to gender, malnutrition presented itself in a similar way, but overweight was more frequent among females.
ConclusionsThe results revealed that excess weight, here represented by the sum of overweight and obesity, was more prevalent than stunting (malnutrition), highlighting the urgent need for attention to this problem in order to design interventions capable of contributing to the improvement of schoolchildren nutritional status.
Avaliar o estado nutricional dos escolares de um município do semiárido nordestino.
MétodosEstudo transversal de crianças e adolescentes de 5-19 anos, matriculados em três escolas da rede pública de ensino do município. A população inicial foi composta por 1.035 crianças e adolescentes matriculados na rede, sendo excluídos 175 alunos (17%) por inconsistência de dados antropométricos, resultando 860 estudantes. Foram consideradas como variáveis desfechos, o deficit estatural (desnutrição) e o sobrepeso e obesidade (excesso de peso), sendo utilizados os índices altura/idade e o índice de massa corporal/idade (IMC/idade), respectivamente. Foram considerados com deficit estatural crianças e adolescentes com altura <-2 desvios-padrão e, com sobrepeso e obesidade, escore z do peso ≥1. A análise estatística foi descritiva.
ResultadosA prevalência de deficit estatural e a de sobrepeso/obesidade foi 9,1% e 24,0%, respectivamente. O excesso de peso e o deficit estatural foi maior nos adolescentes maiores de 15 anos. Em relaçao ao sexo, a desnutriçao apresentou-se de forma similar, e o excesso de peso acometeu mais os do sexo feminino.
ConclusõesOs resultados revelaram que o excesso de peso, aqui representados pelo somatório das duas condições – sobrepeso/obesidade –, apresentou maior prevalência que o deficit estatural (desnutrição), deixando clara a necessidade da atenção a esse problema para viablizar intervenções que contribuam com a melhoria do estado nutricional de escolares.
Brazil is undergoing a clear process of nutritional transition marked by distinct characteristics and stages, which shows a marked increase in the prevalence of overweight and obesity at different stages of life, whereas malnutrition, among other nutritional deficiencies, still remains a health problem to overcome.1
According to the Household Budget Survey (HBS), conducted in 2008-2009, the percentage of children with growth retardation in Brazil is 6.8%.2 The height/age index is one of the indicators that helps detect child malnutrition by presenting the delay in the child's linear growth, a fact that continues to arouse the concern of health authorities and researchers in the area of child health. Paradoxically, data from this same study revealed that the prevalence of excess weight affects 33.5% of children aged 5 to 9 years, and 21.7% and 19% of male and female adolescents, respectively.
Epidemiological studies have shown that the prevalence of excess weight has surpassed that of malnutrition in all age groups and social and demographic strata. This represents a risk factor in the short and long term for the increase of non-communicable chronic diseases (NCCD), which have been shown to be more frequent and of earlier onset in contemporary society.3,4
Children and adolescents are biologically more vulnerable to these diseases, and thus, as a group, they are a good indicator of the presence of nutritional disorders in the population.5 In this context, among the public policies of prevention and control of nutritional disorders and of health promotion in children and adolescents, the Health at School Program (HSP) was established through a presidential decree, as a result of a partnership between the Brazilian Ministries of Health and Education.
This policy aims to expand health interventions among students from public schools, as well as the evaluation of health status, health promotion, and disease prevention.6
This study aimed to assess the nutritional status of schoolchildren, participants of the School Health Mobilization Week, in Maribondo, a city located in semiarid Northeastern Brazil, promoted by the HSP in 2012, and to compare the nutritional profile of this group with that established by the reference curves proposed by the World Health Organization (WHO).7
MethodThis was a cross-sectional study, conducted based on data from the 1st School Health Mobilization Week of the HSP in Maribondo, a municipality in the state of Alagoas, in semiarid Northeastern Brazil.
Maribondo is a small Brazilian city, whose population is estimated at around 14,000 inhabitants in an area slightly larger than 171 km², which has a Human Development Index (HDI) of 0.64, calculated according to the Atlas of Human Development/UNDP.8 The HDI in the semiarid region is less than 0.65 in approximately 82% of the municipalities, with a deficit in regard to income and education indicators, among others. The municipality of Maribondo has an urbanization of 73.3%, and approximately 50% of the population lacks access to basic sanitation, including municipal water supply and sewage or garbage collection services. There are six Basic Health Units (BHUs), and 25 public schools in the municipality, with 4,029 students attending elementary and high school.9 Thus, this municipality was intentionally chosen for its high degree of poverty, here represented by the low HDI, to assess the nutritional status of children and adolescents.
The actions of the HSP, which in 2012 prioritized the prevention of obesity in childhood and adolescence, are developed by teams from the Family Health Strategy (FHS) linked to BHUs, who visit the schools to examine and evaluate children's health status and to develop educational practices for health promotion and disease prevention.6 More detailed information on the design and methodological aspects of the HSP is available in official publications of the Brazilian government.10
The study assessed children and adolescents aged 5 to 19 years enrolled at three public school schools of the municipality, using a non-probabilistic and random sampling method of school selection, respecting the municipal school network's decision to join the HSP. The initial population, which integrated the database of the HSP in 2012, consisted of 1,035 children and adolescents enrolled in three schools from the public network, with two located in the urban area and one in the countryside. A total of 175 students (16.9%) were excluded due to inconsistent anthropometric data, i.e. missing measurements of weight and/or height, resulting in a sample population of 860 students.
Anthropometric assessments were performed after staff training, according to the technical procedures recommended by the WHO in 199511 and the Brazilian Ministry of Health.12 Data were collected by FHS professionals and the nutritionist who coordinated the actions of the HSP in the municipality. Anthropometric data were recorded on a specific form.
Body weight was measured using an anthropometric digital scale graduated from 0 to 150 kg with a precision of 0.05 kg, and height was measured with a portable stadiometer fixed to the wall, ranging from 0 to 200 cm, with a precision of 0.2 cm.
The body mass index (BMI) was calculated by dividing body weight (kg) by height squared (m2).
To assess the nutritional status, the height/age index and the BMI/age index were used to diagnose growth delay and excess weight, respectively. The growth curves of WHO 2006 were used as reference for both.13
Children and adolescents with height <-2 standard deviations below the expected median for age and gender, expressed in z-scores, were considered as stunted. Children whose z-scores were ≥-2 standard deviations were considered appropriate height/age.
The classification of children and adolescents, according to BMI/age, was also expressed as z-score, by adopting the following cutoffs for categorization of results: underweight, z-scores ≤-2; adequate weight, z-scores >-2 to <1; and excess weight, here represented by the sum of the two conditions; overweight/obesity, with z-scores ≥1.
Data analysis included the following variables: weight, age, gender, and geographical location of the school, which was also inferred as the location of the residence. Age was calculated in months and was obtained by the difference between the date of data collection and date of birth. For the analysis, children and adolescents were categorized into three groups: under 10, 10-15, and older than 15 years.
AnthroPlus-2007 software (WHO AnthroPlus for personal computers: software for assessing growth of world's children and adolescents. Geneva, Switzerland) was used in the assessment of nutritional status. All data were entered in duplicate and validated using Epi-Info software, release 6.04 (Centers for Disease Control and Prevention. Atlanta, USA).
To classify the nutritional status and define the prevalence of malnutrition and excess weight, descriptive statistics were used, by simple frequency according to age, gender, and geographical location of the school and the home.
Nutritional status was also assessed by the means of the z-scores and their respective standard deviations according to age, gender, and geographical location of the school and the home.
The dependent variables height/age and BMI/age were analyzed as categorical. Statistical associations were estimated in relation to these indices, as they represent the highest prevalence of malnutrition and excess weight; this prevalence is currently considered the most characteristic epidemiological expression, and representative of anthropometric deviations in the Brazilian pediatric population.14 The chi-squared test was used to compare categorical variables of the groups. This test, with Yates correction, was applied to dichotomous variables, considering a statistical significance of p≤0.05.
To compare the growth curves of the studied population with the WHO reference curves, graphs were drawn for height/age and BMI/age indices, using the AnthroPlus 2007 software.
As this was a study based on secondary data related to data from an official government program, the municipal managers of this program were asked for a letter of consent allowing the analysis of data and disclosure of results. The project was approved by the Research Ethics Committee of the Centro de Estudos Superiores de Maceió.
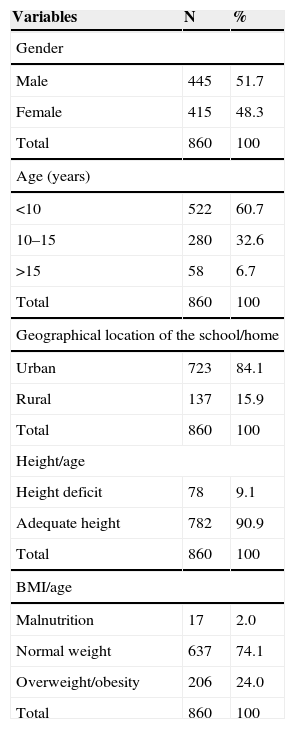
ResultsOf the 860 children and adolescents evaluated, 51.7% were males, and 48.3% females. When stratifying by age, 60.7% were younger 10 years, 32.6% were between 10 and 15 years, and 6.7% were older than 15 years. Regarding geographical location, 84.1% resided and studied in schools located in the urban area, and 15.9% in rural areas. A prevalence of malnutrition of approximately 9% was found, according to the height/age index, for the population as a whole. For BMI/age, the prevalence of excess weight, according to the used cutoff, was 24.0% (Table 1).
Characterization of the population of children and adolescents, by gender, age, geographical location of the school/home, and nutritional status. Maribondo, AL, 2012
| Variables | N | % |
|---|---|---|
| Gender | ||
| Male | 445 | 51.7 |
| Female | 415 | 48.3 |
| Total | 860 | 100 |
| Age (years) | ||
| <10 | 522 | 60.7 |
| 10–15 | 280 | 32.6 |
| >15 | 58 | 6.7 |
| Total | 860 | 100 |
| Geographical location of the school/home | ||
| Urban | 723 | 84.1 |
| Rural | 137 | 15.9 |
| Total | 860 | 100 |
| Height/age | ||
| Height deficit | 78 | 9.1 |
| Adequate height | 782 | 90.9 |
| Total | 860 | 100 |
| BMI/age | ||
| Malnutrition | 17 | 2.0 |
| Normal weight | 637 | 74.1 |
| Overweight/obesity | 206 | 24.0 |
| Total | 860 | 100 |
The prevalence of malnutrition was within the range of 6% to 21%. The highest prevalence of malnutrition was found in the group of students aged >15 years (20.7%), followed by the group aged between 10 and 15 years (11.1%). For the other variables, gender and geographic location of school and home, no statistically significant differences were found between the analyzed categories (Table 2).
Classification of the nutritional status of children and adolescents according to age, gender, and geographical location of the school/home by height/age index. Maribondo, AL, 2012
| Variables | n | Nutritional status | p | |||
|---|---|---|---|---|---|---|
| Height deficit height/age | Adequate height | |||||
| <−2 | >–2 | |||||
| n | % | n | % | |||
| Age (years) | ||||||
| <10 | 522 | 35 | 6.7 | 487 | 93.3 | <0.001 |
| 10–15 | 280 | 31 | 11.1 | 249 | 88.9 | |
| >15 | 58 | 12 | 20.7 | 46 | 79.3 | |
| Gender | ||||||
| Male | 445 | 44 | 9.9 | 401 | 90.1 | 0.46 |
| Female | 415 | 34 | 8.2 | 381 | 91.8 | |
| Geographic location of school/home | ||||||
| Urban | 723 | 69 | 9.5 | 654 | 90.5 | 0.34 |
| Rural | 137 | 9 | 6.6 | 128 | 93.4 | |
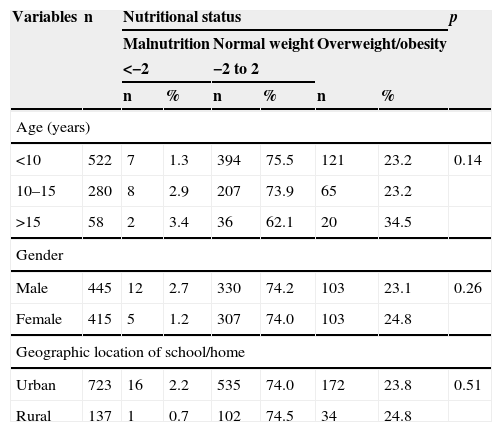
Regarding the classification of nutritional status according to BMI/age, the observed prevalence of overweight/obesity ranged between 23.2% and 34.5%, with no significant differences between the analyzed categories (Table 3).
Classification of the nutritional status of children and adolescents according to age, gender, and geographical location of the school/home by BMI/age index. Maribondo, AL, 2012
| Variables | n | Nutritional status | p | |||||
|---|---|---|---|---|---|---|---|---|
| Malnutrition | Normal weight | Overweight/obesity | ||||||
| <−2 | −2 to 2 | |||||||
| n | % | n | % | n | % | |||
| Age (years) | ||||||||
| <10 | 522 | 7 | 1.3 | 394 | 75.5 | 121 | 23.2 | 0.14 |
| 10–15 | 280 | 8 | 2.9 | 207 | 73.9 | 65 | 23.2 | |
| >15 | 58 | 2 | 3.4 | 36 | 62.1 | 20 | 34.5 | |
| Gender | ||||||||
| Male | 445 | 12 | 2.7 | 330 | 74.2 | 103 | 23.1 | 0.26 |
| Female | 415 | 5 | 1.2 | 307 | 74.0 | 103 | 24.8 | |
| Geographic location of school/home | ||||||||
| Urban | 723 | 16 | 2.2 | 535 | 74.0 | 172 | 23.8 | 0.51 |
| Rural | 137 | 1 | 0.7 | 102 | 74.5 | 34 | 24.8 | |
Regarding the z-score values, one can observe lower means for height/age index in the population aged >15 years. For the BMI/age index, higher values of z-score were also found among those aged >15 years, and in female children and adolescents (Table 4).
Mean z–scores of children and adolescents by variables: age, gender, and geographical location of the school/home, according to height/age and BMI/age indexes. Maribondo, AL, 2012
| Variables | N | Height/age | BMI/age | ||||
|---|---|---|---|---|---|---|---|
| Age (years) | Mean | (± SD) | p | Mean | (± SD) | p | |
| <10 | 522 | −0.46 | 1.14 | <0.0001 | 0.35 | 1.15 | 0.01 |
| 10–15 | 280 | −0.72 | 1.13 | 0.16 | 1.16 | ||
| >15 | 58 | −1.04 | 1.13 | 0.59 | 1.51 | ||
| Gender | |||||||
| Male | 445 | −0.60 | 1.21 | 0.76 | 0.25 | 1.25 | 0.02 |
| Female | 415 | −0.57 | 1.07 | 0.36 | 1.11 | ||
| Geographic location of school/home | |||||||
| Urban | 723 | −0.61 | 1.16 | 0.13 | 0.27 | 1.20 | 0.08 |
| Rural | 137 | −0.45 | 1.03 | 0.46 | 1.07 | ||
Figure 1 shows the comparison of the height/age index and BMI/age index curves of the study population when compared with reference curves proposed by the World Health Organization. Children and adolescents in the present study showed, in general, lower values of z-score for height/age index and higher values for BMI/age index, when compared to the analyzed reference points.
Discussion curve, according to height/age and BMI/age indexes. Maribondo, AL-2012.")
In spite of its enormous potential, the Brazilian semiarid region is marked by great social inequality.15 The results here demonstrate that the prevalence of excess weight (24.0%) and stunting (9%) among the assessed children and adolescents consolidates an antagonism between malnutrition and excess weight trends, characteristic of an unfinished nutritional transition, and therefore shows the development of a complex epidemiological profile, marked by the coexistence of malnutrition and obesity, as observed in the Brazilian population in general.1–3,16
Regarding stunting at the age range of 5 to 9 years, which affects the students from public schools in the study municipality, it resembles the situation found in the Household Budget Survey (HBS)17 for Brazilian children, in which the prevalence of low height was 6.8%, slightly higher among males (7.2%) than in females (6.3%). To assess the nutritional status of the adolescent population studied by Household Budget Survey (HBS) 2008-2009, the authors considered only the anthropometric BMI/age index, not providing the prevalence of stunting for the population at this stage of life.2
As for the height/age index, a high percentage of stunting (20.7%) was observed in adolescents aged 15-19, showing a statistically significant difference compared to the other assessed age ranges. When comparing the means of the z-scores for the height/age index of the age groups analyzed, a statistical difference was observed between the values, confirming the presence of stunting also among those older than 15 years.
These differences between the age groups analyzed may be explained by the decrease in stunting, as shown in the Brazilian population, with a decrease from 29.3% (1974-75) to 7.2% (2008-9) in boys, and 26.7% to 6.3% in females between 5 and 9 years, according to data from nationwide studies developed in Brazil in the last decades.18,19 In accordance with these data, Ferreira et al, analyzing the temporal trend of stunting in children younger than 5 years in the state of Alagoas, found a decrease from 22.5% to 11.4% in its prevalence between 1992 and 2005.20
Regarding excess weight, the study also observed a higher than expected prevalence for the entire population studied, ranging from 23.2% to 35.5% in all age groups represented. It is noteworthy that there were more female children and adolescents with excess weight, corroborating the studies by Vieira et al21 and Guedes et al,22 which, when investigating the prevalence of excess weight among children and adolescents, found that female gender was a significant associated factor.
Excess weight in children and adolescents, in general, may be a reflection of changes related to lifestyle observed in large cities, with similar trends also appearing to occur in small towns.3 Another noteworthy fact is the progression of excess weight with increasing age observed in this study. Previous studies have warned that there is a high risk for obese adolescents to become obese adults, when compared to individuals who were only obese in childhood.23,24
Moreover, at this phase of life, habits are deeply influenced by friends or imposed by the media, thus constituting a difficult phase to adopt healthy eating habits and prevent a sedentary life style. Children and adolescents are increasingly exposed to diets with excess fats that are poor in fruits and vegetables, and there is a positive association between hours spent on sedentary activities (television, video games, computer) and the increase in obesity.25,26
Regarding the variable geographical location of the school and home, the two diseases in question (malnutrition and excess weight) do not appear to differ in terms of prevalence in the analyzed categories. There was no difference between the assessment of the nutritional status of children and adolescents who studied and lived, respectively, in schools and homes located in the urban and rural areas of the municipality. Studies have shown that living in small towns and, in general, in rural areas, may be a protective factor for diseases such as obesity.27 However, the epidemiological data found in the present study provided evidence that this reasoning does not reflect the reality in all regions.
Regarding the growth standards of the children and adolescents evaluated, it was observed that they follow the international standards proposed by the WHO, although demonstrating a deficit regarding the expected standard for height/age and for BMI/age, a shift that also indicates higher proportions of excess weight in this population, when compared to the reference. Therefore, the curve shows a shift to the left for the height/age index, and a shift to the right for the BMI/age index.
This nutritional assessment, performed throughout Brazil and promoted by the Brazilian Ministries of Health and Education, was shown here as the portrait of the nutritional status of schoolchildren from 5 to 19 years in a northeastern municipality. Therefore, it is concluded that the prevalence of stunting and excess weight among schoolchildren in Maribondo during the studied period affected all age groups analyzed and, more markedly, individuals older than 15 years and the female gender. These results indicate the occurrence of nutritional transition, now nearing completion in developed countries, are also being consolidated in small cities, as it has been occurring in the Brazilian population – a fast decrease in the occurrence of malnutrition and an increasing prevalence of overweight and obesity.
Despite the limitations inherent to studies with non-probabilistic sampling procedures, the demographic and socioeconomic indicators of the population studied here are homogeneous among populations living in the semiarid Northeast Region, assuming that the findings have external validity for regions with similar characteristics.28 Thus, the results of the present study demonstrate that, in this population, the issue of excess weight should be treated, in terms of public policy, with the same attention and care demanded by malnutrition, in order to contribute to the improvement of schoolchildren's nutritional status.
For that, the authors emphasize the importance of involving not only the health and education sectors in the process, but also understanding the importance of partnerships to overcome the determinants of the health-disease process, defining different actions by different Brazilian ministries (Education, Cities, Sport, Land Development, Social Development, Environment, Agriculture/EMBRAPA, Labor, and Planning), and non-governmental organizations, businesses, and civil society, in order to enable interventions that will have a positive impact on the decrease of overweight/obesity and to achieve the goals proposed by the Strategic Action Plan Against Chronic Non-Communicable Diseases in Brazil, created by the Ministry of Health, which includes reducing the prevalence of obesity in children and adolescents.29
Considering the presented facts and the innumerable social inequalities found in the semiarid setting, it is suggested that further studies are conducted in order to implement actions that contribute to ensure access to health care, education, and quality of life, preventing disorders, especially nutritional, which may compromise the growth and development of these children and adolescents.
Conflicts of interestThe authors declare no conflicts of interest.
