

The program ‘Via verde do AVC’ has been implemented in Portugal since 2005, with the objective of reducing mortality by stroke. Mortality rates from stroke have been decreasing, but no studies have been done measuring the link between this trend and ‘Via verde do AVC’.
This study aims to assess whether the program has achieved significant health gains. We rely on two data sources: individual level hospital data on ischemic stroke admissions and regional level stroke mortality rates.
For both types of data we find no evidence that ‘Via verde do AVC’ had a statistically significant impact on ischemic stroke mortality.
O programa “Via verde do AVC” foi implementado em Portugal desde 2005, com o objetivo de reduzir a mortalidade por AVC. As taxas de mortalidade por AVC têm vindo a diminuir, mas nenhum estudo tentou medir a ligação entre esta tendência e a “Via verde do AVC”.
Este estudo pretendeu avaliar se o programa conseguiu ganhos significativos de saúde. Contámos com 2 fontes de dados: dados hospitalares a nível individual de internamentos por AVC isquémico e taxas regionais de mortalidade por AVC.
Para ambos os tipos de dados não encontrámos qualquer evidência de a “Via verde do AVC” ter um impacto estatisticamente significativo sobre a mortalidade do AVC isquémico.
As defined by WHO, stroke is a cerebrovascular disease (CVD) “caused by the interruption of the blood supply to the brain, usually because a blood vessel bursts [hemorrhagic stroke] or is blocked by a clot [ischemic stroke].”1
There are 15 million people suffering from stroke every year – a trend that is expected to hold in the future. Of those, 5.5 million die and other 5 million are left permanently disable. It is the third cause the death in the World (10%), only exceeded by coronary heart disease (13%) and cancer (12%).2
Vascular diseases are the number one cause of death also in Portugal. They are responsible for almost 40% of mortality,3 and of those, approximately 45% are caused by stroke. In 2004, the standardized mortality by stroke was 97.6/100.000 inhabitants, with large regional asymmetries.4
Despite the efforts devoted to the development of more effective drugs,5 intravenous rt-PA (recombinant tissue plasminogen activator) is the only approved treatment for stroke; it is only effective for acute ischemia – responsible for about 80% of the total stroke episodes, and can only be used within 3h after the beginning of symptoms.
For this reason – and given the fact that up to 70% of mortality by stroke occurs before arrival to the hospital,6 the National Health Plan and the National Program for Prevention and Control of CVD have defined specific strategies and targets to reduce both the standardized mortality rate, in particular for people below 65 years old, and in-hospital mortality by stroke.4 In order to achieve these targets, the program ‘Via verde do AVC’ has been implemented across the country since 2005 and the entire process followed by patients was redesigned.
The process is initiated by a phone call to the emergency number (112) and redirected to a local and specialized call center (CODU) that coordinates the operations until the arrival of the patient to the hospital (Pre-hospital Stage). When arrived at the hospital, a battery of exams are done, in order to certify that the patient fulfills all the medical requirements for rt-PA administration (In-hospital Stage). For those who survive but are not fully recovered from the stroke episode, there is a net of rehabilitation services, intended to provide assistance to the patients after the in-hospital period (Post-hospital Stage/Rehabilitation). For further details, see the reports from the “Coordenação Nacional para as Doenças Cardiovasculares”.Via verde applies only to patients 18 or older and up to 80 years old.
Stroke programs worldwideIn response to programs aimed at reducing blood pressure and smoking, the incidence of stroke in developed countries has been declining in the recent years.7 Nevertheless, the overall rates are still high, and many countries (such as USA, Denmark, Spain and Netherlands) have already introduced stroke programs specifically targeted to stroke patients.
Investments have been made in educational programs to increase awareness of procedures for initial assessment, acute treatment, and transport of potential stroke patients.8 Intra-hospital changes have also been introduced during the last decade, aimed to reduce delays in medical response.9,10
Organizational changes in both pre- and intra-hospital stages as done in Spain, analyzed through time, have translated not only in more patients treated with rt-PA, but also in a significantly larger percentage of patients who achieve functional independence after 3 months.11
Another important aspect is the post-hospital stage of stroke, as rehabilitation can also deliver significant health gains for stroke patients – shorter admission times, greater independence, improvement in quality of life and greater probability of home discharge instead of long-tem care.12
Moreover, cost-effectiveness studies carried out in the USA,13 Spain,14 and in Netherlands15 show that these organizational changes in stroke assistance have translated into cost savings, while generating health gains.
In short, when properly planned and implemented, it can be said that organizational change can facilitate and support scientific advances, achieving both health gains and cost savings. In this sense, this work aims to assess whether the “Via verde do AVC” (VV-AVC) program in Portugal has achieved significant health gains and, if not, what might be the reasons for such result.
Data collection and methodologyThe analysis was performed by studying individual level in-patient hospital data on stroke admissions and by studying regional level stroke mortality rates, in order to search for a link between the existence of Via verde and a reduction in stroke mortality.
In the analysis of in-hospital mortality each observation corresponds to a single stroke episode, and only the episodes treated in an hospital are considered, while the regional analysis is based on regionally aggregated data, taking into account all the cases in which stroke was stated as the cause of death. Moreover, in the first approach the clinical outcome is survival or death of stroke patients, while in the second analysis the outcome variable is the stroke mortality rate per 100.000 inhabitants.
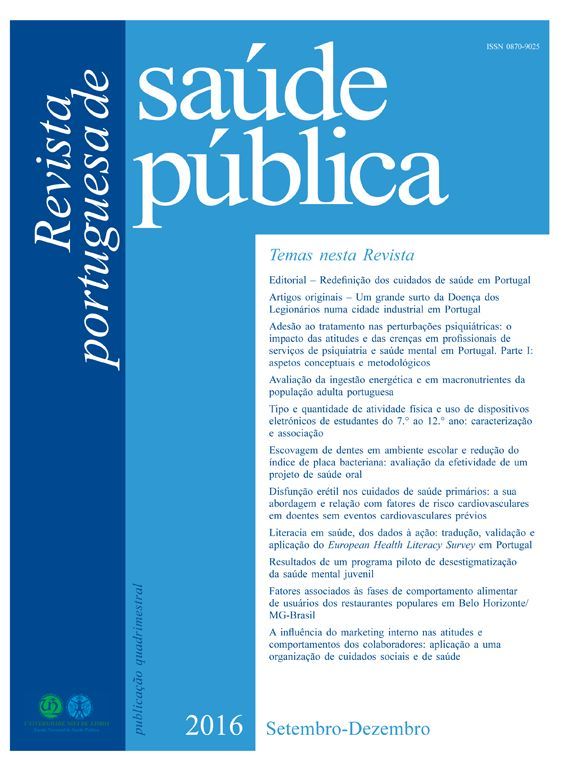
In both cases the methodology used will be the differences-in-differences approach. This approach is used often and it ensures that the results are valid even if other factors are changing mortality rates over time. An example of the use of differences in differences in Economics can be seen in the work of Meyer.16 The basic idea is illustrated in Fig. 1, where the approach filters out other changes from the analysis by looking at how changes over time differ between areas and years where VV-AVC was initiated and areas and years without VV-AVC. A limitation of the analysis is that it assumes changes over time would be similar for both types of areas if there were no VV-AVC.
In-hospital mortality
Clinical information on stroke patients for in-hospital mortality this analysis considers only Health Regions North and Algarve, since these were the only regions with consistent data available on the VV-AVC starting dates. It was collected from the annual DRG databases (known as GDH in Portugal). Data on the starting date of the program in each of the relevant hospitals were collected from official reports and press releases published by ARS Norte and Algarve. Based on the opinion of medical experts, the relevant episodes selected had a first diagnosis (ICD 9 CM) with codes 433 or 434 – ischemic stroke, which are the program's target. These criteria have been used previously in published work.17,18 Since VV-AVC started in 2005, and the analysis requires data from before and after the program's introduction in each hospital (as well as data from hospitals without VV-AVC), the time frame considered was from 2004 to 2009. For other Health Regions we were not able to find a comprehensive list with the starting dates of VV-AVC by hospital.
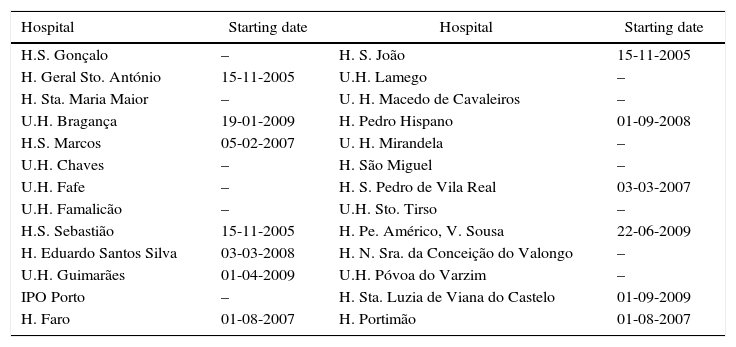
The criteria specified earlier lead to a selection of 28.837 episodes. This data were analyzed by logistic regression performed with STATA 10. The hospitals considered and the VV-AVC starting dates are described in Table 1. The explanatory variables used can be seen in Table 2.
Hospitals under analysis and VV-AVC starting dates.
| Hospital | Starting date | Hospital | Starting date |
|---|---|---|---|
| H.S. Gonçalo | – | H. S. João | 15-11-2005 |
| H. Geral Sto. António | 15-11-2005 | U.H. Lamego | – |
| H. Sta. Maria Maior | – | U. H. Macedo de Cavaleiros | – |
| U.H. Bragança | 19-01-2009 | H. Pedro Hispano | 01-09-2008 |
| H.S. Marcos | 05-02-2007 | U. H. Mirandela | – |
| U.H. Chaves | – | H. São Miguel | – |
| U.H. Fafe | – | H. S. Pedro de Vila Real | 03-03-2007 |
| U.H. Famalicão | – | U.H. Sto. Tirso | – |
| H.S. Sebastião | 15-11-2005 | H. Pe. Américo, V. Sousa | 22-06-2009 |
| H. Eduardo Santos Silva | 03-03-2008 | H. N. Sra. da Conceição do Valongo | – |
| U.H. Guimarães | 01-04-2009 | U.H. Póvoa do Varzim | – |
| IPO Porto | – | H. Sta. Luzia de Viana do Castelo | 01-09-2009 |
| H. Faro | 01-08-2007 | H. Portimão | 01-08-2007 |
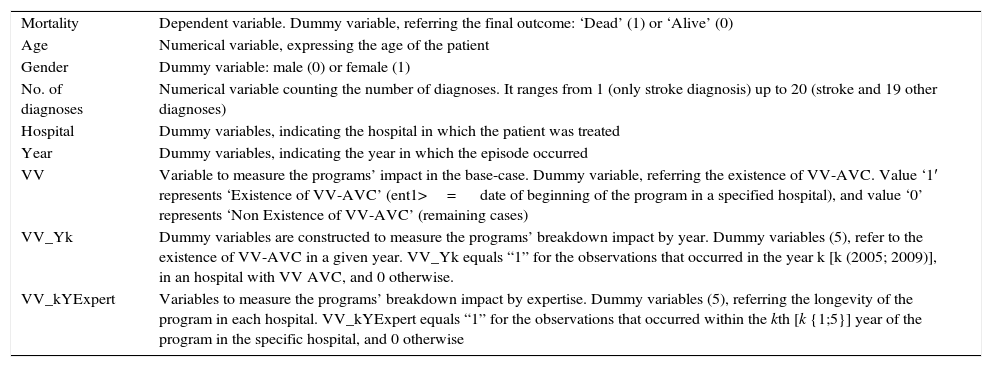
Variables of in-hospital analysis.
| Mortality | Dependent variable. Dummy variable, referring the final outcome: ‘Dead’ (1) or ‘Alive’ (0) |
| Age | Numerical variable, expressing the age of the patient |
| Gender | Dummy variable: male (0) or female (1) |
| No. of diagnoses | Numerical variable counting the number of diagnoses. It ranges from 1 (only stroke diagnosis) up to 20 (stroke and 19 other diagnoses) |
| Hospital | Dummy variables, indicating the hospital in which the patient was treated |
| Year | Dummy variables, indicating the year in which the episode occurred |
| VV | Variable to measure the programs’ impact in the base-case. Dummy variable, referring the existence of VV-AVC. Value ‘1′ represents ‘Existence of VV-AVC’ (ent1>= date of beginning of the program in a specified hospital), and value ‘0’ represents ‘Non Existence of VV-AVC’ (remaining cases) |
| VV_Yk | Dummy variables are constructed to measure the programs’ breakdown impact by year. Dummy variables (5), refer to the existence of VV-AVC in a given year. VV_Yk equals “1” for the observations that occurred in the year k [k (2005; 2009)], in an hospital with VV AVC, and 0 otherwise. |
| VV_kYExpert | Variables to measure the programs’ breakdown impact by expertise. Dummy variables (5), referring the longevity of the program in each hospital. VV_kYExpert equals “1” for the observations that occurred within the kth [k {1;5}] year of the program in the specific hospital, and 0 otherwise |
To capture the effects of VV-AVC alternative approaches were followed:
- ∘
Base case – a single dummy variable (VV) is used to account for the existence of the program.
- ∘
Breakdown of the impact by year – This approach is meant to capture the effect of VV-AVC in a specific year. The more people are aware, prone and able to use the program, the greater the overall impact it can attain. However, since this process of change is generally slow, it is predictable that, as time passes, the program enlarges its coverage and, consequently, the average impact on the target population increases.
- ∘
Breakdown of the impact by expertise – it captures the effect of expertise acquired with the practice in Via verde do AVC. It is expected that, the longer the existence of the program, the better the system performs, which ultimately translates into a greater impact on clinical outcomes. For a given hospital a set of dummy variables capture the first year of VV-AVC in that hospital, the second year, and so forth. All dummy variables set to zero mean that a hospital never had VV-AVC.
A similar analysis was also performed, limiting the sample to 9.014 ischemic stroke episodes of patients with age higher than 18 and lower than 65 years old (which is the range defined by the National Health Plan as the priority target group), instead of a range from 18 to 80 (which is the maximum range for clinical intervention).
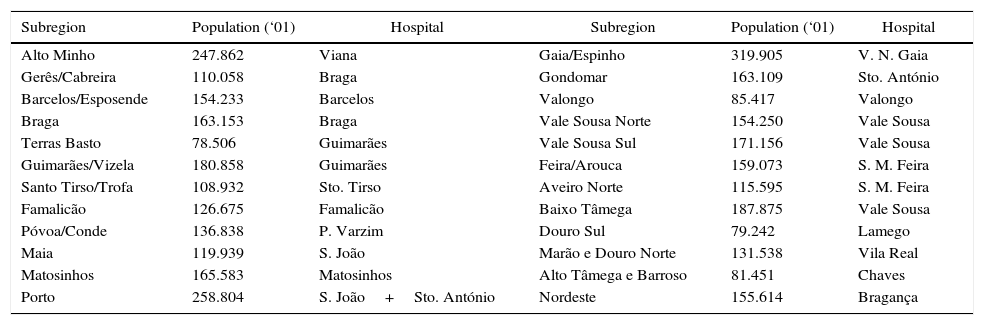
Regional mortalityThis analysis is limited to subregions in the North Health Region (considering the Hospitals mentioned in Table 1, except H. Faro and H. Portimão, also due to data limitations). The North health Region was divided into 24 subregions with average population of 152.319 (in 2001), as detailed in Table 3. The data concerning stroke mortality (standardized mortality rate – SMR) by subregion, year, gender and age group were made available by ARS Norte (the primary source of data being INE). It was not possible to limit the analysis to the program's target population so all deaths by cerebrovascular diseases, for all ages, were included.
Subregions under analysis, population (in 2001) and Hospitals by subregion.
| Subregion | Population (‘01) | Hospital | Subregion | Population (‘01) | Hospital |
|---|---|---|---|---|---|
| Alto Minho | 247.862 | Viana | Gaia/Espinho | 319.905 | V. N. Gaia |
| Gerês/Cabreira | 110.058 | Braga | Gondomar | 163.109 | Sto. António |
| Barcelos/Esposende | 154.233 | Barcelos | Valongo | 85.417 | Valongo |
| Braga | 163.153 | Braga | Vale Sousa Norte | 154.250 | Vale Sousa |
| Terras Basto | 78.506 | Guimarães | Vale Sousa Sul | 171.156 | Vale Sousa |
| Guimarães/Vizela | 180.858 | Guimarães | Feira/Arouca | 159.073 | S. M. Feira |
| Santo Tirso/Trofa | 108.932 | Sto. Tirso | Aveiro Norte | 115.595 | S. M. Feira |
| Famalicão | 126.675 | Famalicão | Baixo Tâmega | 187.875 | Vale Sousa |
| Póvoa/Conde | 136.838 | P. Varzim | Douro Sul | 79.242 | Lamego |
| Maia | 119.939 | S. João | Marão e Douro Norte | 131.538 | Vila Real |
| Matosinhos | 165.583 | Matosinhos | Alto Tâmega e Barroso | 81.451 | Chaves |
| Porto | 258.804 | S. João+Sto. António | Nordeste | 155.614 | Bragança |
Data on population by region through time were collected from INE databases. The information previously collected concerning the starting date of VV-AVC in each hospital was also used for this analysis. The time frame considered was from 2001 to 2009.Regression analysis with 216 observations was performed with STATA 10, using multiple linear regressions, in two different approaches:
- •
Simple linear regression
- •
Linear regression weighted by regional population
As for in-hospital data, a similar analysis was performed for regional data, including only episodes below 65 years old. The variables included are described in Table 4.
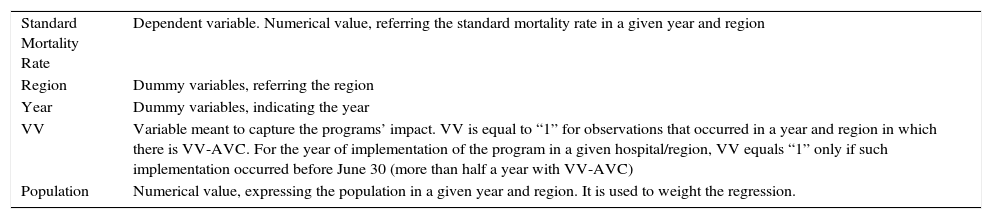
Variables in the Regional Analysis.
| Standard Mortality Rate | Dependent variable. Numerical value, referring the standard mortality rate in a given year and region |
| Region | Dummy variables, referring the region |
| Year | Dummy variables, indicating the year |
| VV | Variable meant to capture the programs’ impact. VV is equal to “1” for observations that occurred in a year and region in which there is VV-AVC. For the year of implementation of the program in a given hospital/region, VV equals “1” only if such implementation occurred before June 30 (more than half a year with VV-AVC) |
| Population | Numerical value, expressing the population in a given year and region. It is used to weight the regression. |
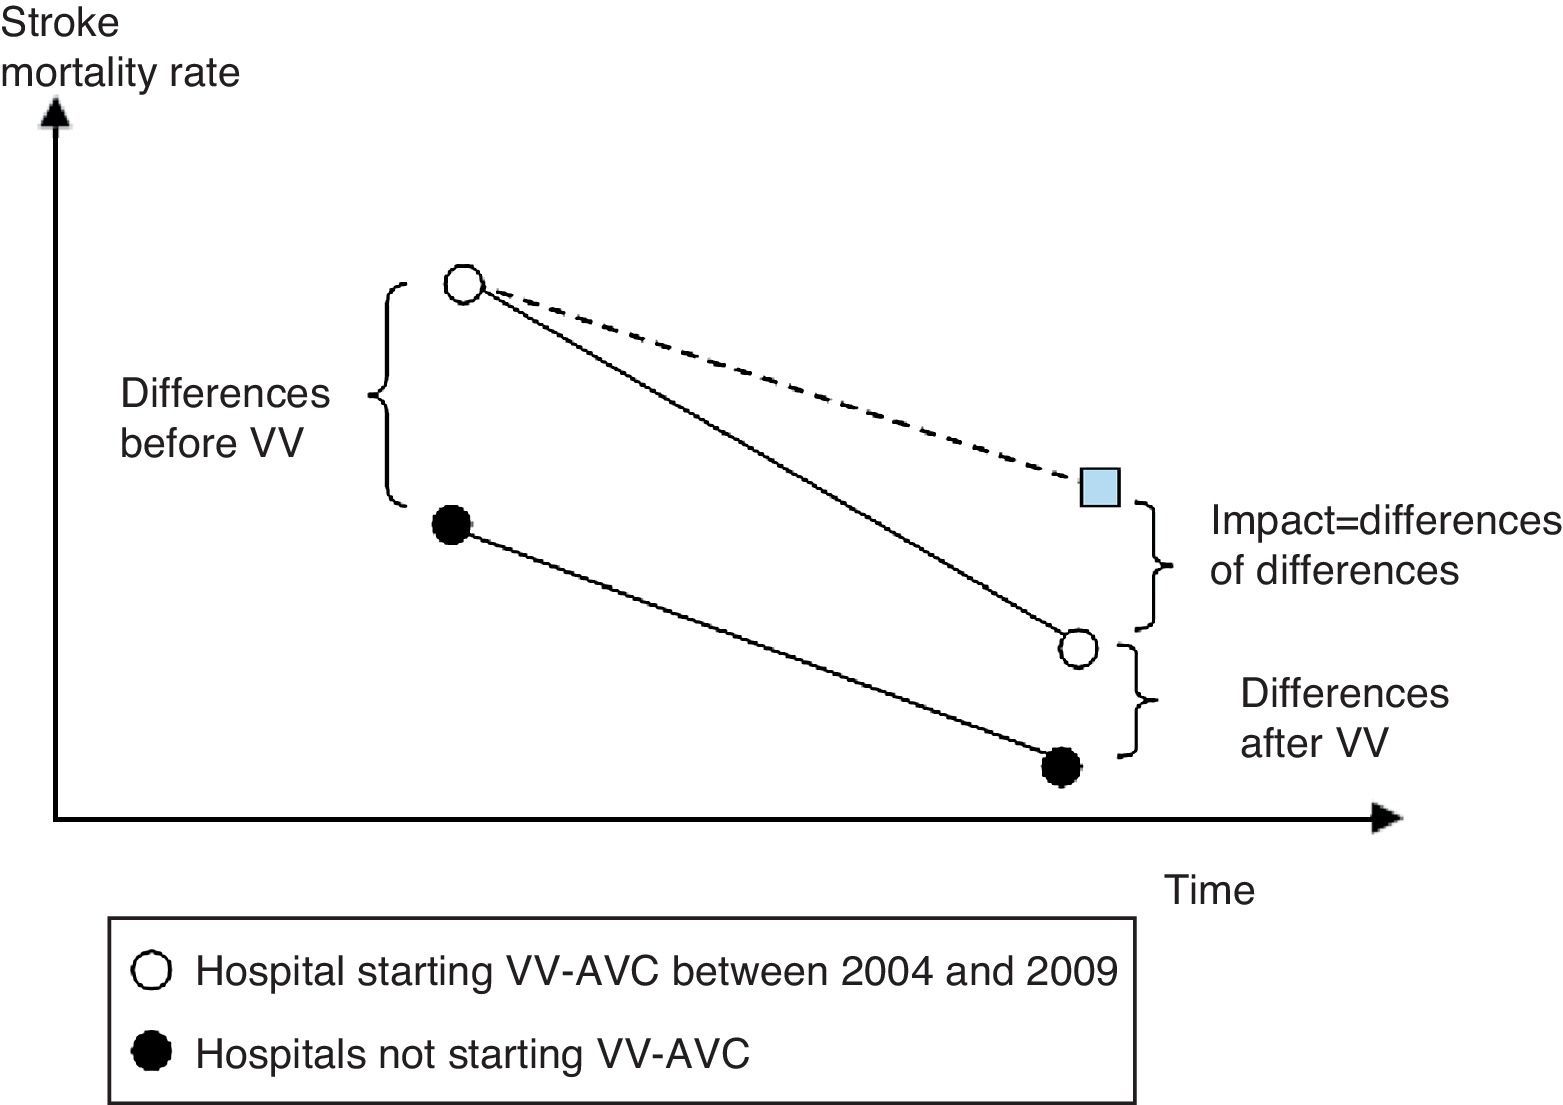
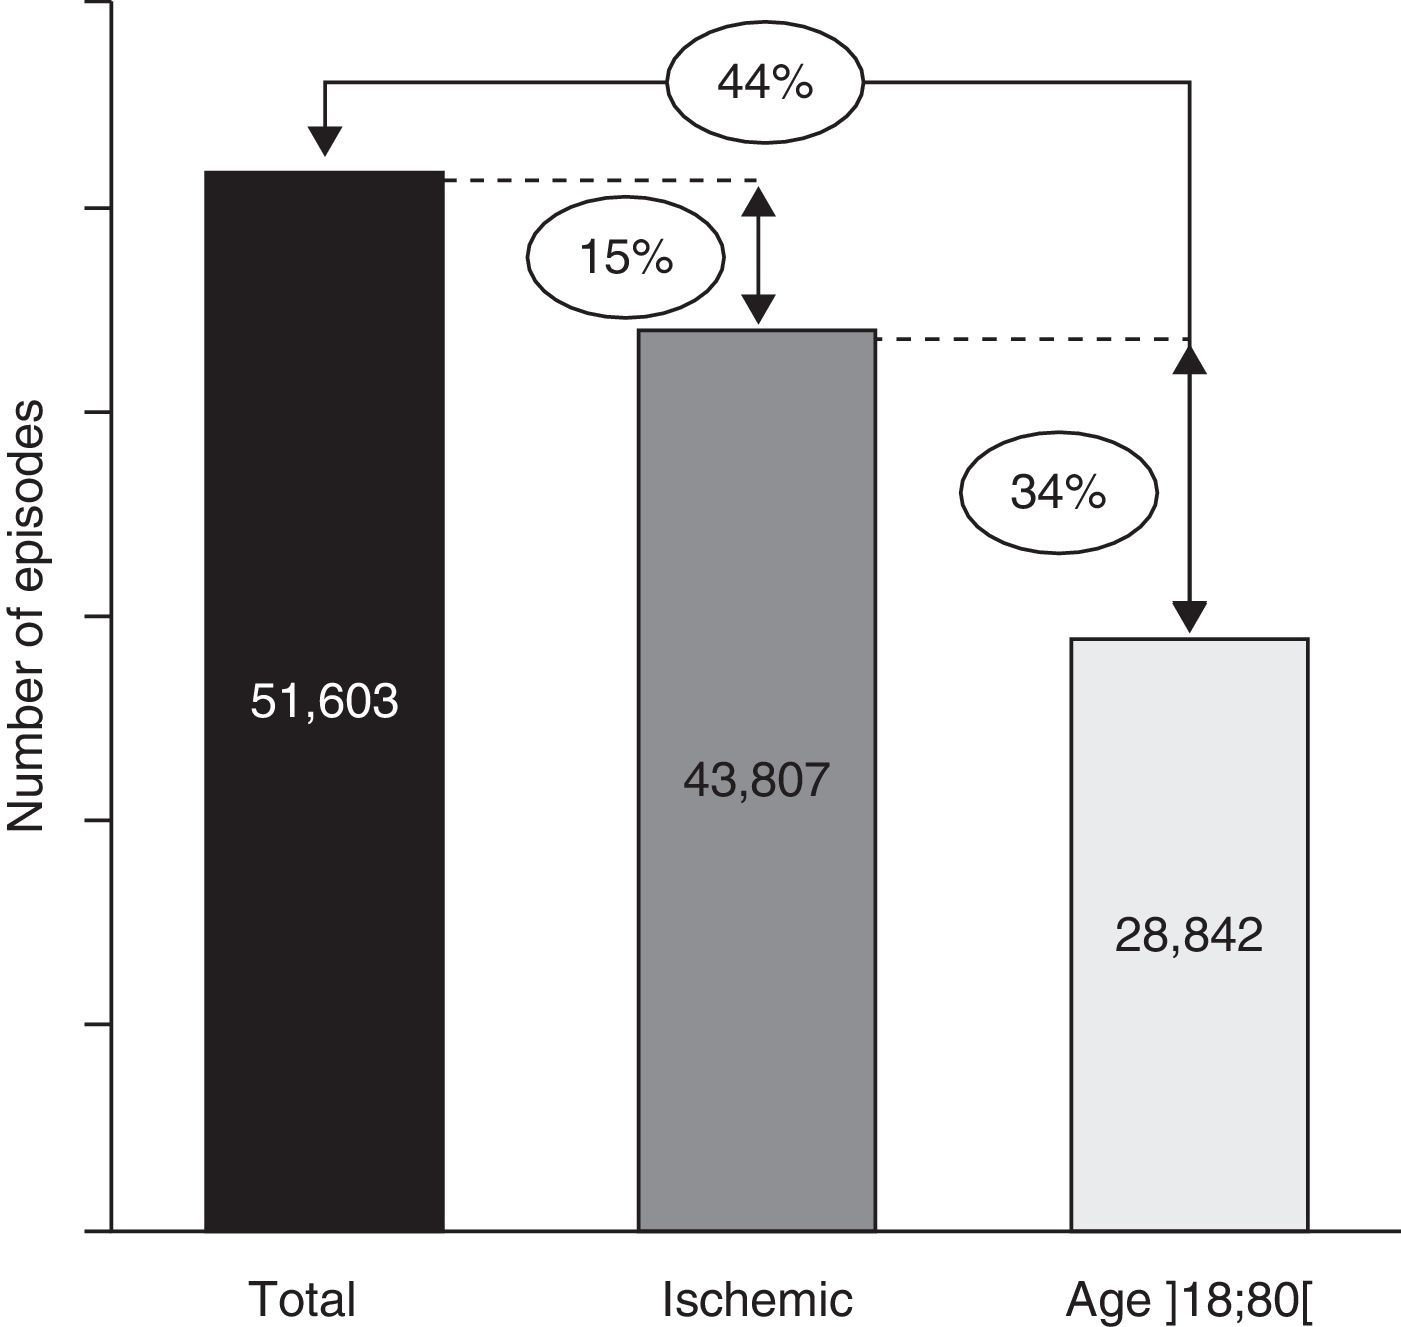
After selecting episodes from the DRG database, the data were composed of 51.603 observations. By excluding hemorrhagic stroke the sample suffered a 15% reduction. Moreover, when data were restricted even further, in order to contain only those cases which met the age criteria of the program, only 28.837 episodes were eligible to the activation of “VV-AVC” – which represents 56% of the total number of stroke episodes during the period of 2004–2009 (Fig. 2). In terms of age distribution, there is a clear dominance of episodes in patients with ages between 60 and 90 years old, as shown in Fig. 3.

.")
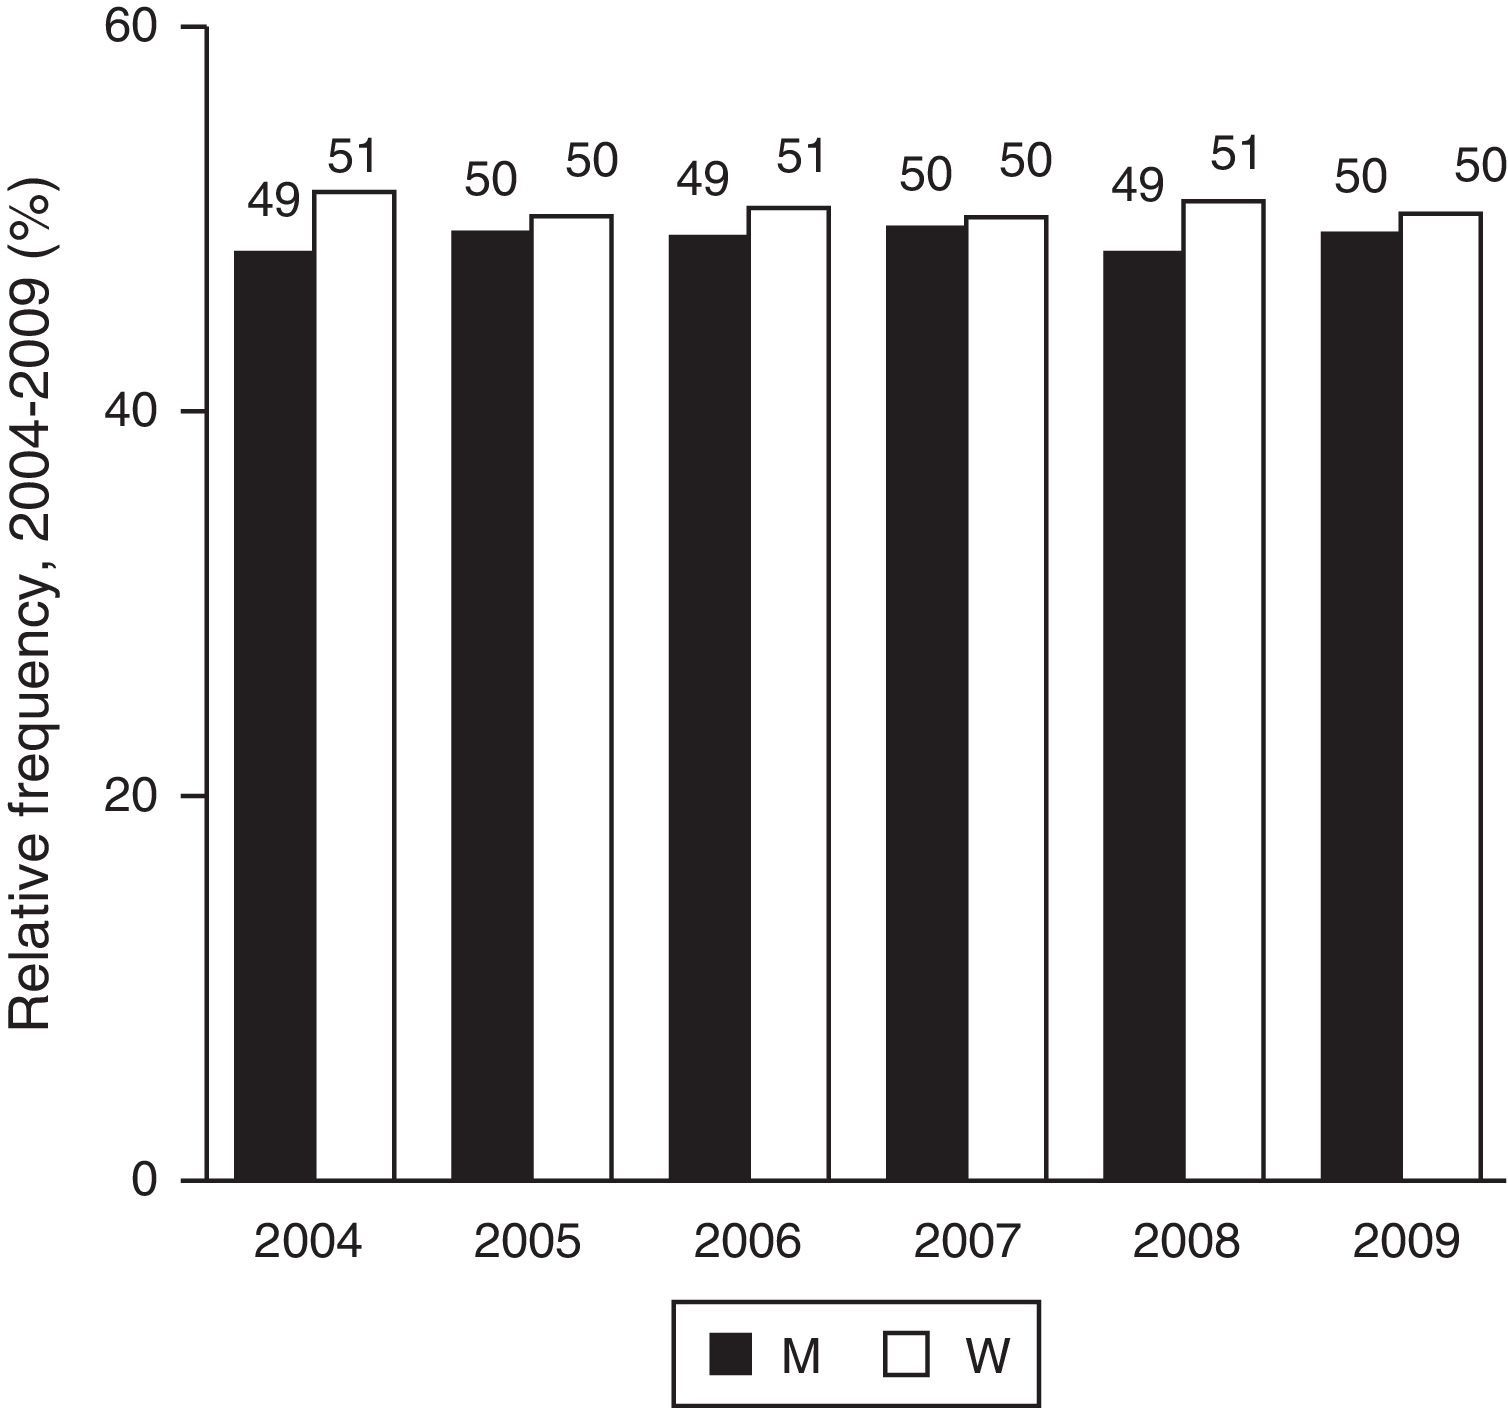
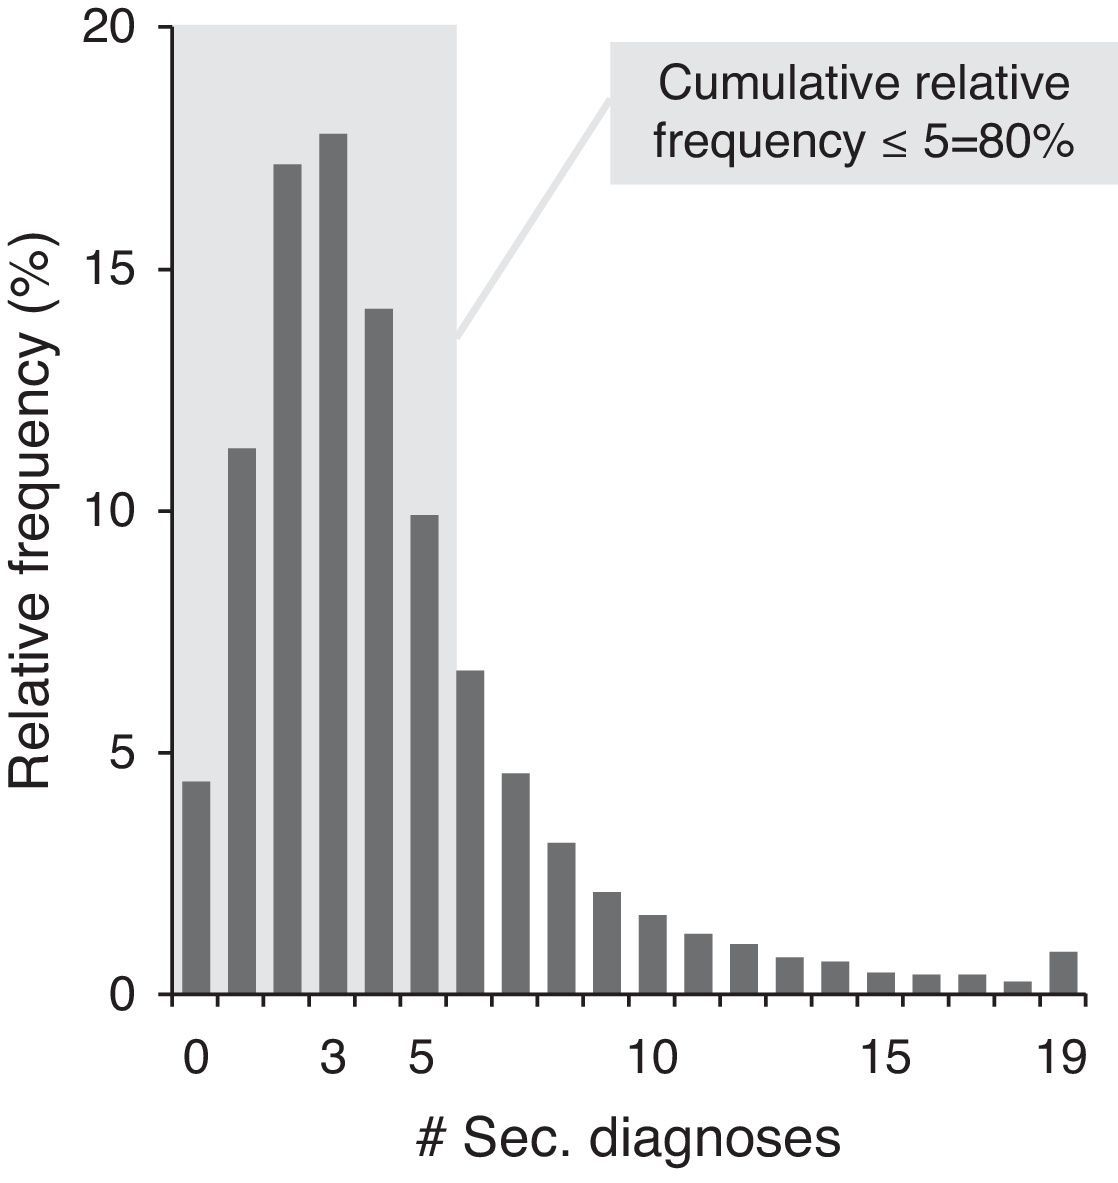
When gender is considered without age restrictions, the incidence of stroke is similar for men and women (Fig. 4), and this characteristic holds over time. For stroke patients, the modal number of diagnoses other than stroke is 3, and almost 80% have 5 or less secondary diagnosis (Fig. 5).
Descriptive statistics.")

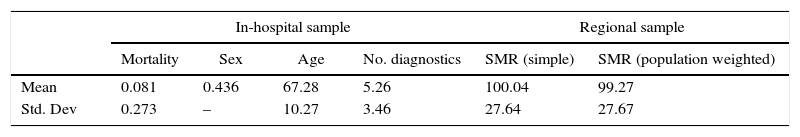
For the in-hospital sample, as described in Table 5, mortality rates of stroke patients aged between 18 and 80 are around 8%, with a standard deviation of approximately 3%. In terms of patient characterization, 56% of them are men, and their age is 67±10. Moreover, patients arrive at the hospital with an average of about 5 diagnoses.
Descriptive statistics of data.
| In-hospital sample | Regional sample | |||||
|---|---|---|---|---|---|---|
| Mortality | Sex | Age | No. diagnostics | SMR (simple) | SMR (population weighted) | |
| Mean | 0.081 | 0.436 | 67.28 | 5.26 | 100.04 | 99.27 |
| Std. Dev | 0.273 | – | 10.27 | 3.46 | 27.64 | 27.67 |
SMR – standardized mortality rate; sex=0 (male) 1 (female); No. diagnostics – number of diagnosis for each episode in the DRG database.
When analyzing regional data, statistics show that the standard mortality rate in the North region is approximately 100/100.000 inhabitants, but when the ratio is weighted by the population, it decreases slightly – which means that the mortality rate in the most populated subregions is lower than average.
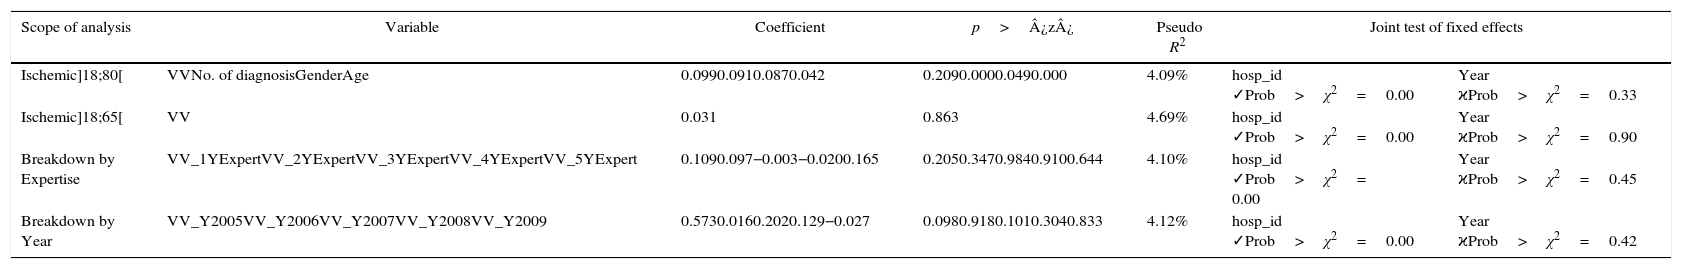
Regression analysisThe results of the regressions performed can be seen in Table 6. When considering the impact of the program on the base case (ischemic stroke patients with age above 18 and below 80 years old) as well as the restricted group (aged between 18 and 65), measured by a single VV variable, there is no statistical evidence of impact of VV-AVC on mortality.
The impact of Via verde do AVC: results of in-hospital analysis.
| Scope of analysis | Variable | Coefficient | p>¿z¿ | Pseudo R2 | Joint test of fixed effects | |
|---|---|---|---|---|---|---|
| Ischemic]18;80[ | VVNo. of diagnosisGenderAge | 0.0990.0910.0870.042 | 0.2090.0000.0490.000 | 4.09% | hosp_id ✓Prob>χ2=0.00 | Year ϰProb>χ2=0.33 |
| Ischemic]18;65[ | VV | 0.031 | 0.863 | 4.69% | hosp_id ✓Prob>χ2=0.00 | Year ϰProb>χ2=0.90 |
| Breakdown by Expertise | VV_1YExpertVV_2YExpertVV_3YExpertVV_4YExpertVV_5YExpert | 0.1090.097−0.003−0.0200.165 | 0.2050.3470.9840.9100.644 | 4.10% | hosp_id ✓Prob>χ2= 0.00 | Year ϰProb>χ2=0.45 |
| Breakdown by Year | VV_Y2005VV_Y2006VV_Y2007VV_Y2008VV_Y2009 | 0.5730.0160.2020.129−0.027 | 0.0980.9180.1010.3040.833 | 4.12% | hosp_id ✓Prob>χ2=0.00 | Year ϰProb>χ2=0.42 |
Using the breakdown of the intervention variable by expertise, as well as the breakdown by year, the results obtained show similar conclusions: there is no statistically significant decrease in mortality of ischemic stroke patients captured in any of the dummy variables.
On the other hand, the impact of the number of diagnoses and age on mortality is highly significant in all regressions (although only presented in the base-case) – the larger the number of diagnosis or the older the patient, the higher the probability of death; gender varies between borderline significant (p-value=0.049) and non-significant, but always with a positive bias – which translates in a higher propensity for women to die in case of stroke.
In all of these approaches, the vector of hospital dummies are jointly significantly (p>χ2=0.00%), while there is no statistical evidence that time has contributed for a shift on stroke mortality (p>χ2 around 40% for age]18;80[and higher than 90% for age]18;65[).
A measure of the explanatory power of these analyses (the pseudo R2) is around 4%.
In conclusion, based on these analyses, it is not possible to conclude that the program was able to improve the health status of stroke patients through the decrease of in-hospital mortality, even if the impact is broken down by degree of expertise or year of observation.
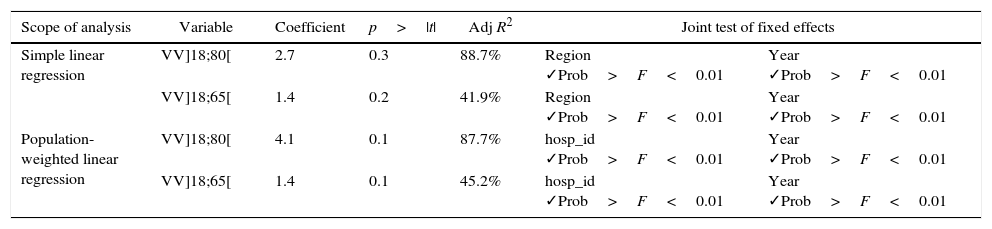
The results of the regional analysis are on display in Table 7. According to the results obtained in both approaches (simple, and population-weighted), both for age upper-limit of 80 and 65, once again, there is no statistical evidence that the existence of ‘VV-AVC’ in the regions translates into lower mortality for stroke patients (p-values ranging from 10% to 30%).
The Impact of Via verde do AVC: results of regional analysis.
| Scope of analysis | Variable | Coefficient | p>|t| | Adj R2 | Joint test of fixed effects | |
|---|---|---|---|---|---|---|
| Simple linear regression | VV]18;80[ | 2.7 | 0.3 | 88.7% | Region ✓Prob>F<0.01 | Year ✓Prob>F<0.01 |
| VV]18;65[ | 1.4 | 0.2 | 41.9% | Region ✓Prob>F<0.01 | Year ✓Prob>F<0.01 | |
| Population-weighted linear regression | VV]18;80[ | 4.1 | 0.1 | 87.7% | hosp_id ✓Prob>F<0.01 | Year ✓Prob>F<0.01 |
| VV]18;65[ | 1.4 | 0.1 | 45.2% | hosp_id ✓Prob>F<0.01 | Year ✓Prob>F<0.01 | |
On the other hand, there are large differences among regions and throughout the years, since the joint tests show that the respective coefficients are statistically different from zero (p>F=0.00%).
Program's limitations that might explain the results obtainedGiven the fact that none of the analysis performed showed significant effectiveness of the program VV-AVC in reducing mortality, it is relevant to focus on the program's design and implementation strategy, in order to better understand the possible causes that are limiting its success.
Promotion and reachThe trigger of the process is a call to the emergency services at the occurrence of a stroke episode. In this sense, informative campaigns to increase the population's awareness are critical for the success of the program. However, in Portugal, the program has not been heavily promoted and many people might be still not aware of its existence.
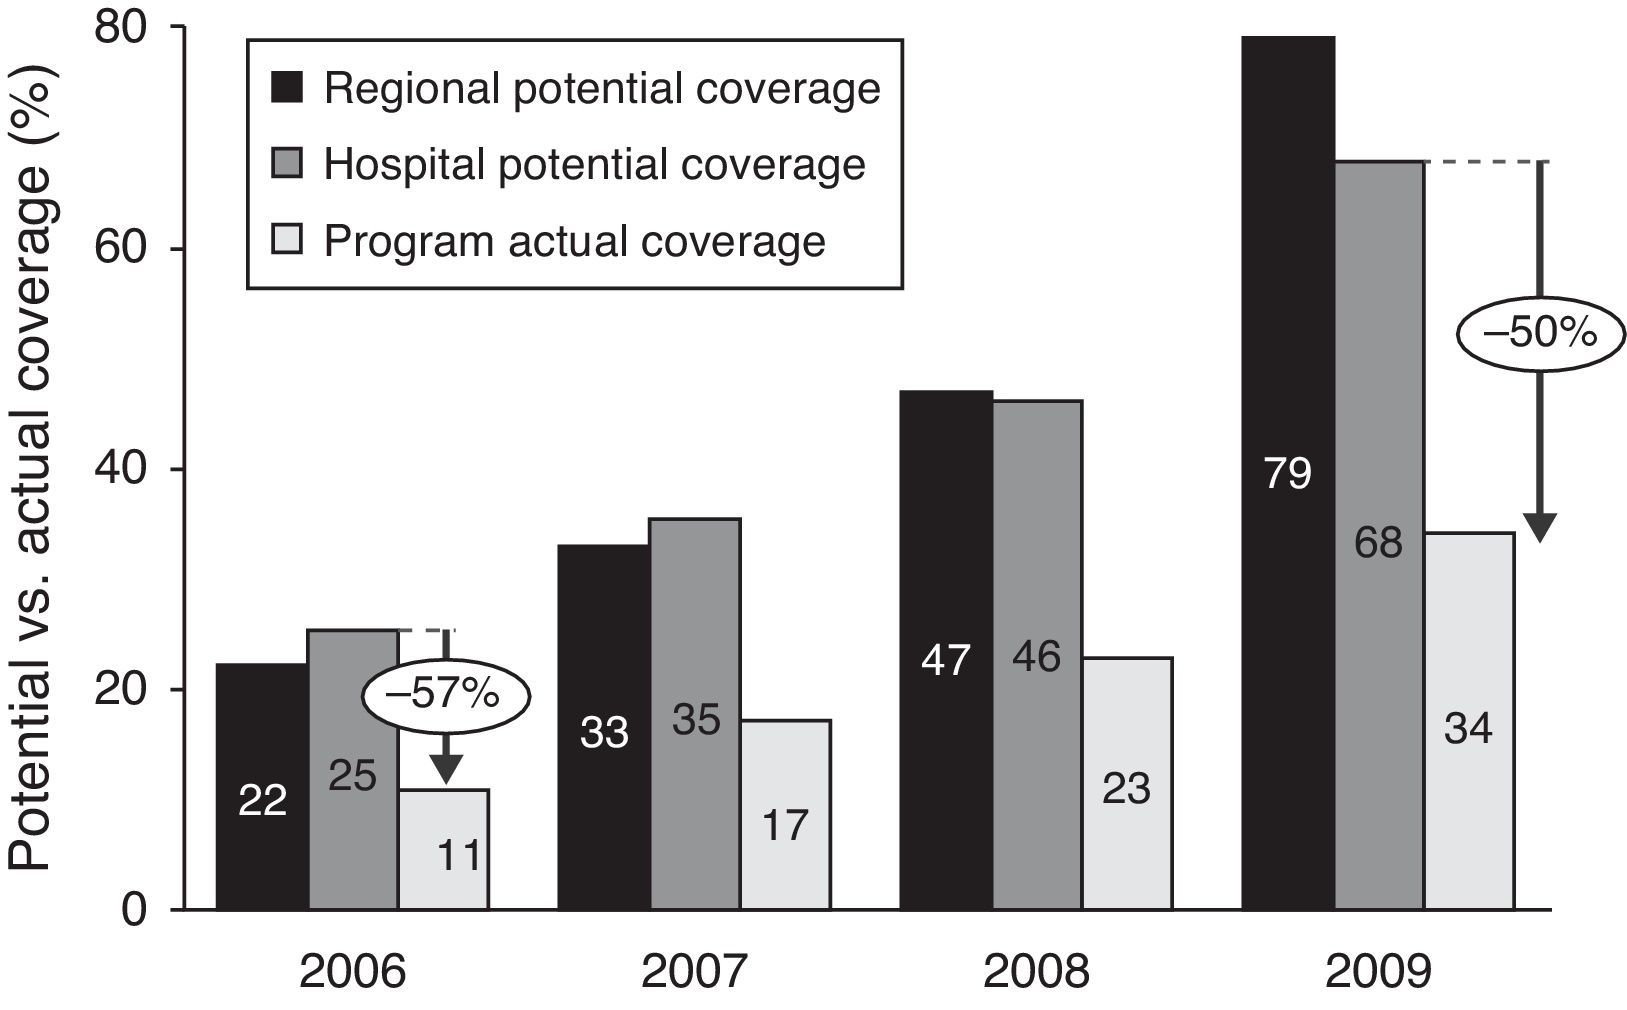
Indeed, when considering the North region (the one with the largest adherence rates, based on official reports on the topic,19 and through time, as more hospitals implement the program, the population covered increases dramatically from 25% to around 70% (“hospital potential coverage”, the ratio of stroke patients in hospitals with VV-AVC and total stroke patients in hospitals in the region). However, the percentage of patients who are actually using it (“program actual coverage”, percentage of total stroke patients in the region treated with rt-PA) – although increasing at a similar rate –, is only about half of the potential number of episodes that could have used the program (Fig. 6).

Program's reach. Sources: .20,21,19
Based on this figures, it is possible to argue that it is not enough to create more infrastructures to tackle the problem: it is also critical to involve the population on this program, to make it aware of its existence and thus, to translate potential impact into actual impact.
Training and expertiseIn order to achieve the best outcomes possible, it is important that everybody involved in the process is fully capable and knowledgeable about it. So, training should be continuously implemented.4
However, when considering data on the time elapsed since the beginning of symptoms until arrival to the hospital (“onset-to-door”), not much improvement has been achieved since the implementation of the program, and approximately 50% of the patients transported by INEM take longer than 1 hour to arrive at the hospital.22
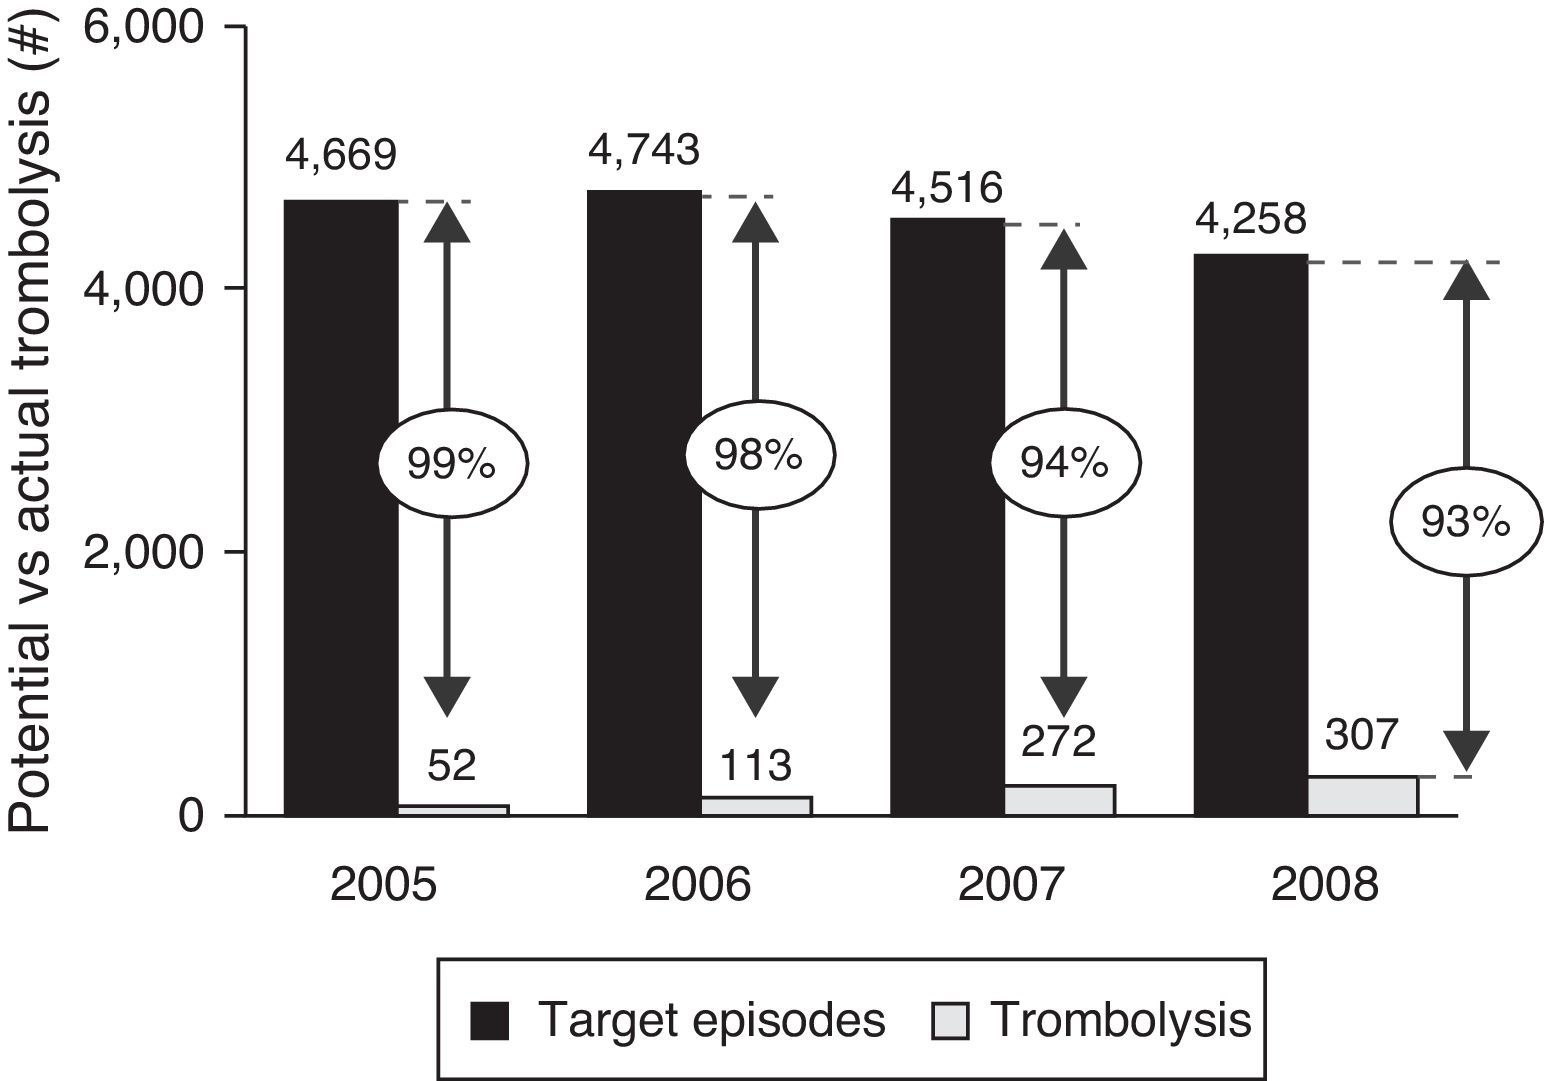
Along with this goes the fact that, of all the episodes that meet the program's requirements (ischemic stroke patients with age between 18 and 80), only a small fraction has been treated with rt-PA (from 1% in 2005 to 7% in 2008), which means that the ultimate purpose of the program (providing the stroke patients with trombolitic treatment) is rarely achieved and only a small fraction of the target population is actually benefiting from the process in full (Fig. 7).

Trombolosis rate. Sources: .21,23
Another relevant stage of the stroke process is post-hospital care. As mentioned before, many countries have adopted programs that include rehabilitation treatment, in order to improve the patients health conditions and their functional status, since many of those who survive are still limited in their physical conditions.
In Portugal, in particular, although there is the intention to include this stage in the process, there is not much information concerning its actual implementation and monitoring. Also, there is no systematic track of the patients’ health status after hospital discharge, and thus, no information on its evolution over time.
For this reason, and now that the pre- and intra-hospital stages are already implemented, it would be important to focus on this issue and to develop mechanisms that would allow stroke patients to have comprehensive access to post-hospital health care services, thus maximizing the program's reach throughout the whole process of stroke treatment.
ConclusionsSince the program's implementation in 2005 until nowadays, data have shown a sharp and steady decrease of stroke mortality in Portugal. However, according to the analysis performed, considering both in-hospital observations, as well as population-level data, there is no statistical evidence that such a decrease is related to the implementation of ‘Via verde do AVC’.
In an attempt to understand the reason for this result, some possible explanations were presented. First of all, the efforts on promotion and information campaigns about the program might have not been enough to reach as many people as it would be possible and desirable. Second, there is still a very small fraction of the target population being treated with rt-PA drugs. Finally, the poor implementation of post-hospital care might further limit the results of the overall program.
The analysis itself also has some limitations: as it focuses on few regions, it is not possible to reach nationwide conclusions; and in the regional analysis, it was not possible to fully match the sample with the program's requirements (stroke category and age groups).
In short, although the results obtained do not show a very positive picture, they bring to light some important insights of what can be done differently. In this sense, this work should be interpreted as a driving force to continuously strive for the development of better and more effective mechanisms, in which resources are properly allocated and used – afterall, “Improvement” is a never-ending process.
Conflicts of interestThe authors have no conflicts of interest to declare.
This paper has benefited from comments and suggestions by Margarida Borges.