


The main objective of this paper is to study the capital structure determinants of SMEs in the footwear industry and their indebtedness. Using panel data methodology and considering a sample of 70 firms we study the capital structure determinants between 2010 and 2013. The paper examines the indebtedness level in light of the two main theories – the Trade-off theory and the Pecking Order theory and we chose the footwear sector because of its importance in the Portuguese economy. In addition to total indebtedness we extend the literature by analyzing the differences between short-term and long-term indebtedness and the impact of the presence in foreign markets on debt structure. The results suggest that profitability, growth, total liquidity, risk and presence in foreign markets are key factors affecting the capital structure of footwear firms and that Pecking Order theory seems more suited to those firms.
Small and medium enterprises (SMEs) are commonly referred to as the backbone of any economy and one of the main problems reported by Portuguese SMEs is how to finance their activity, being largely dependent on banks. Nevertheless, following Basel III regulations, banks need to better scrutinize their lending activity in order to compute minimum capital requirements which, allied to the economic slowdown and the need to deleverage, lead banks to reduce their lending activity, in particular toward SMEs. Thus, SMEs’ capital structure is strongly affected by that factor. SMEs play a critical role in the global economy, as suppliers of employment and key agents for local and regional communities’ well-being and the role of these firms ultimately depends on the flexibility they have to undertake entrepreneurial strategies and promote innovation.
The objective of this paper is to study the capital structure determinants of the Portuguese footwear sector SMEs and the way those determinants could influence their indebtedness levels. The footwear sector has hardly been researched in terms of capital structure, so we extend the literature by analyzing the determinants of short and long-term indebtedness from a selected sample of footwear firms, covering the period from 2010 to 2013. Also, our paper extends the literature since it is focused on SMEs belonging to the Portuguese footwear sector and examines the link between internationalization and debt structure.
The next section presents an introduction to this issue and a literature review, discussing the importance of SMEs in the overall economy and the reasons to study the footwear sector. Section three presents the hypothesis to be tested. The following sections present the data and methodology used and the results, with the final section presenting a discussion about the results and some concluding remarks.
2Relevant literature and reasons to study the footwear sector2.1Capital structure theoryCapital structure theory had its debut with Modigliani and Miller (1958) which developed a theoretical model concluding that a firm's capital structure is irrelevant to its value, asserting that a firm consists of a set of assets representing a certain capacity to generate returns, at a certain risk that determines the cost of capital.
In a later approach, Modigliani and Miller (1963) acknowledged that their previous model was based on a set of unrealistic assumptions, considering now the effect of taxes and the risk of leverage on capital structure. The introduction of the tax effect, which originated the development of the Trade-off theory of capital structure, had implications on the determination of the firm market value. That is, indebtedness brings a tax benefit that allows the firm to increase its value because interest paid is deductible. The approach made by Modigliani and Miller (1963) about the importance of indebtedness on the firm capital structure allowed an approximation to a traditional view. If for the authors the effect was essentially the result of the maximization of tax profits generated by the usage of debt capital, for the traditionalists it was the result of financial leverage. So, Modigliani and Miller (1963) explained that the maximization of the firm value occurs when assets are totally financed by debt, ceteris paribus.
DeAngelo and Masulis (1980) included the effect of other tax benefits besides debt in the firm's capital structure analysis and held that the tax advantage given by debt is limited, considering the model from Miller (1977) as unrealistic and excessively sensitive to changes in tax laws. Also, according to Myers (1984), as the firm increases its indebtedness it also increases its tax benefits and financial difficulties, so that the firm has to find a point of indebtedness that maximizes its value. According to the model from Myers (1984), the indebtedness level is limited by the costs of an eventual financial difficulty, that is, the market value of the firm is an increasing function of the tax benefits generated by indebtedness until a point where doubts begin to be raised concerning the firm's financial health and bankruptcy costs begin to be high.
Jensen and Meckling (1976) provided a relevant contribution to the capital structure theme with the agency costs theory, discussing the tax effects and the risk of leverage. These authors depart from the agency relationship, that is, when someone is brought in to manage then other costs could arise. Those costs result from a conflict between shareholders and managers, mainly because managers could act according to their personal interests, possibly manipulating and hiding relevant financial and strategic information from shareholders, instead of trying to maximize firm value.
Jensen (1986) observed that these situations occur when there are excessive free cash flows, that is, there is available cash after financing all the projects, thereby increasing manager's tendency to spend the available resources in sumptuary goods or projects that will not reward the invested capital. Ross, Westerfield, Jaffe, and Jordan (2011) found that the behavior of shareholders and the risks incurred by the debt owners can prevent greater financial leverage. When a firm uses capital from third parties conflicts arise between shareholders and creditors, those conflicts are aggravated when the firm goes through greater financial difficulties. Myers and Majluf (1984) found that managers possess information that it is not known by the market, due to the fact that insiders have information about the firm's investment opportunities that is unknown to external investors.
The controversies around the Trade-off Theory lead to the development of the Pecking Order theory which had its roots in papers from Myers and Majluf (1984) and Myers (1977, 1984). This theory of capital structure was the result of the presence of asymmetrical information between “inside” managers and “outside” investors, asserting that the firm should use leverage to finance established assets and stocks to finance new growth opportunities.
Myers and Majluf (1984) state that the Pecking Order theory consists of a hierarchical sequence of financing decisions, that is, firms first use internally generated (self-financing) funds to finance their investments, only resorting to external financing when those funds are not enough, first preferring loans and then stock issuance. According to Myers (1984), firms prefer internal financial resources, adjusting their dividend policies to their investment opportunities, with the objective to avoid sudden changes in dividend payments.
According to Myers (1984), firms with a higher capacity to generate results have lower levels of debt capital, not because of a policy of low indebtedness but because they do not need to resort to external resources. On the contrary, unprofitable firms tend to issue debt because the ability to generate funds internally is not sufficient to meet their investments (Rajan & Zingales, 1995).
2.2Why study the footwear sector?In spite of the harsh economic situation, with the intensification of the euro zone sovereign debt crisis, in 2013 SMEs maintained their position as the backbone of the European economy.1 Representing over 99% of all firms, which corresponds to about 21.6 million firms, SMEs employ approximately 88.8 million people and are responsible for almost 60% of the privately generated Gross Value Added (GVA) in Europe. Also, 2 in every 3 European employees work in a SME (European Commission, 2014).
In Portugal, according to the National Statistics Office (INE, 2014), SMEs are the main drivers of employment creation and are recognized as a pillar of the national economy. In 2012, and according to INE, 99.9% of the firms were SMEs, 95.9% of which were micro-firms. Although large firms are responsible for over 40% of the turnover and GVA, SMEs account for about 78% of employment. Compared with the previous year we observe reductions of 6.5%, 7.9% and 9.9% in terms of number of firms, employment and turnover, respectively.
Empirical studies on factors influencing capital structure have shown that industry classification could be a relevant factor (Hall, Hutchinson, & Michaelas, 2000; Kayo & Kimura, 2010; Ross et al., 2011). Most empirical studies of financial structure have been done using samples without differentiating the sectors to which the firms pertained. With that approach, the specific characteristics of the different sectors are diluted, so it is better to study a particular sector in order to control possible idiosyncrasies. Other field of research uses structured questionnaires instead of financial data in order to investigate financing preferences of small firms (e.g., Michaelas, Chittenden, & Poutziouris, 1998 or Daskalakis, Jarvis, & Schizas, 2013).
In this paper, instead of using a representative sample and differentiating between sectors of activity, we choose to use a selected sample due to the relative importance of the footwear sector. According to APICCAPS (2013) and BdP (2012), the Portuguese footwear sector (CAE 152 Rev. 3) represents 4% of the total number of manufacturing firms, of which 99.5% are SMEs, and of those roughly 48% are micro enterprises. SMEs employ 83% of the sector total and are responsible for 82% of the turnover. The sectors’ exports represent 64% of its turnover, a factor that accounts for the recent growth registered by the sector. Exports in 2014 attained the value of 1850M€ (representing roughly 4% of the total value of goods exported by the Portuguese economy) and, in cumulative terms, exports value grew 43% in the last four years. Finally, the sector presents better average data in terms of EBITDA, ROE and financial autonomy than the global manufacturing firms, though presenting a greater dependence on trade credits and bank lending.
Strongly concentrated in the northern region of Portugal, the footwear industry is highly competitive, invests heavily in innovation and depends crucially on foreign markets. These factors can influence the relationship between the level of indebtedness and some of the explanatory variables. As stated by Acedo, Ayala, and Rodríguez (2013, p. 159), footwear firms’ survival and success calls for a balanced financial structure that provides the necessary funds at the lowest possible cost. Although capital structure determinants are well documented, there are very few papers about the capital structure of firms in the footwear industry. Some notable exceptions are Acedo and Rodríguez (2003) and Acedo et al. (2013). Acedo and Rodríguez (2003), using an analysis of variance, studied the debt level of the footwear industry in the autonomous region of La Rioja, in Spain. Acedo et al. (2013) applied a panel data methodology to a sample of Spanish SMEs, showing that debt level has an inverse relationship with non-debt tax shield and a direct relationship with investment in fixed assets, supporting the Trade-off theory. However, the positive coefficient of debt cost, age and cash flows is consistent with the prediction of the Pecking Order theory.
With respect to Portuguese firms in general, there are still few papers published using firm-level financial data to study the capital structure determinants of SMEs (some examples are Antão & Bonfim, 2012; Bartholdy & Mateus, 2011; Gama, 2000; Matias, Baptista, & Salsa, 2015; Nunes & Serrasqueiro, 2007; Pastor & Gama, 2013; Ramalho & Silva, 2009, 2013; Serrasqueiro & Caetano, 2015; Serrasqueiro & Nunes, 2011, 2012; Serrasqueiro & Rogão, 2009; Vieira & Novo, 2010). To the best of our knowledge the Portuguese footwear sector has never been the object of such a study, a factor which motivates the present research.
3Capital structure determinantsThe main theories that support the capital structure determinants are the Pecking Order and the Trade-off theories. Our hypothesis will be formulated according to the principles underlying those two theories in order to achieve a homogeneous exposure of the hypothesis to be tested, though different empirical works present some conflicting results.
The hypotheses to be tested are the following:H1 Profitability is negatively related to indebtedness, ceteris paribus.
According to the Trade-off theory more profitable firms should use more leverage in order to benefit from the interest tax deduction (Modigliani & Miller, 1963), thus suggesting a positive relationship between profitability and indebtedness because firms with a greater capability to create and maintain results have a greater negotiation power and thus should be more attractive when resorting to external financing (Harris & Raviv, 1991). On the contrary, Pecking Order theory assumes that when firms need to finance, their investments have a hierarchic preference when choosing financing sources. Accumulated results are used first, then third party resources, then indebtedness and, lastly, the issuance of new stocks. More profitable firms will have better conditions to self-finance and a lower need to raise debt (Myers, 1984; Myers & Majluf, 1984), so that the Pecking Order theory predicts a negative relationship between indebtedness and profitability. SMEs resort mostly to Pecking Order theory since agency conflicts between managers and shareholders are less relevant (Degryse, Goeij, & Kappert, 2012). In our study, the hypothesis is based on Pecking Order theory and we expect to obtain a negative relationship between firms’ profitability and indebtedness, like those found in the empirical studies of Antão and Bonfim (2012), Bastos and Nakamura (2009), Degryse et al. (2012), Serrasqueiro and Nunes (2011), Vieira and Novo (2010) and Mateev, Poutziouris, and Ivanov (2013).H1.1 Profitability is negatively related with short-term indebtedness, ceteris paribus. Profitability is negatively related to long-term indebtedness, ceteris paribus.
Short-term and long-tem indebtedness can be distinctively affected by profitability. Abor and Biekpe (2009) show that profitability is mainly negatively related with long-term debt, but concluded that it is also related with short-term debt. To Michaelas, Chittenden, and Poutziouris (1999), the effect of profitability on long-tem indebtedness is more relevant than on short-term indebtedness. Those authors argue that when SMEs have sufficient internal resources, resorting to long-term debt decreases, choosing short-term financing instead. That supports the SMEs’ preference for current liabilities, and the footwear firms are no exception.H2 Assets tangibility is positively related to indebtedness, ceteris paribus.
According to the Trade-off theory there is a positive relationship between asset tangibility and indebtedness, where the greater the tangible asset value the greater the indebtedness level, because those act as collateral in case the firm enters a bankruptcy process (Harris & Raviv, 1991; Michaelas et al., 1999; Rajan & Zingales, 1995). The existence of collateral reduces agency costs and the problems of information asymmetry (Degryse et al., 2012; Jensen & Meckling, 1976; Jensen, 1986; Ross et al., 2011). Pecking Order theory also predicts a positive association, because firms which have collateral make their creditors feel more comfortable financing their investments and their financial costs are also lower (Myers & Majluf, 1984). Abor and Biekpe (2009) observed that SMEs with lower asset value tend to have more difficulties in access to financing. Also Vieira, Pinho, and Oliveira (2013) found that asset value positively influences the level of indebtedness, concluding that the higher the asset value, the higher would be the level of credit granted. Thus, since assets are accepted as collateral, a positive relationship between assets tangibility and indebtedness is expected. However, Serrasqueiro and Nunes (2011) and Vieira and Novo (2010), concluded that there is a negative relationship between tangible assets and leverage.H2.1 Assets tangibility is negatively related with short-term indebtedness, ceteris paribus. Assets tangibility is positively related with long-term indebtedness, ceteris paribus.
Tangible assets, as mentioned earlier, can affect long and short-term financing differently (Hall et al., 2000; Mateev et al., 2013). Brito, Corrar, and Batistela (2007) found a negative relationship for short-term debt and a positive relationship for long-term debt. However, the relationship between permanent assets and total debt was negative, which goes against expectations. Thus, firms with higher assets tangibility have lower levels of financing but are more indebted in the long-term than in the short-term. Also, Michaelas et al. (1999) and Vieira and Novo (2010) found a negative relationship to short-term indebtedness and a positive relationship for the long-term. Despite that, in the paper by Vieira and Novo (2010), long-term debt was not statistically significant.H3 Growth is positively related to indebtedness, ceteris paribus.
Miller (1977) argued that firms with higher growth rates could not optimize their investments, possibly causing lenders to become unwilling to finance them. According to the Trade-off theory, access to finance would be more limited for these firms, with a negative relationship between growth and indebtedness (Jensen, 1986; Titman & Wessels, 1988). In contrast, the Pecking Order theory predicts a positive relationship between growth and debt, because firms with higher growth rates experience more financing needs. So, if their ability to generate and maintain internal funds becomes insufficient to meet their needs that will lead a firm to turn to external sources to finance its growth (Myers, 1984; Myers & Majluf, 1984). Ramalho and Silva (2013), who followed the Pecking Order hypothesis, considered that firms with higher growth rates rely more on debt capital, since they do not have sufficient internal funds for financing and want to avoid the costs of issuing new equity. Michaelas et al. (1999), Brito et al. (2007), Abor and Biekpe (2009), Vieira and Novo (2010) and Acedo et al. (2013), considered that growth is related with the asset or sales growth rates, thus expecting a positive effect on debt. In our paper the hypothesis rests on the assumptions of the Pecking Order theory.H3.1 Growth is positively related to short-term indebtedness, ceteris paribus. Growth is positively related to long-term indebtedness, ceteris paribus.
Abor and Biekpe (2009), confirming the Pecking Order theory, concluded that growth is positively related to long-term debt, since firms with higher growth rates need more external financing. However, financing opportunities could generate conflicts between managers and lenders, so to avoid these costs SMEs resort to short-term debt. For Brito et al. (2007) growth also showed a positive relationship with long-term and total debt. Finally, Michaelas et al. (1999) found a positive link between growth and short-term debt. Yet, Vieira and Novo (2010) did not obtain any statistically significant relationship.H4 Size is positively related to indebtedness, ceteris paribus.
The two main theories argue that there is a positive association between size and debt. According to the Trade-off theory, larger firms tend to be more diversified and have lower probability of bankruptcy (Ang, 1992; Cole, 2013; Titman & Wessels, 1988). Also, due to lower information asymmetry larger firms have easier access to capital markets and pay lower interest rates, thus having a greater incentive to increase their debt capital (Fama & French, 2007). There are several studies finding a positive relationship between size, given by the logarithm of total assets, and total debt, not only for larger firms but also for SMEs (Abor & Biekpe, 2009; Brito et al., 2007; Fama & French, 2007; Frank & Goyal, 2003, 2009; Michaelas et al., 1999; Vieira & Novo, 2010; Serrasqueiro & Nunes, 2011).H4.1 Size is negatively related to short-term indebtedness, ceteris paribus. Size is positively related to long-term indebtedness, ceteris paribus.
Hall et al. (2000), Bastos and Nakamura (2009), Degryse et al. (2012) and Mateev et al. (2013), reported that larger firms are more able to obtain long-term debt, due to their lower risk, lower probability of bankruptcy and lower financing costs. On the other hand, for short-term debt they found a negative relationship, indicating that smaller firms rely more on short-term debt since their internal funds are insufficient to finance growth. Michaelas et al. (1999) also concluded that there is a negative link between size and short-term financing, suggesting that smaller firms resort less to long-term debt due to the higher transaction costs they face. Brito et al. (2007) and Vieira and Novo (2010) found no significant relationship between size and short-term indebtedness, but instead found a positive effect for total and long-term debt.H5 Total liquidity is negatively related to short-term and long-term indebtedness, ceteris paribus.
Bastos and Nakamura (2009) confirmed the Pecking Order theory that predicts a negative relationship between liquidity and indebtedness. Payments are often financed by trade credit, which leads to increased current liabilities. Therefore, the most indebted firms have lower levels of cash (Acedo et al., 2013; Pastor & Gama, 2013). On the contrary, Mateev et al. (2013) argue that liquidity is positively related to short-term debt.H6 Other tax benefits besides debt are negatively related to indebtedness, ceteris paribus.
The Trade-off theory predicts a negative relationship between Other Tax Benefits (OTB) and indebtedness. DeAngelo and Masulis (1980) justified that correlation, arguing that firms with more depreciations and provisions should reduce the level of debt in their financial structure. Some empirical studies show a negative relationship between OTB and indebtedness (Acedo et al., 2013; Gama, 2000; Michaelas et al., 1999). However, Vieira and Novo (2010) found a negative relationship with short-term debt and a positive effect with long-term debt. On the contrary, Serrasqueiro and Nunes (2011) found no relationship between OTB and indebtedness.H7 Age is negatively related to indebtedness, ceteris paribus.
According to the Pecking Order Theory, firms increase their capability to retain resources throughout their lifecycle, reducing the need to resort to borrowing in order to finance their investment opportunities. Consequently, younger SMEs are more dependent on debt because retained earnings are not sufficient to meet their investment needs (Myers, 1984; Myers & Majluf, 1984). Following the Trade-off theory, older and more established firms have a greater tendency to choose safe investment projects, thus the expected relationship with debt should be positive (Cole, 2013; Hall et al., 2000). Abor and Biekpe (2009) concluded that age is a key factor in accessing finance, since more mature firms have more guarantees to offer banks if they cannot honor their obligations. Vieira and Novo (2010), Ramalho and Silva (2013) and Matias et al. (2015) found a negative relationship between the variables. According to these authors, older firms generate sufficient internal resources, and are not so dependent on indebtedness as younger firms. However, Vieira et al. (2013) found that the age variable did not yield significant results, concluding that indebtedness is not related to firm maturity.H7.1 Age is negatively related to short-term indebtedness, ceteris paribus. Age is positively related to long-term indebtedness, ceteris paribus.
In our paper, the hypotheses are based on the assumptions of the Pecking Order theory and we follow Serrasqueiro and Nunes (2012) and Vieira et al. (2013), where age is measured in years since the incorporation of each firm.H8 Risk is negatively related to indebtedness, ceteris paribus.
SMEs in the footwear sector are subject to considerable levels of risk due their dimension, dependence on export markets and need to constantly innovate and survive in a highly competitive market. Also, footwear firms are exposed to business risk due to their economic environment and management skills. According to the Trade-off theory, debt is negatively related to risk (Bastos & Nakamura, 2009; Serrasqueiro & Caetano, 2015). To Harris and Raviv (1991), agency costs and bankruptcy costs suggest that risk also influences the capital structure of firms. The Pecking Order theory also predicts a negative relationship between risk and indebtedness, since the greater the risk the greater the likelihood of the firm becoming insolvent. Therefore, risk reduces the firms’ capability to finance and increases their costs (Myers, 1984).
In Bastos and Nakamura (2009) long-term debt had a negative relationship with risk, though short-term debt presented a positive one. Brito et al. (2007) found a positive relationship between risk and debt, both in the long and short-term, which presumes that firms with higher risk are more indebted, thus contradicting the theory. On the other hand, Vieira and Novo (2010) found no statistically significant value for total debt, but obtained a positive relationship between risk and long-term debt, which is positive when bankruptcy costs are insignificant but negative when those costs gain considerable weight in the total costs of the firm. Concerning short-term debt they found a negative relationship.
Different indicators have been used to measure the risk variable. Several empirical studies present divergent results for the relationship between risk and indebtedness because it is difficult to define the parameters to measure that attribute since the costs of financial failure are difficult to estimate. In general, the risk of a firm is in the level of uncertainty regarding its future (Brito et al., 2007; Vieira & Novo, 2010). This study will measure the risk variable using financial ratios, allowing us to assess how the firm finances itself and manages its ability to fulfill its non-current commitments, and to determine the dependence of the firm toward third parties, namely using the following two ratios: Solvency Ratio (SOR) and Structure Ratio (STR). The solvency ratio aims to assess the firm's ability to fulfill its commitments, reflecting the risk that their lenders support, by comparing the levels of equity invested by the partners with the levels of debt capital applied by lenders. Obeying a principle of prudence, SOR should always have a value greater than or equal to one and should not have values lower than 0.5. The higher the SOR the lower is the risk and the firm will be more able to borrow. Thus, SOR should be positively related to indebtedness. Furthermore, STR is negatively associated with indebtedness because higher values for STR are associated with higher risk for the firm so that it will be less able to get financing.H9 Presence in outside markets is positively related to indebtedness, ceteris paribus.
International diversification leads to a lower volatility of earnings since the multinational firm has cash flows in imperfectly correlated markets. That leads to a reduction in bankruptcy risk and enables the firm to utilize more leverage in its capital structure (Shapiro, 2013). Thus, the more a firm exports, the more insurance from demand shocks it gets, and less liquidity constrained it should be. According to this, and in the light of the Trade-off theory, we should expect a positive relationship between international diversification and financial leverage. According to the Pecking Order theory, if exporting firms experience rapid growth, thus having more financing needs, there should also be a positive relationship between participation in export markets and leverage. In terms of empirical evidence, Shapiro (2013) corroborates this hypothesis, but Kwok and Reeb (2000) and Chkir and Cosset (2001) present different results.H9.1 Presence in markets outside the EU is negatively related to indebtedness, ceteris paribus. Presence in the EU market is positively related to indebtedness, ceteris paribus.
Specifically, in this paper we are going to test the “upstream-downstream” hypothesis (Kwok & Reeb, 2000), where firms that export to riskier markets (e.g., “downstream”, here meaning markets outside the European Union) have lower debt capacity. On the contrary, when firms export to safer markets (e.g., “upstream”, here meaning the EU market) its leverage increases due to the risk diversification. The presence in more or less riskier markets (ex-EU or EU markets) is proxied by dummy variables, where the cut-off values are, respectively, 10% and 70%, corresponding roughly to the sample average values for the ratios between exports (ex-EU and EU) and sales.
4Data and methodologyThe analysis of the capital structure in the footwear sector is relevant for the firm managers because of its influence on growth and profitability. In this paper we use a sample of SMEs from the footwear sector and besides analyzing the existence of differences between short-term and long-term indebtedness we extend the literature testing the impact of the presence in foreign markets on debt structure.
The dependent variables are total debt (total liabilities/total assets) and its subdivision in short-term and long-term debt (respectively, current liabilities/total assets and non-current liabilities/total assets) and the independent variables represent the firm's essential determinant factors of its capital structure and are used in order to test the previously stated hypothesis (Table 1).
Independent variables and expected signs.
| Hyp. | Acronym | Independent variables | Formula | Expected sign |
|---|---|---|---|---|
| H1 | ROA | Return on assets | EBIT/total assets | − |
| H2 | AT | Assets tangibility | (Non-current assets+inventories)/total assets | + |
| H3 | SG | Sales growth | (Sales (n)−sales (n−1))/sales (n−1) | + |
| AG | Assets growth | Assets (n)−assets (n−1)/assets (n−1) | + | |
| H4 | SZ | Dimension | Logarithm of total assets | + |
| H5 | TL | Total liquidity | Current assets/current liabilities | − |
| H6 | OTB | Other tax benefits besides debt | Depreciations/total assets | − |
| H7 | AGE | Age (reputation) | Number of years in activity | − |
| H8 | SOR | Solvency ratio | Equity/total liabilities | + |
| STR | Structure ratio | Non-current liabilities/equity | − | |
| H9 | XOE | Presence in markets outside EU | Exports to outside EU/total sales | − |
| XIE | Presence in the EU market | Exports to EU/total sales | + |
After the identification of the hypothesis to be tested as well as the dependent and independent variables, it is necessary to describe the data collection process for the sample characterization over which our empirical study will be made. Our objective is to analyze a sample of SMEs from the footwear sector, obtained from SABI, a financial database powered by Bureau van Dijk. Considering only footwear sector firms (CAE 152 Rev. 3), applying the criteria for SMEs definition, excluding firms with less than 10 employees - because micro firms tend to present gaps in terms of data – and considering only firms with a 4 year period of complete data from 2010 to 2013, we obtained a final sample of 70 firms. That sample accounts for 5993 employees, a turnover around 446M€ and total assets of 278M€ in 2013. The firm average age is 27 years (10 have more than 40 years) and the sample has more medium than small firms (54 and 16, respectively). Firms in the sample export 83% of their sales and, interestingly, in the considered period, firms increased only slightly the exports for EU countries in relation to sales, but significantly increased exports for markets outside the EU.
Before estimating the different models we present some descriptive statistics of the variables. As can be seen in Table 2, in recent years, the indebtedness levels decreased slightly and firms present an improvement in ROA, liquidity, solvency and structure ratios, though presenting decreasing levels of asset and sales growth. Notice also the greater relative weight of short-term debt, signaling the dependence of these firms on trade credits. Table 2 also presents the correlation coefficients between variables. According to Gujarati and Porter (2008), when the correlation coefficients are above 50%, the problem of collinearity becomes significant. Observing the correlation coefficients between the independent variables we see that they are always below 50%, therefore the problem of collinearity between explanatory variables will not be relevant.
Descriptive statistics (average and standard deviation) and correlation matrix between independent variables.
| n | n−3 | s.d. | ROA | AT | SG | AG | SZ | TL | OTB | AGE | SOR | STR | XOE | XIE | |
|---|---|---|---|---|---|---|---|---|---|---|---|---|---|---|---|
| TD | 0.66 | 0.70 | 0.14 | ||||||||||||
| LTD | 0.13 | 0.17 | 0.09 | ||||||||||||
| STD | 0.53 | 0.53 | 0.15 | ||||||||||||
| ROA (%) | 6.33 | 3.36 | 6.62 | 1 | −0.301 | 0.152 | 0.200 | −0.001 | 0.018 | 0.010 | −0.122 | 0.443 | −0.359 | 0.001 | 0.092 |
| AT | 0.47 | 0.48 | 0.18 | 1 | −0.193 | −0.332 | 0.118 | 0.028 | 0.025 | −0.033 | −0.025 | 0.227 | 0.183 | −0.111 | |
| SG (%) | 9.72 | 21.34 | 24.43 | 1 | 0.367 | −0.128 | −0.009 | 0.120 | −0.129 | −0.136 | −0.027 | 0.029 | −0.012 | ||
| AG (%) | 12.09 | 15.88 | 19.36 | 1 | 0.083 | −0.012 | −0.015 | −0.169 | −0.132 | 0.053 | −0.039 | −0.056 | |||
| SZ | 8.10 | 7.91 | 0.64 | 1 | −0.092 | −0.085 | 0.240 | −0.079 | 0.183 | −0.023 | 0.064 | ||||
| TL | 11.53 | 7.67 | 18.36 | 1 | 0.065 | −0.016 | 0.091 | −0.310 | −0.028 | 0.055 | |||||
| OTB | 0.04 | 0.04 | 0.03 | 1 | −0.065 | 0.032 | −0.119 | −0.032 | −0.022 | ||||||
| AGE | 27.41 | 24.41 | 14.26 | 1 | 0.241 | −0.134 | −0.178 | 0.083 | |||||||
| SOR | 0.63 | 0.49 | 0.43 | 1 | −0.480 | −0.122 | 0.008 | ||||||||
| STR | 0.54 | 0.70 | 0.54 | 1 | 0.096 | 0.009 | |||||||||
| XOE | 0.40 | 0.27 | 0.48 | 1 | −0.428 | ||||||||||
| XIE | 0.56 | 0.53 | 0.50 | 1 | |||||||||||
Note: n and n−3 are the average values, respectively, in 2013 and 2010. s.d. is the standard deviation.
In order to attain our research objective we apply a balanced panel data methodology, which presents several advantages, namely better effects’ detection and measurement, minimization in sample bias and control of individual heterogeneity (Gujarati & Porter, 2008). Panel data can be estimated trough three different regression models: pooled ordinary least squares (POLS), fixed effects model (FEM) and random effects model (REM). Applying the Wald, Breusch-Pagan and Hausman tests we will choose the most appropriate regression technique. First, comparing between POLS and FEM, the Wald test states the null hypothesis of the constant terms being all equal. Under the null hypothesis, the efficient estimator is the POLS model, indicating the non-existence of a specific effect for each one of the firms. After, the Breusch-Pagan test compares between POLS and REM, where the rejection of the null hypothesis indicates that REM is more appropriate. Finally, the Hausman test compares REM with FEM, where under the null hypothesis the efficient estimator is the REM. If we reject the null hypothesis, the FEM is more appropriate, since the REM would yield biased results.
In order to test the different hypothesis, we perform the following regressions, one for each debt variable (TD, LTD and STD):
where Yi,t – dependent variable (TD, LTD and STD) for the ith firm in year t; β – coefficient to estimate; Xi,t – independent variable for the ith firm in year t; ¿i,t – error describing the non-explained effects on Yi,t.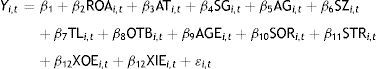
In the beginning all twelve independent variables (Xi) were included but after chosen the most appropriate model the regression was repeated with only the determinants of debt that showed up first as statistically significant.
5Empirical resultsTable 3 presents the results obtained for pooled OLS (POLS), fixed effects model (FEM) and random effects model (REM) and the different tests to choose the appropriate model. According to the Wald and Breusch-Pagan tests we always reject the Pooled OLS model and according to the Hausman test we reject the random effects model, indicating that the fixed effects model is more efficient.
Regression models: total indebtedness (TD), long-term indebtedness (LTD) and short-term indebtedness (STD).
| POLS | Sig. | FEM | Sig. | REM | Sig. | |
|---|---|---|---|---|---|---|
| TD | ||||||
| C | .841 | *** | .631 | *** | .750 | *** |
| ROA | −.116 | −.260 | *** | −.214 | *** | |
| AT | −.001 | .005 | −.004 | |||
| SG | .000 | * | .000 | ** | .000 | * |
| AG | .000 | ** | .000 | *** | .000 | ** |
| SZ | −.002 | .020 | .001 | |||
| TL | .000 | −.000 | .000 | |||
| OTB | −.086 | .140 | .021 | |||
| AGE | −.001 | * | −.001 | −.001 | ** | |
| SOR | −.278 | *** | −.191 | *** | −.228 | *** |
| STR | .033 | *** | .022 | *** | .025 | *** |
| XOE | −.012 | * | −.015 | * | −.010 | |
| XIE | .011 | .008 | .009 | |||
| Wald | F | 10,998*** | Reject POLS/accept FEM | |||
| Breusch-Pagan | LM | 117,673*** | Reject POLS/accept REM | |||
| Hausman | H | 77,664*** | Reject REM/accept FEM | |||
| LTD | ||||||
| C | −.070 | .497 | *** | .028 | ||
| ROA | .060 | .100 | .047 | |||
| AT | −.026 | −.081 | * | −.033 | ||
| SG | −.000 | −.000 | * | −.000 | ||
| AG | −.000 | −.000 | −.000 | |||
| SZ | .019 | * | −.017 | .001 | ||
| TL | −.001 | ** | −.001 | *** | −.001 | *** |
| OTB | .006 | −.351 | −.040 | |||
| AGE | .000 | −.008 | *** | .000 | ||
| SOR | .018 | −.024 | −.008 | |||
| STR | .135 | *** | .118 | *** | .126 | *** |
| XOE | .008 | .023 | ** | .013 | ||
| XIE | −.015 | .001 | −.005 | |||
| Wald | F | 7,277*** | Reject POLS/accept FEM | |||
| Breusch-Pagan | LM | 99,010*** | Reject POLS/accept REM | |||
| Hausman | H | 58,917*** | Reject REM/accept FEM | |||
| STD | ||||||
| C | .927 | *** | .147 | .649 | *** | |
| ROA | −.168 | −.366 | *** | −.280 | *** | |
| AT | .025 | .085 | .037 | |||
| SG | .000 | .000 | ** | .000 | ||
| AG | .001 | * | .000 | * | .000 | * |
| SZ | −.022 | .045 | .009 | |||
| TL | .001 | * | .001 | ** | .001 | *** |
| OTB | −.083 | .424 | .078 | |||
| AGE | −.001 | .005 | −.001 | |||
| SOR | −.301 | *** | −.167 | *** | −.207 | *** |
| STR | −.111 | *** | −.108 | *** | −.110 | *** |
| XOE | −.021 | −.036 | ** | −.025 | * | |
| XIE | .028 | .012 | .015 | |||
| Wald | F | 13,854*** | Reject POLS/accept FEM | |||
| Breusch-Pagan | LM | 158,352*** | Reject POLS/accept REM | |||
| Hausman | H | 69,940*** | Reject REM/accept FEM | |||
Note: POLS, pooled ordinary least squares; FEM, fixed effects model; REM, random effects model.
Since the tests reveal that the results under FEM have better explanatory power compared to results under POLS or REM, we estimate again the fixed effects model but selecting only the explanatory variables that showed up as significant in the previous estimation. The only exception is the variable XIE (dummy variable for the weight of exports to the EU market in relation to sales), since one of the main objectives of this paper is to test the “upstream-downstream” hypothesis. Table 4 presents the results obtained for TD, LTD and STD.
Regression (fixed effects model): total indebtedness (TD), long-term indebtedness (LTD) and short-term indebtedness (STD).
| Coefficient | Sig. | |
|---|---|---|
| TD | ||
| C | .7796 | *** |
| ROA | −.2490 | *** |
| SG | .0002 | ** |
| AG | .0004 | *** |
| SOR | −.1900 | *** |
| STR | .0216 | * |
| XOE | −.0145 | *** |
| XIE | .0077 | |
| R2 | .98 | |
| F | 168.68 | *** |
| DW | 1.31 | |
| LTD | ||
| C | .3465 | *** |
| AT | −.0855 | * |
| SG | −.0002 | * |
| TL | −.0006 | * |
| AGE | −.0089 | *** |
| STR | .1197 | *** |
| XOE | .0220 | ** |
| XIE | .0042 | |
| R2 | .92 | |
| F | 28.71 | *** |
| DW | 1.64 | |
| STD | ||
| C | .6900 | *** |
| ROA | −.3281 | *** |
| SG | .0003 | * |
| AG | .0005 | * |
| TL | .0005 | |
| SOR | −.1542 | *** |
| STR | −.1101 | *** |
| XOE | −.0330 | ** |
| XIE | .0110 | |
| R2 | .95 | |
| F | 48.40 | *** |
| DW | 1.51 | |
Finally, Table 5 presents a comparison between the expected and observed relationships, were we can validate the different hypotheses that are being tested in this empirical study.
Expected and observed relations.
| Explanatory variables | Expected relation | Observed relation | Hypothesis validated? | ||||
|---|---|---|---|---|---|---|---|
| TD | LTD | STD | TD | LTD | STD | ||
| H1 | |||||||
| ROA | − | − | − | − | NS | − | Yes |
| H2 | |||||||
| AT | + | + | − | NS | − | NS | … |
| H3 | |||||||
| SG | + | + | + | + | − | + | Yes |
| AG | + | + | + | + | NS | + | |
| H4 | |||||||
| SZ | + | + | − | NS | NS | NS | … |
| H5 | |||||||
| TL | − | − | − | NS | − | NS | … |
| H6 | |||||||
| OTB | − | − | − | NS | NS | NS | … |
| H7 | |||||||
| AGE | − | + | − | NS | − | NS | … |
| H8 | |||||||
| SOR | + | + | + | − | NS | − | … |
| STR | − | − | − | + | + | − | |
| H9 | |||||||
| XOE | − | − | − | − | + | − | Yes |
| XIE | + | + | + | NS | NS | NS | |
Note: “+” – positive relation; “−” – negative relation; NS – non-significant.
In our study ROA presents the expected negative sign relative to TD, validating the Pecking Order theory. Michaelas et al. (1999), Bastos and Nakamura (2009), Vieira and Novo (2010), Serrasqueiro and Nunes (2011), Antão and Bonfim (2012), Degryse et al. (2012) and Serrasqueiro and Caetano (2015) also found a negative relationship between profitability and indebtedness, suggesting that SMEs prefer to finance their assets internally and not externally. Regarding short-term and long-term indebtedness a negative relationship was expected but only for short-term indebtedness did we found the expected negative relation.
5.2Hipothesis 2 – Assets tangibilityThe observed relations with TD and STD are not statistically significant and only for LTD did we obtained a significant negative relation, as expected by the Pecking Order theory but contradicting some previous papers (e.g., Acedo et al., 2013; Matias et al., 2015; Vieira & Novo, 2010). Serrasqueiro and Caetano (2015) also found a negative relation, though not statistically significant.
5.3Hipothesis 3 – GrowthIn relation to TD, SG and AG yielded statistically significant results. Therefore, we can conclude that there is a positive relationship between growth and total and short-term debt. Acedo et al. (2013, p. 171), also evidenced a positive relationship between growth and debt, which is in accordance to the Pecking Order theory. That is not surprising due to the need to finance these investment opportunities with debt because rapidly growing firms are likely to have insufficient earnings to finance all of their growth internally (Frank and Goyal, 2003; Sogorb-Mira, 2005 also confirm these results). Furthermore, the relatively low debt level of firms in the footwear sector also help to explain this direct relationship due to the importance of R&D, patents, trademarks and design investments for this industry, valued as strategic investments by lenders.
5.4Hipothesis 4 – SizeIn this study, the SZ variable did not show a significant relationship with debt, a result that contradicts some previous papers (e.g., Gama, 2000; Mateev et al., 2013; Matias et al., 2015; Michaelas et al., 1999; Serrasqueiro & Caetano, 2015). Nevertheless, our result could be explained by the relatively homogeneity and low dispersion presented by the sample in terms of size, a variable here measured by the logarithm of total assets.
5.5Hipothesis 5 – Total liquidityOur results show a negative sign with LTD, confirming the Pecking Order theory and the results from Bastos and Nakamura (2009), Pastor and Gama (2013) and Acedo et al. (2013), who argue that firms with low levels of liquidity have a preference for debt. The positive relationship between TL and STD, though not significant, could be explained by the greater prevalence of trade credits in the footwear sector firms’ capital structure.
5.6Hipothesis 6 – OTBAs for OTB, the variable was not deemed as relevant, nor was it considered in the different estimations. Thus, we could not confirm the Trade-off theory which defends a negative relationship between OTB and short-term debt, a result found by Acedo et al. (2013), whereas Serrasqueiro and Nunes (2011), Matias et al. (2015) and Serrasqueiro and Caetano (2015) also did not found a significant relationship either for STD or LTD.
5.7Hipothesis 7 – AgeThis variable shows a significant relationship only for LTD, with AGE negatively influencing indebtedness. Notwithstanding that negative sign going against the expected by the Trade-off theory, a similar result was also found by Acedo et al. (2013) and Serrasqueiro and Caetano (2015) for total debt. For Vieira et al. (2013), the age variable showed no significant results, concluding that financing is not associated with firm maturity. So, in the specific case of the Portuguese footwear sector, age does not seem to be a determinant of the capital structure.
5.8Hipothesis 8 – RiskTo measure risk two independent variables (SOR and STR) were used. Thus, for risk to be negatively associated with TD, LTD and STD, it is expected that SOR and STR have, respectively, positive and negative signs. However, according to the results, it can be concluded that risk is positively related with leverage. These results, although contradicting the two theories, are in line with the results previously obtained by Brito et al. (2007) and Vieira and Novo (2010). So, firms with higher risk, which have more debt, may see their agency costs reduced and probably surpass the expected increase in bankruptcy costs.
5.9Hypothesis 9 – Presence in export marketsTesting the “upstream-downstream” hypothesis we can observe, in general, that a greater prevalence of exports to riskier markets (outside the EU) is associated with less leverage, validating the “downstream” idea (a result also found by Burgman, 1996; Low and Chen, 2004). Nevertheless, the “upstream” side is not validated, maybe due to the fact that the great majority of the Portuguese footwear sector firms are already deeply involved in the export markets. Notice also that, concerning LTD, the presence in markets outside the EU is associated with more leverage, probably due to the financing needs for that presence.
6Discussion and conclusionsThis paper explores the determinant factors behind the capital structure of the Portuguese footwear sector SMEs. Several empirical studies hold that the SMEs indebtedness policy can be explained mainly by two theories involving the firm's capital structure, the Trade-off and Pecking Order theories. We constructed a sample of 70 SMEs of the Portuguese footwear sector obtained from the SABI database for a period of 4 years, between 2010 and 2013, and used panel data methodology. Profitability, assets tangibility, growth, dimension, total liquidity, other tax benefits besides debt, age, risk and presence in foreign markets were used as determinant factors of the capital structure, and its relationship with total, long-term and short-term indebtedness was tested to account the impact on the capital structure.
The results indicate that profitability, growth, total liquidity, risk and presence in foreign markets are key factors affecting the capital structure of footwear firms, while firm dimension, assets tangibility, other tax benefits and age were not deemed relevant. Profitability showed a negative relationship with leverage in accordance with the Pecking Order theory, suggesting that the most profitable firms should use more debt in order to take advantage of the interest tax deductibility. Also in accordance to the Pecking Order theory, we found a positive relationship between growth and debt, which is not surprising due to the sector's need to constantly finance high levels of R&D and new investment opportunities. In terms of total liquidity, we observe the expected negative relationship with LTD, confirming the Pecking Order theory. In terms of risk, we conclude that footwear firms’ total and long-term indebtedness is associated with factors representative of business solvency and structure (SOR and STR). However, the signs are contrary to the expected and predicted from both the main theories, suggesting that riskier companies continue to be financed by lenders in order to avoid bankruptcy and of course the losses implied by bankruptcy costs. Such anomalous behavior could be justified by the progressive undercapitalization registered in the sector and by its need to constantly invest in R&D, design and equipment. This puzzle highlights the importance of further research on the footwear firms’ capital structure. Finally, partially validating the “upstream-downstream” hypothesis, we conclude that exporting to riskier markets is associated with less leverage, a negative relation explained by agency theory, which encourages firms to engage in international diversification. Nevertheless, we found a positive relation with long-term debt, which is in accordance with the Trade-off theory, since footwear firms exporting to riskier and distant markets experience more financing needs.
This study evidences the financial constraints faced by Portuguese footwear firms, a sector with specific characteristics such as strong investment in R&D and internationalization as a fundamental strategy. Our results provide some insights to characterize the footwear firms’ capital structure but also call for further research. Further research should, inter alia, (i) introduce qualitative variables (e.g., consider problems in terms of access to credit, capture the role played by firm-bank relationships and the quality of management) and variables specific to the footwear sector; (ii) increase the number of observations and distinguish the sample between micro, small and medium firms; (iii) distinguish among the three different areas of the footwear sector (footwear, footwear components and leather goods); (iv) further research the relationship between international diversification and capital structure, covering a longer period in order to obtain more insights for the complete business cycle. We expect further research will contribute to find a specific group of determinants of the footwear sector SMEs capital structure, offering a clearer view about which data should be considered by managers, entrepreneurs and other stakeholders when analyzing the industry.
In summary, the results of this paper allow us to conclude that the Trade-off and Pecking Order theories are not mutually exclusive in explaining the capital structure of Portuguese footwear sector SMEs, a topic little studied to date. Globally speaking, Pecking Order theory seems more suited to these firms, but the sector is not homogeneous, so that both theories are necessary to explain their capital structure throughout their lifecycle.
According to the Commission Recommendation 2003/361/EC of 6th May the definition of micro, small and medium-sized enterprises is as follows: (1) the category of micro, small and medium-sized enterprises (SMEs) is made up of firms which employ fewer than 250 persons and which have an annual turnover not exceeding EUR 50 million, and/or an annual balance sheet total not exceeding EUR 43 million; (2) within the SME category, a small enterprise is defined as a firm which employs fewer than 50 persons and whose annual turnover and/or annual balance sheet total does not exceed EUR 10 million; (3) within the SME category, a microenterprise is defined as a firm which employs fewer than 10 persons and whose annual turnover and/or annual balance sheet total does not exceed EUR 2 million.
