


The audit market concentration has been the subject of some studies in Portugal. Carmo Gonçalves (2009a, 2009b) and Almeida (2012) concluded that there was strong concentration among public companies. After these studies four important events emerge: the liberalization of fees, changes in the number of companies subject to audit, the auditors of public interest entities are required to publish an annual transparency report and Portuguese economy stepped into an economic and financial crisis. This work is based in the information disclosed in the transparency reports from 2010 to 2014. This information allowed us to analyze the concentration in the Portuguese audit market both in terms of revenues and in terms of clients. Data was treated according to the following methodology: Concentration Ratio, Herfinthal Index, Gini Index and Lorenz Curve. We conclude that, according to international trend, there is a concentration of the audit market, that is been increasing in the last years.
In the United States, in Europe and more recently in Portugal, the audit market has been extensively studied. This market seems to be structured like a perfect competitive one, based on the following logical thinking: the audit process, highly standardized and regulated, suggests the existence of an homogenous product, which demonstrates an indifference in relation to the appointment of the auditor, and, on the other hand, whether from the supply or the demand side, we can see a great number of companies which offer and buy the services. Thus, the market seems to have perfect competition characteristics, especially since, according to the model, no competitor possesses the conditions to impose itself upon the free forces in the market. However, as suggested by Porter (1985), Benau, Barbadillo, and Martinez (1998), Bueno and Morcillo (1993), the market works with a certain degree of imperfection, and the parameters which lead to the existence of the above mentioned model are not enough to know it in detail, hence the need to resort to other measures – the Concentration Ratio (CR), the Hirschman Herfinthal Index (HHI), the Gini Index (GI) and the Lorenz Curve (LC) – to understand why there are situations in-between the perfect competition model and the monopoly.
The studies undertaken in different countries highlight that one of the variables with greater information is the concept of market power, considered to be the capacity of some companies to impose particular conditions and, consequently, moving away from the standard behavior inherent to the perfect competition model. Hence, we assume that the larger companies are more capable of influencing the market as a whole and have the capacity to control the main transaction parameters: the price and the quality. When relocating this axiom to auditing, the existing concentration suggests that, through joint action, the power of the market can negatively affect the efficiency of resources allocation. However, it is necessary to show this power through an empirical analysis of the volume of market activity and its distribution between the different companies that offer audit services. Thus, the operation of the audit market may be dysfunctional if various companies control a sufficiently important market share, allowing them to impose behaviors capable of affecting the competition.
Zeff and Fossum (1967) were the first ones to apply, in the audit market, concentration levels due to three reasons: (1) the great emphasis appointed to audit by the American society, which it is understood as a service demanded by the market and not as a legal imposition (Hottegindre & Lesage, 2008); (2) the audit function is seen as an important instrument of the financial market; (3) and to the systematic compliance with the transparency principle when publicly using data bases. In the following decades it was confirmed that the large international audit companies greatly controlled the audit market. In the European countries, since the seventies of the last century, the audit market has equally been studied in different countries: United Kingdom, Denmark, Holland, Germany, Spain, and Portugal, among others. The pioneering work, made by Moizer and Turley (1989), emphasized the fact that the larger industrial companies in the United Kingdom, between 1972 and 1982, were audited by eight large international audit firms with a market share close to 55%.
The audit European market has been subject to further reflection, as shown by MARC Report (1996), whose main worry was the role, the position and the responsibilities of the statutory auditor in the European Union and its impact on European audit market. In turn, the Green Paper (1996) regulates statutory audit and the need for an intervention at a European level, as well as the freedom of establishment and the free rendering of services in the European audit market. The 2010, the Green Paper (2010) published by the European Union reinforces the excessive concentration of the auditing market in the so called big four (Deloitte, Ernst & Young, KPMG and PriceWaterhouseCoopers – PwC), which represents systemic risk, giving rise to a monopolistic market power, which eventually can be used to achieve abnormal returns and to restrict the ability of other providers to enter the market. Australian assurance suppliers and market regulators also reveal their concerns if another big audit firm fails, since they think that only three big audit firms would not be a sufficient support for the financial markets, so the consequences for choice and competition would be affected (Kend, Houghton, & Jubb, 2014).
2Audit market concentration backgroundFrom 1967 to 2015, various researchers in the United States, Europe, Australia and New Zealand, have pointed out a wide range of concerns related to the audit market, based on empirical studies concerning the limited competition between audit firms, due an increasingly fewer number of participants.
The international literature points out a set of various fields (Sori, 2009), from which we highlight the followings: audit market concentration, bidding or tender, service offer without being prompted, advertising, auditor's ability to resist client pressure and, by last, audit fees and the low-balling practices. From these factors, we emphasize the audit market concentration. This convergence brings a number of potential hazards that could lead into a new financial crisis, resulting in the loss of credibility in the financial information presented and disclosed by companies and audited by the auditors.
In effect, the CLERP 9 (Corporate Law Economic Reform Program – Australia), as enhanced by Green, Walker, and Mckinnon (2010), analyses the independence of the auditor in a market increasingly concentrated and suggests the existence of a loss of independence. In the same line of thought, Lambe (2013), referring to the UK Office of Fair Trading (2011), points out the adverse effects of concentration in market competition, the existence of collusion between the major audit firms and the rising of significant anti-competitive behavior. In this context, Francis, Michas, and Seavey (2013) refer to a great number of measures to reduce the dominance of the large audit firms: forbidding them to provide non audit services to their audit client, force audit firms to mandatory rotation and make joint audit mandates compulsory. In turn, the United States Government Accountability Office (GAO, 2008) recognizes that, through the use of the HHI calculated on the basis of the audit market share, since 1980, a very small number of audit companies, audit an increased number of public companies, resulting in a oligopolistic audit market. The GAO (2008) alerts, however, that a highly concentrated market does not necessary imply anti-competitive behaviors. In fact, the competition in an oligopoly can be intense and allows not only for more competitive prices but also more innovation and higher quality products. It is also referred that the auditing market with a small number of players has historical reasons and can generate advantages. As a result, GAO (2008) points out that mergers in the audit market are the answer to the world globalization and the need to become worldwide players. In Europe, the concentration of the audit market is especially important in the UK, where, following the Oxera reports (2006), the House of Lords (2010) discussed its consequences. The debate focused on the lack of competition, with possible repercussions in audit quality, taking into consideration the big four performance in the development of the 2008 financial crisis. The advantages and disadvantages of the concentration of audit market in the financial sector are also discussed. The final report is quite critical in relation to the performance of the large auditing companies.
At the beginning of the century, with the collapse of Arthur Anderson, the Sarbanes-Oxley Act (SOA, 2002) mandated GAO (2003) to study the concentration in the audit market. They concluded that in the US, and in the world, there are few auditing companies with the ability to audit multinational companies, creating, apart from high risks of market concentration, problems of choice and quality.
Lambe (2013) identifies a set of barriers when entering the audit market and presents solutions, such as: greater transparency in the auditors’ recruitment process, mandatory auditor and audit firm rotation, greater enforcement in the supervision of audit quality, direct link between auditors and audit committee, a more active coordination between managers, shareholders and auditors, development of the shareholders’ role in the accountability process, changes to the audit report and joint audits.
Ferguson, Francis, and Stokes (2003), Grinevicius and Krivka (2009), Krambia-Kapardis and Zopiatis (2010), present studies related to the problems that a concentrated audit market faces: the market structures, the concentration and fees received and the indexes applied to oligopoly markets, among others.
However, this issue is not recent. In fact, in the 80s, in the Unites States, Dopuch and Simunic (1980), analyze the segment of listed companies and through the CR technique, they refer to the existence of high levels of concentration (95–98%), when there were 8 companies aggregated (CR8), or (60–70%), to a CR4. In the 90s, with the mergers between the large audit firms, the gap between the large and the small and medium size audit companies extended (Wootton, Tonge, & Wolk, 1994). At a European level, we highlight the studies carried out in the UK (Beattie & Fearnley, 1992; Christiansen & Loft, 1992), In Spain, Benau et al. (1998), in Belgium, Numan and Willekens (2012). These auditors show differences between the several European countries and point to lower concentration levels than those seen in the United States. In the 90s the concentration levels continued to increase, thereby beginning a phase of critical analysis of the effects of concentration on competitiveness and on the audit report as well as on the effects of an oligopoly's power on the auditor's objectivity and independence (Minyard & Tabor, 1991; Tonge & Wootton, 1991).
Johnson, Walker, and Wester Gaard (1995) state that audit regulator authorities need more control, and better supervision in order to aim an increase in their efficacy. They directly associate the market degree of concentration with the economic development of a country.
Kend, Houghton, and Jubb (2014) inquired financial statements users, audit services suppliers, assurance services purchases and market regulators, and found out that only the first group has expressed concerns regarding audit market concentration, which is perceived, by this group, as being clearly insufficient, especially in the ability of audit firms rendering audit services to big and complex industries. They consider that the existence of only four big audit firms in not enough. Regarding the remedies to completion concerns, financial statements users and market regulators, pointed out: nationalizing audit services, since there is no competition, mergers between two or more non big four.
In Portugal there are two studies related to this matter: Carmo Gonçalves (2009a, 2009b) and Almeida (2012) which, by using differentiated computer bases and distinctive measures, point to the existence of high concentration in listed companies. However, the study undertaken by Almeida (2012) arrives to a different conclusion in relation to non-listed companies, in this case there is an equitable geographic distribution and a minimum concentration, even though an unequal distribution.
3HypothesesCarson, Redmayne, and Liao (2014), used the CR and HHI, applied to listed companies for which audit fee data are publicly available, to evaluate de concentration of the audit market in Australia, over the period 2000–2011. They found out that the big four dominated the market, using audit fee as a measure, with a share, by 2011, of 87% of total fee charged, so there findings show a highly segmented and supplier-concentrated market. The same conclusion can be drawn in Gerakos and Syverson (2015), these authors studied the concentration, both in clients number and in audit fees in public U.S. trade companies, from 2002 to 2010. Along this period PwC was the leading firm in % of audit fees charged, while in number of clients E&Y was the top firm. They noted that despite the high concentration levels, in both measures, the concentration has been decreasing. The market share based on audit fees in 2002 was 96.85% for big four, while in 2010 was 94.72%. The market share based on the number of clients, in 2002, was 82.65%, while in 2010 was 67.07%. Carmo Gonçalves (2009a, 2009b) and Almeida (2012) draw the same conclusions related do the audit market in the Portuguese stock exchange. Carson, Simnett, & Wright (2012) refer that a concentrated audit market increases big four audit fees.
As referred by Velte and Stiglbauer (2012), audit market in EU countries also exhibit similar concentration levels. These authors point out some studies that show a high level of concentration (Table 1):
Concentration level by country.
| Authors | Country | Concentration level |
|---|---|---|
| Bigus and Zimmermann (2008) | Germany | Big four hold a market share of 90% |
| Willekens and Achmadi (2003) | Netherlands | CR4 of 0.62 |
| Christiansen and Loft (1992) | Denmark | CR4 of 0.7 |
| Piot (2005) | France | CR 4 of 0.58 |
| Abidin, Beatti, and Goodacre (2010) | UK | CR 4 of 0.96 |
Therefore we formulated the following hypothesis:Hypothesis 1 The Portuguese audit market, on the supply side, shows a high concentration, in accordance with the international tendency.
SOA (2002), GAO (2003, 2008), Oxera (2006), Green Paper (2010), Green, Walker, and Mckinnon (2010), reveal concerns related to the continuous reduction of the number of audit firms capable of audit large companies. These studies point out that the concentration of a big number of clients in a small number of audit firms causes a systemic risk that can jeopardize the services provide by the auditors. Wang and Chui (2015) noted that the share of firms, in the US manufacture sector, is dominated by the big four, both in number of firms and in the number of industries, and that the 10th biggest audit firm that audits this type of industries only has 1% of the total firms. Carson, Redmayne, and Liao (2014) also noted that the market share in number of big four clients as decreased between 2000 and 2011 from 62.92% to 43.65%, which in comparison with other countries is a small market share, since the average is around 70% (e.g., the US). They point out that while non big four firms have seen little change in there market share, the growth in market share has been experienced by large and medium non big four firms, with Grant Thornton and BDO more than doubling their market share in the period under analysis. As a consequence, our 2nd hypothesis emerges:Hypothesis 2 The client dominance of the big four in the Portuguese audit market is stable during the last five years.
Benau et al. (1998), Cetorelli, Hirtle, Morgan, Peristiani, and Santos (2007), Numan and Willekens (2012), point out the high resistance of the concentrated market in relation to auditor changes, hence there is a need to verify the existence of competition within the big four, and with the small and medium size companies, measured through changes in revenues. Dunn, Kohlbeck, and Mayhew (2011) analyzed the big five to big four consolidation on audit firm industry market concluding that despite the concentration increase (measured through the GI and the HHI) the big four market share have become more equal since Arthur Andersen bankruptcy. Thus, the 3rd and 4th hypotheses are:Hypothesis 3 The relative position of each audit firm, included in the designation big four, is stable during the period considered. The relative position of each audit firm, included in the designation of small and medium size company, is stable during the period under analysis.
GAO (2003), Krambia-Kapardis, Christodoulou, and Agatho Cleous (2010), Cabán-Garcia and Cammack (2011), refer to the need of having specialized auditors. This expertise can be measure thought the type audit firm, to the connection with an international audit group (Hardies, Breesch, & Branson, 2015). We also considered that the being able to audit public companies also contributes to the expertise of Portuguese auditors, since most public interest entities are public companies. This situation tends to be reflected in the fees received, which gives rise to the following hypotheses:Hypothesis 5 The revenues of each audit company are related to the type of client. The auditing company's registration within the CMVM,1 and the connection of the auditors to an international network, influences the market share of each the audit company.
Steponaviciute and Zvirblis (2011) suggest that the audit market connection to financial stability is a focal point between politicians and participants in the capital market, pointing out the fact that investors have found an ambiguous relationship in the connection mentioned above. They further emphasize, in agreement with Cetorelli, Hirtle, Morgan, Peristiani, and Santos (2007), the high resistance of concentrated markets in changing auditors. Cabán-Garcia and Cammack (2011), in turn, refer that the concentration is associated with the dimension of industry, the concentration of clients and the indicator relating auditing companies to the number of existing companies, which supports Hypothesis 7:Hypothesis 7 The revenues of audit companies are related with the number of partners and with the location of the headquarters.
The following independent variables were considered: audit revenues, the number of public interest entities clients, the nature of the business (credit, funds, public, others), the number of partners, a geographic indicator (Lisbon, Porto and rest of the country), a dummy variable indicating an international connection, a dummy variable indicating the registry at the CMVM.
4Methodology4.1Collection of information and sampleThe no. 1 of the article 62 of the Law no. 140/2015, 7th September, imposes statutory auditors that audit public interest entities, to publish an annual transparency report on their web site.
It has consulted the website of the statutory auditors’ association's (OROC) where all individual auditors (ROC) and audit firms (SROC) active in Portugal, are listed.
Based on OROC list, we withdraw the addresses of the websites of the ROC/S ROC. Next, we observed each site to check whether the annual transparency report existed or not. We proceed to their analysis in order to assess the revenues (assurance services, consulting services, non-assurance services) of the ROC/SROC, the number of partners, whether they are linked to an international network, if they are register in the CMVM, and the number and type of public interest entities they audit. We detected a totality of sixty-four statutory auditors (two ROC and sixty-tow SROC) that in 2014, audit of public interest entities and had released the annual transparency report on the website.
The ten largest auditing companies operating in Portugal ordered by the total revenues in 2014,2 of all ROC/SROC that audit public interest entities are showed in Table 2:
Revenues of the audit companies that audit public interest entities (in millions).
| Audit Firm | 2014 | 2013 | 2012 | 2011 | 2010 | |||||||||||||||
|---|---|---|---|---|---|---|---|---|---|---|---|---|---|---|---|---|---|---|---|---|
| Assurance services | Consulting services | Non-assurance services | Total | Assurance services | Consulting services | Non-assurance services | Total | Assurance services | Consulting services | Non-assurance services | Total | Assurance services | Consulting services | Non-assurance services | Total | Assurance services | Consulting services | Non-assurance services | Total | |
| E & Y | 36,978 | 13,691 | 34,482 | 85,151 | 32,528 | 11,956 | 33,924 | 78,408 | 30,267 | 9,355 | 23,055 | 62,677 | 32,286 | 0 | 3,360 | 35,646 | 26,886 | 6,470 | 17,229 | 50,585 |
| Deloitte | 33,213 | 23,072 | 0 | 56,285 | 33,348 | 15,782 | 6,000 | 55,130 | 31,366 | 17,531 | 4,087 | 52,985 | 36,397 | 19,625 | 4,326 | 60,348 | 37,993 | 20,161 | 3,404 | 61,558 |
| KPMG | 32,907 | 15,632 | 2,429 | 50,968 | 30,722 | 15,873 | 1,242 | 47,837 | 31,144 | 14,170 | 1,504 | 46,818 | 32,873 | 13,486 | 1,480 | 47,839 | 33,296 | 12,409 | 1,563 | 47,268 |
| PwC | 32,896 | 12,336 | 2,022 | 47,254 | 30,547 | 10,389 | 1,280 | 42,216 | 30,990 | 10,744 | 2,595 | 44,329 | 32,149 | 9,300 | 100 | 41,549 | 26,708 | 8,372 | 1,320 | 36,400 |
| BDO | 5,448 | 1,041 | 2,417 | 8,906 | 5,143 | 1,837 | 1,073 | 8,053 | 5,294 | 1,751 | 1,032 | 8,077 | 5,237 | 2,171 | 1,217 | 8,625 | 5,958 | 2,388 | 963 | 9,309 |
| Mazars | 4,623 | 573 | 416 | 5,612 | 4,754 | 986 | 0 | 5,741 | 5,133 | 957 | 0 | 6,090 | 5,077 | 785 | 0 | 5,862 | 5,920 | 910 | 0 | 6,830 |
| PKF | 1,244 | 556 | 3,718 | 5,518 | 1,282 | 417 | 3,166 | 4,865 | 1,427 | 386 | 2,886 | 4,699 | 1,269 | 480 | 3,390 | 5,139 | 1,731 | 406 | 3,046 | 5,183 |
| Baker Tilly | 1,488 | 479 | 1,339 | 3,306 | 753 | 821 | 1,145 | 2,719 | 502 | 606 | 1,215 | 2,323 | 394 | 206 | 333 | 932 | 541 | 356 | 503 | 1,400 |
| Oliveira, Reis & Associados | 2,721 | 24 | 214 | 2,959 | 2,834 | 39 | 326 | 3,198 | 2,925 | 57 | 356 | 3,337 | 3,248 | 79 | 172 | 3,499 | 3,516 | 54 | 397 | 3,967 |
| Armindo Costa, Serra Cruz, Martins & Associados | 2,585 | 0 | 0 | 2,585 | 2,426 | 0 | 0 | 2,426 | 2,531 | 0 | 0 | 2,531 | 2,564 | 0 | 0 | 2,564 | 2,642 | 0 | 0 | 2,642 |
| Total top 10 | 154,103 | 67,403 | 47,038 | 267,589 | 144,338 | 58,101 | 48,155 | 249,594 | 141,579 | 55,557 | 36,730 | 233,866 | 151,494 | 46,132 | 14,378 | 212,003 | 145,191 | 51,527 | 28,424 | 225,141 |
| Global total | 192,161 | 68,509 | 48,741 | 309,377 | 183,664 | 59,303 | 49,964 | 292,932 | 184,735 | 56,911 | 38,366 | 280,012 | 179,892 | 46,616 | 15,710 | 242,218 | 163,962 | 51,629 | 29,304 | 238,466 |
Analyzing the table above we can see that assurance services of the 10 largest audit firms represent about 80% of the total of these revenues of all audit companies. The total revenues of the 10 largest audit firms represent about 86% of all the revenues. Both percentages have been rising since 2012.
Within the companies under analysis we observed that the revenues of the big four (239.658), in 2014, represents 89% of the revenues of the 10 largest audit companies and 77% of the revenues of all audit companies that audit public interest entities.
In relation assurance services the fees charged by the big four represent 88% and 71% of the total fees of the same type charged by the 10 largest audit companies and by the other companies that audit public interest entities, respectively.
From 2012 to 2014, the fees related to audit and assurance services registered an increase of 9%, whereas the consulting services and the non-assurance services increased 21% and 28%. In general terms, the revenues increased 14% in these three years.
We also observed that there were 1.390 public interest entities in 2014. For the purpose of analysis we divided these entities into four groups: 1st group (credit): entities issuing securities and credit institutions; 2nd group (funds): security funds, real estate funds, venture capital funds and pension funds; 3rd group (public): public companies; 4th group (others): other entities of public interest.
4.2Concentration measures usedTo measure the competitive nature of the market in a secure and transparent way, the aforementioned international literature suggests the choice of a concentration measure, based on an observable variable with high explanatory capacity. To measure the activity of the audit market we analyzed its total offer, based on direct indicators determined by the revenue levels of the various companies and professionals. The auditing company's revenue is considered a direct measure of its size. Thus, in this perspective, we presuppose that the revenues and the size are related positively: a greater size implies necessarily a greater work volume. So the audit market concentration indexes may be constructed by using the revenue volume to evaluate its market share. When the variable is chosen we must apply the most adequate concentration index to provide an approximated measure of a market structure and, this index, embodied in a real number (Segura, 1993), reflects number of companies in the market and their respective market share. These methodologies have already been sufficiently tested internationally. The concentration measures more frequently used in this type of study, already validated in industrial economies, are the so-called concentration measures (Reis, 2002), when it makes sense to accumulate the characteristic under study in a bigger or smaller number of individuals. That is, when a characteristic can be distributed more or less uniformly and, simultaneously, it is possible to conceive the following extreme situations: Only one individual holds the entire attribute (a maximum concentration); each individual holds equal part of the attribute (the concentration is minimal). In this study, we used the following techniques:
Concentration ratio (CR) of order n: this indicator aggregates the market shares of the n larger companies in the market. Analytically, the ratio is as follows:
where CR is the company's market share; n is the number of companies analyzed; Fn is the invoicing/no. of companies; F is the invoicing/no. of existing companies in the market.
It is a transparent index, quickly interpreted and generally accepted. However, as stated by Benau et al. (1998), it has the drawback of not taking into consideration the complete distribution of the market shares or its dimension, added to the fact that it does not reflect the entries and exits of the industry, nor the position change in relation to the n companies. Thus, as it only reports the market share of the n larger companies, it can be classified as a partial concentration index.
More global indexes have been used (Wootton et al., 1994; Wolk, Michelson, & Wootton, 2001) to measure the concentration of the markets. The index named – Hirschman Herfindahl Index (HHI) – has been used for its explanatory power which takes into consideration all the active companies in the market, irrespective of their size and reflects, equally, the dispersion of the activity between the agents on the supply side.
Its analytical formulation is as follows:
where HHI is the Hirschman Herfindahl Index, Z is the market share referring to the sample companies; n is the number of active companies in the market.
The index varies between 0 and 1. Zero means a minimal concentration, the market is shared equally. Number 1 where maximum control is performed by one single company. This index reflects the number of active companies in the market, as well as their degree of activity, which allows us to assume that the small companies have less influence on the index than the larger companies, which may be conceived as a relative dispersion measure. The square of the market share gives more weight to the larger companies and therefore HHI decreases as the number of companies in the market increases or when it becomes more uniform.
The Gini index reveals that the higher the concentration, the more the curve will depart from the equal distribution line (Reis, 2002). The index varies between 0 and 1: it is null when there is equal distribution of the variable in all the classes by the agents under study and is at maximum value when the entire attribute is concentrated in the individuals of the last class. Its analytical formulation is as follows:
where GI is the Gini concentration index; qi is the cum yi/∑yi; pi is the cum Fi/∑Fi; with Fi is the accumulated number of companies; yi is the accumulated sales volume.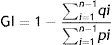
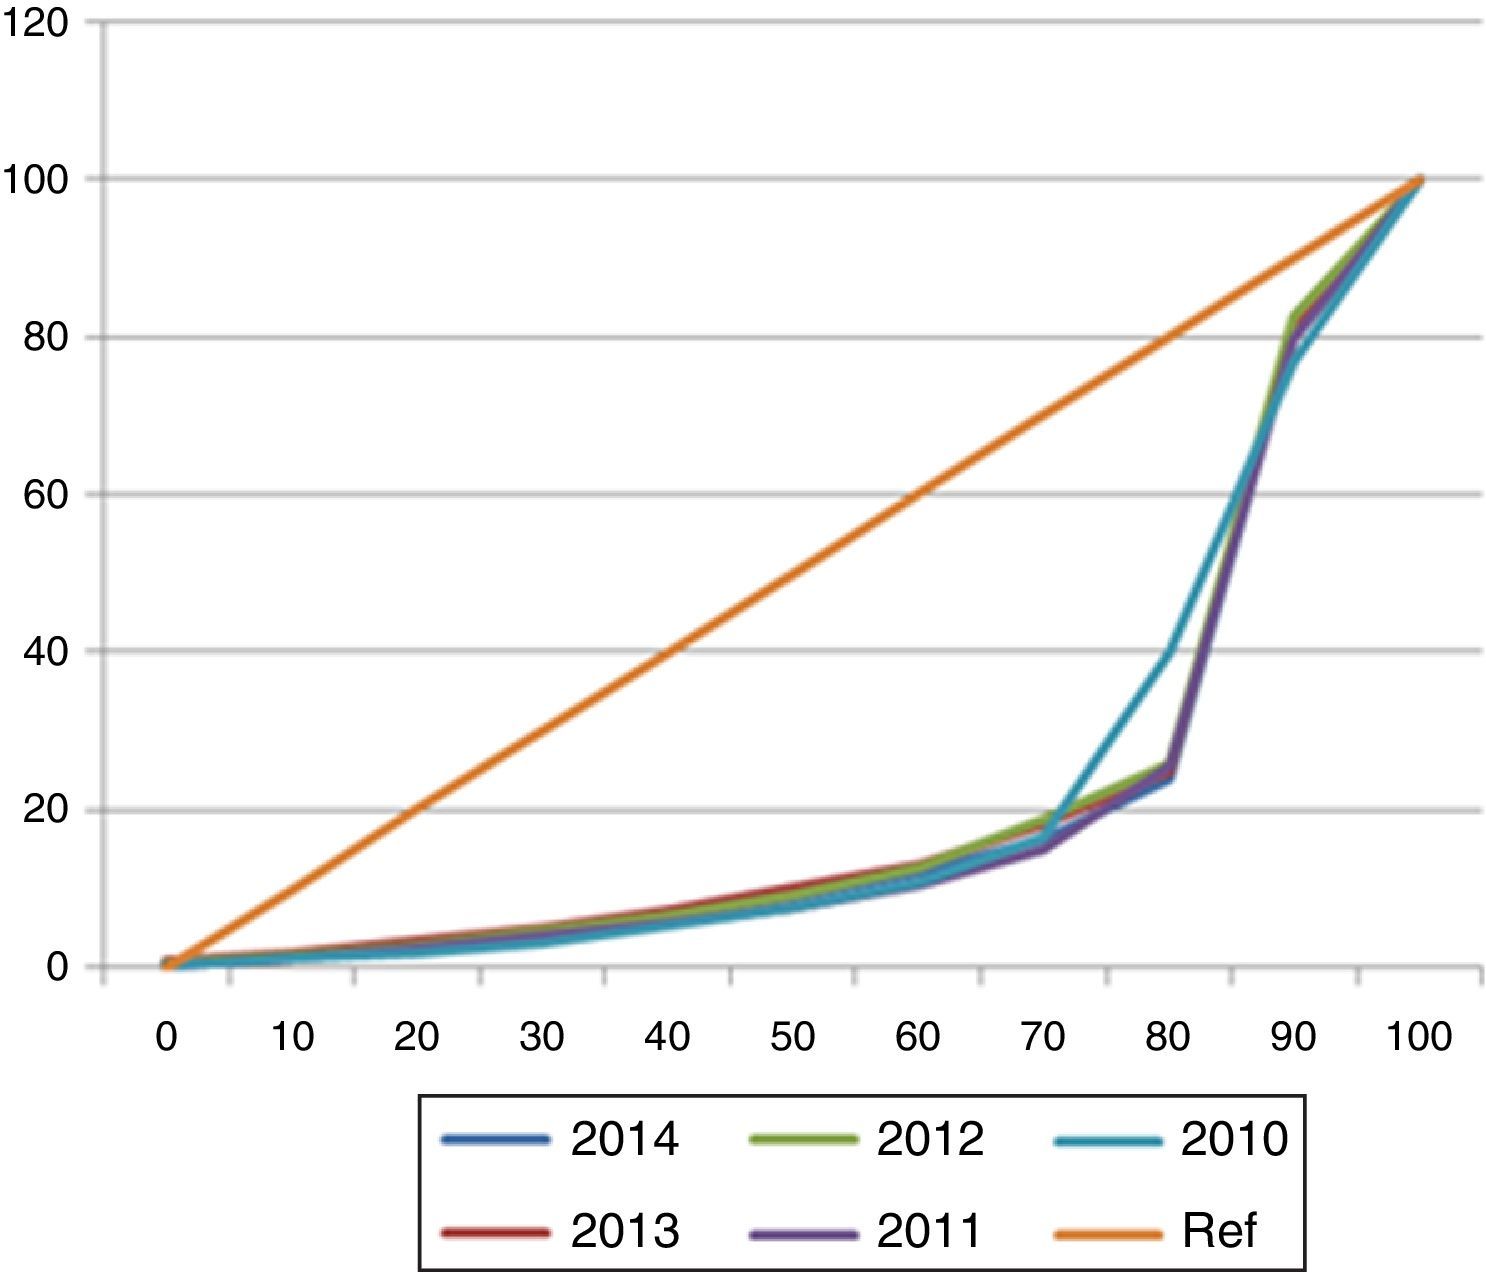
Lorenz curve (LC) is obtained by joining, in a Cartesian reference, the accumulated frequencies for each class in relation to the total [cum fi=cum Fi/∑Fi], as well as the accumulated frequencies of the attribute in question [cum yi=cum yi/∑yi].
If the concentration is minimal, the result will be an equal distribution line. As we get away from that line, the area of concentration increases indicating therefore a greater concentration.
The summary of the concentration measures can be seen in Table 3 (Bigus & Zimmermann, 2008; Slottje, 2002).
Measures of concentration.
| Measures | Formula | Low market concentration | Medium market concentration | High market concentration |
|---|---|---|---|---|
| CR(k) | CR=∑1nFnF | CR(3)<10% CR(4)<50% CR(8)<70% | CR(3)<25% CR(4)<65% CR(8)<85% | CR(3)≥25% CR(4)≥65% CR(8)≥85% |
| HHI | HHI=∑i=11Zi2 | HHI<0.1 | HHI≤0.18 | HHI>0.18 |
| GI | IG=1−∑i=1n−1qi∑i=1n−1pi | GI<0.4 | GI≤0.6 | GI>0.6 |
| Volatility index | ||||
| V | V=∑i=1n|xi2−xi1| | |||
By plotting the audit revenues for the year 2014, we can see that four companies are responsible for almost 71% of the assurance services revenues (Fig. 1), while in 2010, they were responsible for 86%. Regarding the total revenues of the audit companies, in 2010 the big four represented 87%, while in 2014 they represent 77%.

From the analysis of Table 4 and Fig. 1 we can point out that the total revenues perceived by the audit companies, when analyzed through descriptive statistic measures – location measures – allows us to summarize the data through a single value. The most important are the central tendency measures which represent the phenomenon – revenues – by the mean value around which the values observed tend to concentrate. Thus, the means relative to the five years under analysis, although in decline, reveal acceptable values, however, if we analyze the maximum values obtained, taking into consideration each of the years concerned, it can be confirmed that there is an accentuated pattern deviation. Nevertheless, this analysis, apart from being reductionist, is not adequate to treat this specific statistical data. Thus, we resorted to measures which are central in the succession of observations or in the distribution of frequencies and it was noted that the average is extremely low in relation to the mean.
Audit revenues.
| Mean | Maximum | Median | Minimum | Percentile 25 | Percentile 75 | Standard Deviation | Sum | Total N | |
|---|---|---|---|---|---|---|---|---|---|
| 2010 | 5289.13 | 37,993.00 | 1053.00 | 24.00 | 506.00 | 2841.00 | 10,395.63 | 163,963 | 64 |
| 2011 | 4082.45 | 36,397.00 | 765.50 | 24.00 | 466.50 | 1957.50 | 9471.50 | 179,628 | 63 |
| 2012 | 3171.26 | 31,366.00 | 701.00 | 26.00 | 427.00 | 1796.00 | 7769.65 | 180,762 | 63 |
| 2013 | 3255.66 | 33,347.71 | 775.23 | 124.53 | 457.18 | 1580.61 | 8050.09 | 182,316 | 56 |
| 2014 | 3005.85 | 36,978 | 680.87 | 74.48 | 390.59 | 1274.10 | 8132.64 | 192,374 | 64 |
In turning to the analysis of the independent variable revenues, not using central tendency measures – (quartis) – which divide the population in four equal parts, it can be noted that they confirm the measures previously used.
Table 5 shows the concentration measures for the five years. A high level of market concentration can be seen, especially for the big three/four companies.
The HHI is the most conservative showing that between six (6.54 in 2010) and eight (in 2014) equal-sized companies would have to have the same result. There is a large dispersion of small companies. Table 6 shows that 75% of companies have a small number of clients.
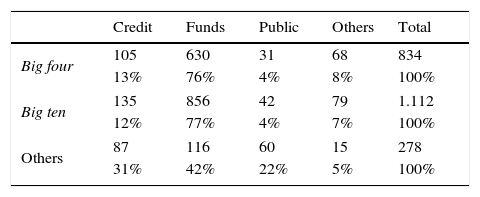
Table 6 shows that the number of clients per nature of business in the big four and big ten are similar, with funds and credit being the larger groups. In the reaming audit firms, despite the larger groups being also funds and credits, we can see that public also assume an important part in the total number of clients, as a matter of fact, this is the only group where the number of clients is bigger than the big ten (Fig. 2).

The concentration indexes referred in Table 5 and in Table 7 CR, HHI, GI-in relation to the period under analysis, show, similarly to the international literature, extremely high levels of concentration, as shown by the concentration ratio CR3, CR4 and CR8, although the level of concentration since 2010, has decreased slowly. Hence, the joint participation of the eight largest auditing companies reaches 77.30% in 2012, slightly inferior to the preceding years. However, it must also be said that the joint participation of the four companies (CR4) reached 68, 50% in 2012, which, similarly to the previous index, shows a slight decrease in relation to the previous year.
HHI joins the tendency of previous indicator, showing some tendency to slowdown in the concentration; however, it still reflects very high levels. In effect, taking the pattern that 0.5 of the index corresponds to the existence of two companies operating in the market of identical size; we observed that, in 2010, the index approximately corresponds to eight companies of identical size. In 2014 around eight companies which report equally in the market, which shows that there are various barriers to the de concentration in the audit market, this clearly being in line with the international situation. The previous convictions are reinforced by the quantification based on the GI and the LC. In fact, the greater the concentration, the more the curve departs from the line of equal distribution. As we can see, the index has a high value in the period under analysis and reflects a perfectly stable situation – 0.771 (2010), 0.784 (2011), 0.767 (2012), 0.762 (2013) and 0.784 (2014) – however, the LC, which in situation of monopoly has the shape of a triangle, shows a slight flattening, which is in accordance with the numbers indicated by the indexes previously referred to.
The values presented for both clients (Table 7) and revenues (Table 5) do not differ much. Indicating that around 80% of the market is within the first 8 companies. Hypotheses 1 and 2 are therefore confirmed.
When we break down the CR, we obtain Table 8.
Break down of the concentration ratios.
| Year | CR3 | Ranking | Total revenue | CR4 | Ranking | Total revenue | CR8 | Ranking | Total revenue |
|---|---|---|---|---|---|---|---|---|---|
| 2014 | E & Y | 1 | 85.151 | E & Y | 1 | 85.151 | E & Y | 1 | 85.151 |
| Deloitte | 2 | 56.285 | Deloitte | 2 | 56.285 | Deloitte | 2 | 56.285 | |
| KPMG | 3 | 50.968 | KPMG | 3 | 50.968 | KPMG | 3 | 50.968 | |
| PwC | 4 | 47.254 | PwC | 4 | 47.254 | ||||
| BDO | 5 | 8.906 | |||||||
| Mazars | 6 | 5.612 | |||||||
| PKF | 7 | 5.518 | |||||||
| Baker Tilly | 8 | 3.306 | |||||||
| 2013 | E & Y | 1 | 78.408 | E & Y | 1 | 78.408 | E & Y | 1 | 78.408 |
| Deloitte | 2 | 55.130 | Deloitte | 2 | 55.130 | Deloitte | 2 | 55.130 | |
| KPMG | 3 | 47.837 | KPMG | 3 | 47.837 | KPMG | 3 | 47.837 | |
| PwC | 4 | 42.216 | PwC | 4 | 42.216 | ||||
| BDO | 5 | 8.053 | |||||||
| Mazars | 6 | 5.741 | |||||||
| PKF | 7 | 4.865 | |||||||
| Oliveira, Reis & Associados | 8 | 3.198 | |||||||
| 2012 | E & Y | 1 | 62.677 | E & Y | 1 | 62.677 | E & Y | 1 | 62.677 |
| Deloitte | 2 | 52.985 | Deloitte | 2 | 52.985 | Deloitte | 2 | 52.985 | |
| KPMG | 3 | 46.818 | KPMG | 3 | 46.818 | KPMG | 3 | 46.818 | |
| PwC | 4 | 44.329 | PwC | 4 | 44.329 | ||||
| BDO | 5 | 8.077 | |||||||
| Mazars | 6 | 6.090 | |||||||
| PKF | 7 | 4.699 | |||||||
| Oliveira, Reis & Associados | 8 | 3.337 | |||||||
| 2011 | Deloitte | 1 | 60.348 | Deloitte | 1 | 60.348 | Deloitte | 1 | 60.348 |
| KPMG | 2 | 47.839 | KPMG | 2 | 47.839 | KPMG | 2 | 47.839 | |
| PwC | 3 | 41.549 | PwC | 3 | 41.549 | PwC | 3 | 41.549 | |
| E & Y | 4 | 35.646 | E & Y | 4 | 35.646 | ||||
| BDO | 5 | 8.625 | |||||||
| Mazars | 6 | 5.862 | |||||||
| PKF | 7 | 5.139 | |||||||
| Oliveira, Reis & Associados | 8 | 3.499 | |||||||
| 2010 | Deloitte | 1 | 61.558 | Deloitte | 1 | 61.558 | Deloitte | 1 | 61.558 |
| E & Y | 2 | 50.585 | E & Y | 2 | 50.585 | E & Y | 2 | 50.585 | |
| KPMG | 3 | 47.268 | KPMG | 3 | 47.268 | KPMG | 3 | 47.268 | |
| PwC | 4 | 36.400 | PwC | 4 | 36.400 | ||||
| BDO | 5 | 9.309 | |||||||
| Mazars | 6 | 6.830 | |||||||
| PKF | 7 | 5.183 | |||||||
| Oliveira, Reis & Associados | 8 | 3.967 | |||||||
The analysis of the table above presents the breakdown of CR3. For the period under consideration we can see that there is no change on the top 3 audit firms from 2012 to 2014. However, there was change in the first position in 2012, with Ernst & Young becoming the revenue leader, surrendering Deloitte. The level of concentration measured by the concentration ratio CR4 includes PWC. This audit firm that was the 3rd biggest in 2011 falls to the fourth position in 2012, reaming there in the following years.
The CR8 includes, in its perimeter small and medium size audit companies, whose activity, measured by the variable under study, shows in 2014, levels corresponding to 27% of the revenue of the leader firm, while in 2010 it was 41%. It can also be seen that these entities, in the five years under consideration, have lost revenues, comparing 2014 to 2010 we can see a decrease in 8%. Ernst & Young shows the highest level of growth from 2010 to 2014 of the big four, increasing the revenues in 68%, the only big four that decrease its revenue is Deloitte. The average increase rate in the big four was 22%, with PwC and E&Y growing above the average rate. Analyzing the CR8 (from 2010 to 2014), the company that most increased its revenues was Baker Tilly, while, on the other hand, Oliveira Reis & Associados, by 2014 vanished from the top 8 audit firms.
In the period analyzed, the CR8 shows that the total revenues of the small and medium size audit firms never exceed the revenues of the last big four. In 2014 the revenues did not reach 50% of PWC revenues. Hypotheses 3 and 4 were therefore confirmed.
The geographic indicator, created with three levels (Lisbon=1, Porto=2 and the rest of the country=3) did not show any statistical difference (Kruskal–Wallis p-value 0.395), however, the international liaison indicator and the registry at the CMVM are significant (Mann Whitney U p-value<0.001) showing differences in revenues.
Table 9 presents other indirect aspects related with concentration. Thus we notice that, most of the audit firms have less than five partners, only 22.80% of the audit firms have more than five partners. The headquarters are located in Lisbon (59.60%) and Porto (21.10%), others cities around the country only represent 19.30%. Yet, the registry in the CMVM and the connection to an international network are more homogeneous, however most auditors are not registered in the CMVM and do not belong to an international network.
The correlations shown in Tables 10 and 11 establish a positive significant relation between audit revenues and the number of credit clients (0.502 p-value<0.01), the number of funds clients (0.504 p-value<0.01) and the number of public clients (0.305 p-value=0.021). The number of partners was strongly related with audit revenues (0.722 p-value<0.01).
Correlations Part I.
| Spearman's rho | Funds | Public | Other | Total | Partners | Revenues | |
|---|---|---|---|---|---|---|---|
| Credit | Correlation coefficient | 0.339b | −0.141 | 0.422b | 0.627b | 0.311a | 0.502b |
| p-Value | 0.010 | 0.294 | 0.001 | <0.01 | 0.018 | <0.01 | |
| Funds | Correlation coefficient | 0.283a | 0.582b | 0.759b | 0.432b | 0.504b | |
| p-Value | 0.033 | <0.01 | <0.01 | 0.001 | <0.01 | ||
| Public | Correlation coefficient | 0.110 | 0.283a | 0.433b | 0.305a | ||
| p-Value | 0.415 | 0.033 | 0.001 | 0.021 | |||
| Other | Correlation coefficient | 0.611b | 0.351b | 0.464b | |||
| p-Value | <0.01 | 0.007 | <0.01 | ||||
| Total | Correlation coefficient | 0.519b | 0.600b | ||||
| p-Value | <0.01 | <0.01 | |||||
| Partners | Correlation coefficient | 0.722b | |||||
| p-Value | <0.01 | ||||||
A significant correlation between the number of clients and market share was found. The number of partner auditors is also positively related with market share.
Audit companies that are registered at the CMVM and the ones with an international connection have a significantly higher percentage of market shares.
Revenues significantly different for companies with international liaison and registered at CMVM (Mann–Whitney test). Geographic indicator tested with Kruskal–Wallis test was non-significant for Lisbon (39)-Porto (13)-Other (12) p-value=0.831.
Revenues are correlated with number of partners 0.722 p-value<0.001.
Credit, funds, public and other clients are positively correlated with audit revenues. Hence, Hypotheses 5–7 (partially) are confirmed.
6DiscussionThe empirical study shows, on the supply side, the level of concentration in the Portuguese audit market, based on the most frequently used variables found in other international studies.
The results show high levels of concentration for the Portuguese market, being similar to those obtained in investigations by Lambe (2013), GAO (2003, 2008), Oxera (2006), Francis et al. (2013) and Velte and Stiglbauer (2012).
The results based on the independent variable – revenues – point to a great resistance of public interest entities to change auditor, which is in line with the studies already carried out by Cetorelli et al. (2007). This fact is also due to the maximum period of seven years that the auditor in charge can audit that particular entity.
The Portuguese audit market does not work on the model of perfect competition, since it shows a high degree of imperfection, materializing in the remarkable market power of the big four.
Indeed, the size of audit firms is a relevant competitive advantage (Benau, Barbadillo, & Martínez, 1998) translated into a continuous increase in their market share, and the concomitant reduction of small and medium-sized audit companies market, as it has been demonstrated.
Indeed, the level of concentration reached by the Portuguese market, measured by the HHI, shows a structure of unequal competition. Thus, the dimension of the audit firms allows access to economic sectors subject to greater control; financial institutions and other public interest entities tend to hire international audit companies. Small and medium audit firms audit a small number of public interest entities compared with the market dominated by the big four.
In fact, the first ones have a limited capacity to meet the demand of a large multinational company: thus a relationship between market share and size is present.
On the other hand we infer that this approach is suitable to the demand side, to the extent that, in Portugal the engagement of the auditor's services is perceived as a legal obligation, and not as a market demand and, in this context, as the differentiation capacity is minimal, the price is considered a powerful explanatory variable (Kinney, 1986; Mutchler & Williams, 1990).
With regard to big four, given the theory based on differentiation through service, where the explanatory variable is quality, large companies demand for audit services is a seem as service in the market interest and not an legal obligation, it is assumed that the demand differentiates the services provide by auditors, which rules out the theory of homogeneity.
7ConclusionExperience and reputation are important obstacles to the expansion and to the selection of small and medium size auditing companies to audit public interest entities. The complexity of auditing large multinational companies requires horizontal and specific knowledge and technological instruments that are not at the disposal of small and medium size audit firms, nor self-employed auditors. Differentiation – through work quality, specialization and skills – in evermore specific domains has been the strategy used by the large audit firms to enter the market based on the assumption that audit product is not homogeneous. In this context, the worldwide market, which has not left the small Portuguese market unaffected, is becoming more concentrated among fewer numbers of companies, based, in relation to a rising demand, on an oligopoly type of structure. The problems of the audit market concentration have captured the interest of many researchers and international institutions because of the potential dangers that these hold for the stability of the financial market and, ipso facto, for society itself. Concentration and the competitiveness are closely related and society is starting to question the effects that concentration has on the objectivity and on the auditor independence. This market concentration, in relation to the underlying advantages and drawbacks, is not based on a consensus approach. Hence, some theories advocate that market concentration is a competitive advantage strategy, and that this phenomenon allows clients to be offered with high value-added services. On the other hand, it is conceded that a highly concentrated market does not necessarily imply an anti-competitive behavior, as the competition, in oligopoly, can be intense and allows for more competitive prices, innovation and high quality products. In different countries the characteristics of the audit market which have prevented free competition in the sector have been studied, a set of obstacles to gain access have been identified and some solutions have been put forward: greater transparency in the recruitment process of auditors, auditor rotation, auditors directly connected to the auditing committee, joint legal audits, responsibility for the appointment of auditors, more active connections between all those intervening in the accountability process, etc.
Regarding the Portuguese case we could see that the big four companies are increasing their market share in the period under analysis, since that in both assurance services revenues and in total revenues their percentage has increase. In global terms, despite the slowdown in market revenues that occurred in 2010–2012, in the last three years all revenues have increased specially those related to non-assurance and to consultancy services. But, we can see two distinctive directions: while the big four have increased both in assurance services revenues and in total revenues, the other audit firms, as a group, have known a decreased in the same revenues. So we conclude that the increase in market revenues is due to the big four, reaffirming this fact, 38% of audit firms have increased their revenues, while 62% have decreased their revenues.
The number of audit firms, that audit public interest entities, has been relatively stable during this period, nevertheless, the recently published Law no. 148/2015, 9 September, that approves the legal regime of audit supervision, imposes non-compliance fines that in some cases exceeds two to three years revenues of some public interest entities, so, it is our opinion, that in a near future the number of audit firms, that operate in this specific market, will decrease, leading to an even higher concentration. The auditing market concentration, on the supply side, implies necessarily the concentration, in multinationals, of a greater number of auditors concentrated in Lisbon and Porto.
In sum, the auditing market concentration process, on the supply side, in a medium-sized European economy – Portugal – is in line, in terms of concerns, with the international literature on this issue.
Regulator of the Portuguese stock market. Only audit firms that are register in the CMVM can audit public companies.
The total revenues in the years 2010 and 2011may be more them the ones presented in the table, since some audit firms remove from their website the transparency reports from previous years. Since this study started in 2012, we were not able to examine all the transparency reports from 2010 and 2011. This is a limitation in our work.

www.publicationethics.org.