


This paper analyzes the influence of banking crises on bank market power across a sample of 64 countries and 66 episodes of banking crises during the 1989–2007 period. We provide evidence from country- and bank-level data supporting that, after a systemic banking crisis, there is an increased level of bank market power consistent with higher levels of bank market concentration. Moreover, the higher the severity of the banking crisis the higher the increase in bank market power. However, whereas institutional quality fosters the positive impact of banking crises on market power, stricter regulation on banking activities and on new entries into the bank market seems to reduce the effect of the crisis on market power.
The aim of this paper is to analyze how banking crises affect the level of competition in the banking industry and to examine how bank regulation and institutional development in a country shape the influence of crises on bank competition. The degree of competition in the bank market matters for overall financial functioning and for the economic performance of the country. Previous literature has shown that bank competition influences efficiency in bank management (Berger and Hannan, 1998), firms’ and industries’ access to external sources of financing (Beck et al., 2004), financial stability (Beck et al., 2006, 2013) and firms’ and industries’ economic growth (Cetorelli and Gambera, 2001; Claessens and Laeven, 2005; Fernández et al., 2010).
However, most papers have dealt with these questions using a model based on market structure instead of applying an analysis based on the industrial organization theory, which in fact allows accurate measurement of the level of competition in the bank market. The industrial organization theory has shown that competition in an industry cannot be measured by market structure indicators alone. Rather, establishing the degree of effective competition requires a structural model to overcome the concerns raised by the contestability literature. This organizational-based approach has taken into account microeconomic models with market equilibrium conditions and has developed different measures of market competition based on the measure of bank market power developed by Lerner (1934), calculated as the difference between the price and marginal cost expressed as a percentage of price; and the H-index developed by Panzar and Rosse (1987).
Another set of recent cross-country studies have examined the effect of the regulatory, supervisory, and institutional environment on competition in the bank market, using samples of banking sectors with different levels of development. Demirgüç-Kunt et al. (2004) examine the impact of bank-specific characteristics, bank regulations, market structure, and institutional environment on bank margins using bank-level data from 72 countries. Barth et al. (2004, 2006) examine the relationship between different aspects of bank regulations and supervisory practices and bank development, performance and stability, using a cross-country database. Claessens and Laeven (2004) examine the determinants of banking competition. The results obtained in the above studies show that more strictly regulated banking markets are less developed, less stable, and less competitive.
However, all the above-mentioned papers focus on analysis of bank market competition during normal times and there is no empirical evidence on how bank competition changes after a banking crisis or on how bank regulation and institutions influence the final effect of crises on bank market power. Our paper attempts to fill this gap by analyzing how banking crises affect the level of market power in a sample of 2290 banks from 64 developed and developing countries that have experienced at least one systemic banking crisis during the period 1989–2007. We use cross-country differences in bank regulation and institutions to assess the extent to which banking crises may impact bank market competition differently across countries.
Our paper makes several contributions to the literature. First, we provide direct evidence on the change in bank market competition after a systemic banking crisis, providing a bank- and country-level analysis in a sample of 64 developed and developing countries and 66 systemic banking crises over the 1989–2007 period. We also note that the severity of the crises in terms of output losses and fiscal costs may also explain the extent to which the crisis affects bank competition across countries. Moreover, the use of both datasets, at country- and bank-level, allows us to analyze differences in the impact of banking crises on the degree of bank market competition using different measures of bank market power.
Second, we consider that the impact of a systemic banking crisis on bank market power may be different across countries depending on bank market regulation and institutional development. We focus on legal restrictions on non-traditional banking activities and on bank requirements for entering the banking industry, as characteristics of bank regulation. As measures of institutional development we consider an index of efficiency of the legal system (rule of law) and a global measure of the quality of the institutional environment (the KKZ index). The availability of an international database allows us to incorporate these cross-country characteristics in the study.
Finally, we account for dynamic processes in banks’ and countries’ market power during periods of banking crises. We use a version of the generalized method of moments (GMM) for dynamic panel data models. Specifically, we use the system-GMM estimator developed by Blundell and Bond (1998). This method allows us to handle autoregressive properties in the dependent variable (country- and bank-level market power) as lagged values are included in the estimations. It also allows us to control for endogeneity in the explanatory variables and for any country- and bank-specific effects omitted from our specifications.
The results obtained indicate an increase of market power in the banking sector in both samples of countries and banks after a systemic banking crisis. We find that the positive effect of banking crises on bank market power is stronger in countries with less regulated bank markets and in more institutionally developed countries. Our results have important policy implications and reveal the relevance of bank regulation and institutions for shaping the influence of banking crisis episodes on bank market competition.
The rest of the paper is organized as follows. Section 2 presents in more detail the theory behind our empirical study. Section 3 describes the sample and the methodology used in the empirical analysis. Section 4 presents the empirical results and robustness tests, and Section 5 concludes.
2Theoretical background and hypothesesFollowing the developments of the New Industrial Organization theory, the degree of competition in a market requires the construction of a structural model and cannot be measured by market structure indicators (such as the number of institutions, concentration indexes, or ownership structure). Banking research examining the effects of banking competition on bank performance, bank risk, financial stability, firms’ access to finance, and economic growth, has been concerned about the differences between competition measures based on the market-structure approach and those based on structural models.
Fernández de Guevara and Maudos (2004), Fernández de Guevara et al. (2007), and Carbó and Rodríguez (2007), among others, used the Lerner index in the banking sector as a proxy inversely related with the level of competition. The results obtained in these papers indicate a reduction in bank competition during the 1990s, as the Lerner indexes increased during those years. Maudós and Fernández de Guevara (2004) show a reduction in the Lerner index in 10 of the 14 European banking markets analyzed during the 1993–2002 period. However, they find opposite results when they consider traditional and non-traditional banking activities separately. Their results suggest that the increase in market competition took place because of the traditional banking activities (in which the Lerner index decreased). In general terms, when other sources of interest revenues are considered (non-traditional activities), their results seem to indicate an increase in the Lerner index, consistent with lower levels of bank competition.
An alternative measure of bank competition is the H index developed by Panzar and Rosse (1987). This variable measures the extent to which changes in the different prices of inputs cause changes in the price of the final good or service. Using this measure, Molyneux et al. (1994), Bikker and Groeneveld (2000), De Bandt and Davis (2000) and Weill (2003) show the existence of monopolistic competition in different European bank markets. Claessens and Laeven (2004) show the determinants of the Panzar and Rosse (1987) index in a sample of 50 European bank markets. Most of the bank markets analyzed show situations of monopolistic competition and that there is not a clear relationship between the bank competition indicated by the H-index and the situation described by the assets ratio for bank market concentration.
In a more recent study, Carbó et al. (2009) compare the most traditional indicators of market competition in a sample of 14 European countries during the 1995–2001 period. They specifically consider the net interest margin, the Lerner index, the ROA, the H-statistic, and the Hirschman–Herfindahl index of bank market concentration (HHI index). Their results indicate the existence of important differences among these indicators across countries and years. Although previous literature also used these measures to estimate bank competition, they are, in fact, measuring different concepts. Moreover, the authors point to the importance of specific country-level factors to calculate the degree of competition in the banking sector. They indicate the need to control for country-level characteristics to analyze competition in European banking in comparative terms.
In this paper we analyze the extent to which banking crises influence bank market competition by using the Lerner index, constructed both at country- and at bank-level, as the industrial-organization variable, since previous literature has shown its relevance for accurately measuring the degree of bank market power.
2.1Banking crises and competitionThe literature has traditionally analyzed the effects of bank competition on financial stability but not how banking crises modify bank competition. However, the current global financial crisis highlights the relevance of reducing the negative real effect of systemic banking crises and opens a debate on the consequences of the consolidation process, as a result of mergers or acquisitions of failed banks, for the level of competition in the bank market.
Previous literature is not conclusive about the relationship between bank competition and financial stability. On the one hand, less competition could mean greater market power and profits for banks. Higher profits provide a “buffer” against adverse shocks and increase the bank's franchise value, which reduces incentives for bankers to take excessive risks (Matutes and Vives, 2000). On the other hand, some models predict that less bank competition increases the fragility of the bank market. Boyd and De Nicolo (2005) stress that in less competitive environments banks charge higher interest rates to firms, which are therefore prepared to take greater risks. Their model predicts that greater market power of banks increases both the expected rate of return on bank assets and the standard deviation of such returns. Moreover, if bank size is positively correlated with complexity, then large banks may be more difficult to monitor than small banks. Finally, some researchers argue that large banks are protected by implicit “too big to fail” policies that small banks do not enjoy. This protection intensifies risk-taking incentives beyond any diversification advantages enjoyed by large banks (Mishkin, 1999).
Given these conflicting theoretical predictions, Beck et al. (2006) analyze empirically the effect of bank market concentration as a determinant of banking crises. They find that bank market concentration is associated with a lower probability of banking crises. In a more recent paper, Jiménez et al. (2010) analyze on a sample of Spanish banks the relationship between bank market concentration and competition with risk management. They do not empirically obtain any relationship between the level of bank concentration and risk management. However, using the Lerner index, they find a negative relation between bank market power and risk management. Their results are consistent with banks reducing their risk exposure in order to preserve their franchise value, and show the relevance of using alternative variables to bank concentration to proxy for bank competition.
The effect of banking crises on bank competition is also unclear. On the one hand, banking crises reduce the number of banks operating in the bank market which may increase the market power of the surviving banks. It is common for the restructuring processes of banking sectors during and after periods of banking distress to involve the shutdown, merger or acquisition of failed banks. Traditionally, the results of these intervention policies decrease the number of banks in the market (Laeven and Valencia, 2008). Moreover, the surviving banks are those that are less affected by inefficiencies and solvency problems than the banks that disappear. The surviving banks tend to be the more efficient ones that can increase market share, reduce costs, and increase margins after the crisis (Berger, 1995). Both effects may justify an increase in bank market power.
On the other hand, bank market power could be reduced after a period of banking distress. In order to avoid new episodes of banking crises, banks may be less motivated to invest in risky activities. This may oblige banks to invest in safer, better-known, but less profitable, investment projects (Detragiache et al., 2000). As the risk of the investments is lower, the expected returns from them are also expected to be lower. This may lead to a reduction in bank margins, reducing bank market power.
Given that, theoretically, we can argue that the impact of banking crises on bank market power may go either way, we do not make any a priori hypothesis and treat it from an empirical point of view.
2.2Banking crises and competition: the influence of regulation and institutionsA number of recent papers have analyzed the effects of regulations limiting bank competition on bank development and stability. In a broad survey of rules governing banking systems, Barth et al. (2004, 2006) show that tighter entry requirements are negatively associated with bank efficiency, leading to higher interest rates and overhead expenditure, and that restricting foreign bank participation tends to increase bank fragility. These results are consistent with the idea that more stringent entry restrictions tend to limit competition. They emphasize that it is not the actual level of foreign presence or bank concentration but the contestability of a market that determines bank efficiency and stability.
In a cross-country study on banking structure, Claessens et al. (2001) investigate the role of foreign banks and show that entry by foreign banks makes domestic banking systems more efficient by reducing margins. Demirgüç-Kunt et al. (2004), using bank-level data from 70 countries and focusing on bank market concentration and regulations as sources of bank market power, find that the higher the level of bank market concentration the lower the efficiency of the banking system in less developed countries. They also provide empirical evidence that regulatory restrictions on entry and restrictions on bank activities reduce bank margins.
Considering that regulation and institutional quality help to explain bank market competition during normal times, we try to clarify the extent to which the effect of banking crises on bank market competition may vary across countries depending on bank regulation and institutional development.
2.2.1RegulationAs regulatory variables we specifically consider the influence of restrictions on non-traditional bank activities and entry restrictions for new banks. Restrictions on non-traditional bank activities may interact with banking crises and shape the influence of crises on bank market competition. Whether the effect of banking crises on bank market power changes across countries depending on legal restrictions on non-traditional banking activities is an empirical question. On the one hand, previous literature has shown that more restrictions on bank activities reduce the level of competition in the bank market (Claessens and Laeven, 2004). Countries with stricter bank regulation before the crisis are therefore expected to increase their bank market power less during the years after the crisis, as bank competition in that environment was lower before the banking distress.
On the other hand, the legal obligation to focus on deposits and loans favors specialization of traditional bank activities and may make the formation of lending relationships with firms more profitable for banks. Boot and Thakor (1997) have suggested that these hold-up problems take place more often in less competitive financial systems. If a banking crisis occurs, lending relationships may increase bank market power more as, in a distressed banking system, firms cannot easily choose which bank to get financing from.
Previous literature has shown that banks in countries with stricter regulation on bank entry have higher levels of market power (Claessens and Laeven, 2004). However, there is no evidence on the extent to which restrictions on bank entry may shape the influence of banking crises on bank market power, as all previous literature has focused on the effect of barriers to entry during normal periods. On the one hand, in countries where regulation on bank entry was strict during the years before the crisis (with the subsequent increase in market power during those years), the potential increase in the monopoly power of banks will not be significantly important.
On the other hand, restrictions on bank entry are expected to magnify a potential positive effect of banking crises on bank market power, as banking crises reduce the number of banks in the market (Laeven and Valencia, 2008) and regulation on entry restricts the number of entities operating in the banking sector much more.
In line with the above arguments, we cannot expect a clear relation among restrictions on non-traditional banking activities, regulation on bank entry, and bank market power after a banking crisis. Therefore, we do not posit any specific hypothesis and treat it as an empirical question.
2.2.2InstitutionsFinally, we analyze if institutional quality in a country shapes the influence of banking crises on the degree of competition in the bank market. The Law and Finance literature has shown that the higher the institutional quality, the higher the development of financial markets, the higher the financial stability, and the higher the economic growth. For a market to function well, firms must be able to rely on the enforceability of contracts. Weak legal systems and poor institutional infrastructure impede market development (La Porta et al., 1997, 1998; Demirgüç-Kunt and Maksimovic, 2002). In their industry-level study for normal periods, Rajan and Zingales (1998) argue that bank-based architecture survives and is more effective under weak systems, because banks can use their power to protect their interests in the absence of effective legal provision. Fernández et al. (2010) find that bank concentration is more beneficial for solving adverse selection and moral hazard problems between firms and banks in less developed markets that have poor institutional infrastructure. The lower level of competition in such markets may favor these relationships and thereby have a greater positive effect on economic growth during normal times.
The previous empirical evidence indicates that banking crises have a more depressive effect on the real economy in countries with a more developed institutional environment (Kroszner et al., 2007), as an environment where financial markets are well developed is an advantage for more financially dependent industries in good times, but a disadvantage in times of banking crises. Consistent with this result, and in a more recent paper, Fernández et al. (2013) analyze the extent to which bank competition, regulation, and institutions may shape the influence of banking crises on economic growth. Their results suggest that the higher the quality of institutions the higher the negative real effect associated with banking crises.
None of the above studies, however, analyze how different institutional quality may shape the influence of banking crises on the level of bank market power. Again, we may find opposite effects. On the one hand, if a banking crisis occurs in a country with more developed institutions and with more developed capital markets, bank market power may increase more, relatively, than in countries with a less developed institutional environment. This might be related to the fact that, in more institutionally developed countries, the level of competition in the bank market is higher because of antimonopoly policies (Barth et al., 2004, 2006). According to this argument, in these countries, bank market power would be lower before the crisis so there is more room for it to increase after the period of banking distress.
On the other hand, in less developed markets with weak legal systems and poor institutional infrastructure, after a banking crisis bank market power might help solve informational problems between firms and banks. The fact that it is difficult to develop markets in these environments may make long-term relationships between banks and debtors in less competitive banking sectors helpful for solving such problems. Therefore, we can expect bank market power to increase less after a crisis in countries with less developed institutions.
3Data and methodology3.1SampleWe use several main data sources. Bank-level information comes from the Fitch-IBCA Ltd. BankScope Database. BankScope contains comprehensive information on financial statements, ratings and intelligence of banks across the globe. Whenever available, we use consolidated bank balance-sheet and income-statement data. All data are expressed in US dollars and in real prices. As the BankScope Database began to provide information in 1989, we confine our analysis to the 1989–2007 period.
Macroeconomic data are obtained from the International Financial Statistics of the International Monetary Fund (IMF). We obtain information on banking crises and their degree of severity from Laeven and Valencia (2012). They provide information not only on the dates of banking crises in countries around the world during the 1970–2011 period but also on the outcomes of these crises in terms of output losses and fiscal costs.
The proxies for the regulatory variables for restrictions on bank activities and barriers to entry in the banking sector come from the World Bank's Bank Regulation and Supervision database (Barth et al., 2006). As proxies for the institutional quality of countries, we use the collection of data supported by The World Bank Institute's Governance Group. Using the Laeven and Valencia (2012) database, we initially select countries that experienced at least one systemic banking crisis over the period 1989–2007. We do not consider the current global financial crisis (2007/2008) since the absence of a post-crisis period does not let us to compare what happens before and after the crisis. We identify 78 countries that suffered at least one systemic banking crisis over the period 1989–2007. Due to the lack of data on bank market concentration and the limited bank-level data in Bankscope to estimate the Lerner index, 14 countries are excluded from the sample.1 Moreover, since we apply the GMM estimator with one lag of the dependent variable in the empirical analysis, banks with fewer than three consecutive years of data must also be excluded from the sample.
Therefore, our final sample is made up of an unbalanced panel for a maximum of 2290 banks in 64 developed and developing countries and 66 systemic banking crises that occurred during 1989–2007. This makes a total of 11,049 observations in our bank-level sample. Missing information on the severity of banking crises reduces the sample to 48, 39, and 34 countries, depending on the variable considered (output losses in percentage of GDP, fiscal costs in percentage of GDP or fiscal costs in percentage of financial sector assets, respectively). Missing information on bank regulatory variables reduces the sample to 40 countries when we analyze the influence of bank regulation.
3.2MethodologyWe apply the GMM estimator to address three relevant econometric issues: (1) control of unobservable bank heterogeneity; (2) the autoregressive process in data on the behavior of the dependent variables; and (3) potential endogeneity in the explanatory variables when we use bank-level data. The panel estimator controls for this potential endogeneity by using instruments based on lagged values of the explanatory variables. Specifically, we apply a two-step GMM system and specify the robust estimator of the variance–covariance matrix. This is a variant of the GMM estimation method originally proposed by Arellano and Bond (1991) and Arellano and Bover (1995) and improved by Blundell and Bond (1998) that combines the difference equation with a level equation to form a system of equations for estimation purposes. The GMM system estimator exhibits higher levels of both consistency and efficiency than the difference-in-difference estimator proposed by Arellano and Bond (1991) and allows for the use of time-invariant (or highly persistent) variables in our specifications.
The validity of the GMM system estimator approach rests on two testable assumptions. First, for the instruments to be valid, they need to be uncorrelated with the error term. We use the Hansen J-statistic of over-identifying restrictions to test this assumption (where statistically insignificant values confirm the validity of the instruments). Second, the GMM system estimator requires stationary in the post-instrumentation error terms. This implies the absence of second-order serial correlation in the first difference residual. We employ the m2 statistic developed by Arellano and Bond (1991) to test for a lack of second-order serial correlation in the first-difference residual. An insignificant m2 statistic indicates that the model is correctly specified.
3.2.1Basic modelOur basic model analyzes, both at country- and at bank-level, how banking crises affect the level of competition in the bank market. We focus on the role played by banking crises to shape the evolution of competitive conditions in the bank market by analyzing how the direct measure of bank market power (the Lerner index) changes from the pre-crisis to the post-crisis periods. We can write our basic equation as:
where i, j, and t denote the bank, country, and year, respectively. LERNERi,j,t measures the level of bank market power of bank i, in country j, in year t. Xi,j,t is a vector of bank-level variables potentially explaining the bank market power. Mj,t is a vector of macroeconomic variables. POSTCRISISj,t is a dummy variable that takes the value of one for the post-crisis period and zero for years in the pre-crisis period. The crisis period is omitted. SEVERITYj,t is a vector of three alternative variables identifying the severity of banking crises in terms of output losses and fiscal costs (Laeven and Valencia, 2012). θj is a set of country dummy variables to control for characteristics that are specific to each country and persistent over time. λt is a set of time dummy variables to capture any unobserved bank-invariant time effects not included in the regression. μi is a bank-specific effect, which is assumed to be constant for bank i over t, and εi,j,t is a white-noise error term.
In our specification, the POSTCRISIS coefficient α4 should capture how different bank market power is after a banking crisis in relation to the pre-crisis period. The coefficient α5 for the interaction between POSTCRISIS and SEVERITY should capture how the effect of a banking crisis on bank market power may vary depending on the degree of severity of the crisis.
Before examining the specific effect on bank market power, we consider an alternative country-level estimation in which we use the level of bank market concentration (CONCj,t) as the dependent variable. This specification allows us to test if, as previous literature has suggested, the level of concentration increases after a banking crisis as a consequence of restructuring processes.
3.2.2Extended model: influence of regulation and institutionsThe second model empirically explores if the impact of banking crises on bank market power may differ across countries depending on bank regulation and institutional quality. To test whether and how regulation and institutions shape the impact of banking crises on the competitive conditions in bank markets, we sequentially include an interaction term between the dummy variable that compares the pre-crisis and the post-crisis periods taking into account the severity of the crisis, and the particular country-level variable. This extended model is specified as follows:
where REGINSTj,t is a vector of variables indicating bank regulation and institutional characteristics in a country. The coefficient β5 of the triple interaction between POSTCRISIS, SEVERITY, and REGINST should capture how different the effect of the severity of a banking crisis on bank market power is in countries with very strict bank regulation and countries with well developed institutions. The inclusion of country and year control dummies means that regulatory and institutional variables do not need to be included in the regression individually. It allows us to focus only on the terms of their interaction.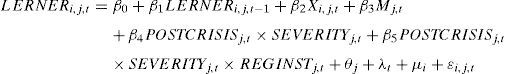
Below is a more detailed description of the variables included in our models.
- A.
Dependent variables
The Lerner index (LERNER) measures the level of bank market power, i.e., it is an inverse proxy for bank competition. The Lerner index has been widely used in the banking sector as an indicator of degree of market power (Beck et al., 2013). This index defines the difference between the price (interest rate) and marginal cost expressed as a percentage of price, taking into account that divergence between product price and marginal cost of production is the essence of monopoly power. It takes the value of 0 in the case of perfect competition and 1 under perfect monopoly. We estimate a single indicator of the Lerner index by country using the same procedure as Maudós and Fernández de Guevara (2004) and using individual bank data from Bankscope.
Bank market concentration (CONC) is calculated as the annual fraction of bank assets held by the three largest commercial banks in each country. Information on bank market concentration for each country comes from the World Bank's Financial Structure dataset updated in September 2012 (Beck and Demirgüç-Kunt, 2009). This measure has been widely used in previous papers such as Cetorelli and Gambera (2001), Demirgüç-Kunt et al. (2004), and Beck et al. (2006).
- B.
Bank-level and macroeconomic control variables
As bank-level variables potentially explaining bank market power, we include asset size, revenue growth, overhead costs, non-interest income and Z-score. Corvoisier and Gropp (2002) and Fernández de Guevara et al. (2005) have previously used these measures to explain bank market power.
We use the natural logarithm of total bank assets (SIZE) as a measure of bank size. Several studies predict a positive relation between bank size and market power based on the more dominant position of large banks relative to smaller ones (Freixas and Rochet, 1997, or Bikker and Bos, 2005, among others). The alternative view suggests that smaller banks tend to operate on local markets where competition is often weaker, while larger banks tend to operate on big national and international markets where competition is generally stronger due to the impact of foreign banks (Gilibert and Steinherr, 1989). The latter view is supported by the empirical literature based on the Panzar-Rosse model, which establishes a negative relation between bank size and market power (some recent examples are described in Bikker, 2004, and Koutsomanoli-Fillipaki and Staikouras, 2005).
Revenue growth (GROWTH) is the annual growth rate in total revenue of the bank. A higher growth rate in total revenue is expected to allow banks to increase their market power. Overhead costs (OVERHEAD) are personnel expenses and other non-interest expenses over total assets. This variable is included as a reverse proxy for bank efficiency. Introducing a measure of efficiency as an explanatory variable allows us to test the so-called efficient–structure hypothesis against the traditional structure–conduct–performance hypothesis. According to the efficient–structure hypothesis, more efficient banks with superior management or production technologies have lower overhead costs and higher profits. These banks would gain large market shares and as a result, greater market power (Berger, 1995).
We employ the non-interest income to total income ratio (NONINT) as a proxy for bank specialization. The literature on integration of financial markets shows a lower degree of integration and competition in retail bank markets than in wholesale market (Cabral et al., 2002; Hartmann et al., 2003). Since higher values for NONINT indicate lower retail activity and therefore less bank market power, this variable is expected to be negatively associated with the Lerner index.
Finally, we use the Z-score (ZSCORE) as a proxy for bank insolvency risk. This is the return on assets plus the capital-asset ratio divided by the standard deviation of asset returns. We use a five-year moving window to calculate the standard deviation of the standard deviation of asset returns. A higher Z-score indicates that the bank is more stable because it is inversely related with the bank insolvency probability. Since the Z-score is highly skewed, we use the natural logarithm of Z-score, which is normally distributed. Laeven and Levine (2009), Houston et al. (2010), Beck et al. (2013), among others, have recently used the Z-score as a proxy for bank insolvency risk. In the empirical analysis at country-level, we use the aggregated value by country and year of these bank-level variables. To do this, we calculate the weighted average of these variables taking into account the participation of the bank assets in the total assets of banking system.
Macroeconomic variables used as controls are the annual growth rate of the natural logarithm of real GDP per capita (ΔGDPpc) and inflation rate (INFLATION) of country j in year t. Higher levels of the annual growth rate of real GDP per capita might involve greater business opportunities for banks, yet the sign of the coefficient of this variable can be positive or negative (Angelini and Cetorelli, 2003). The impact of the inflation rate on bank market power is not a clear one a priori. Higher levels of inflation oblige banks to demand higher risk premiums (Angelini and Cetorelli, 2003), but bank costs may also be higher as higher inflation can imply a large number of transactions and an expansion of bank branches relative to the population (Demirgüç-Kunt and Huizinga, 2004). These variables have been used as country controls in several studies explaining bank market power (Corvoisier and Gropp, 2002; Fernández de Guevara et al., 2005).
- C.
Variables capturing the effect of banking crises
To capture the effect of a banking crisis, we define a dummy variable (POSTCRISIS) that takes a value of one for years in the post-crisis period and zero during the pre-crisis period. The crisis period is omitted in the regressions to avoid confounding effects. This dummy variable allows us to identify the differential effect of bank market power between the post-crisis and the pre-crisis period. We define the sub-periods around the banking crisis date following Kroszner et al. (2007), Dell’ Ariccia et al. (2008), Cubillas et al. (2012), or Fernández et al. (2013), among others. Since it is difficult to identify the crisis period and, specifically, the end of the banking crisis, we consider the crisis period as (t, t+2), where t is the inception date of the crisis as reported by Laeven and Valencia (2012). We define the pre-crisis period as (t0, t−1), where t0 is the first year in our sample period (1989). Finally, the post-crisis period is defined as (t+3, T), T being the final year in our sample (2007). When a country suffers more than one crisis in the period (for instance, Argentina and Democratic Republic of Congo), we estimate one single crisis. Thus, we define the crisis period as (ta, tb+2), where ta and tb are the crisis starting year corresponding to the first and the last crisis, respectively. Consequently, we define the pre-crisis period as (t0, ta−1) and the post-crisis period as (tb+3, T).
As proxies for the degree of severity of a banking crisis, we follow Laeven and Valencia (2012) and define three variables. OUTPUTLOSS is the amount of output losses from the crisis as a percentage of GDP; FISCALCOST is the amount of fiscal costs as a percentage of GDP; and FISCALCOSTFIN measures the percentage of fiscal costs over the total assets of the financial sector in each country. Output losses are computed by Laeven and Valencia (2012) as the cumulative sum of the differences between actual and real GDP over the period (t, t+3). As these authors indicate, fiscal costs are defined as the component of gross fiscal outlays related to the restructuring of the financial sector. They include fiscal costs associated with bank recapitalizations but exclude asset purchases and direct liquidity assistance from the treasury.
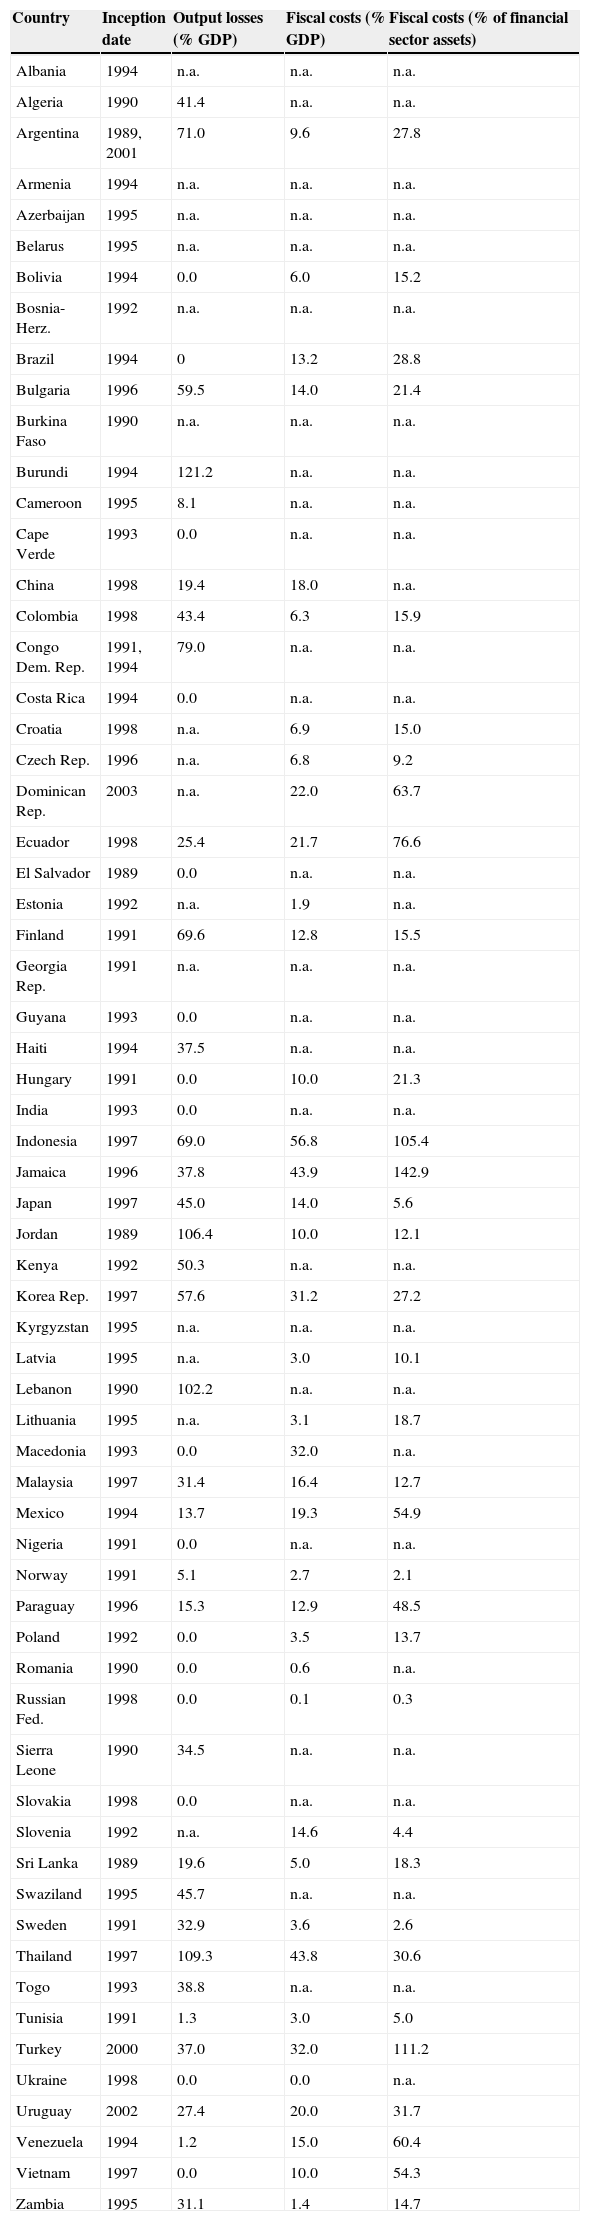
Table 1 shows the data we analyze on the year of inception of banking crises and their degree of severity according to the three variables described above.
- D.
Regulatory and institutional variables
Banking crises: dates and costs across countries.
| Country | Inception date | Output losses (% GDP) | Fiscal costs (% GDP) | Fiscal costs (% of financial sector assets) |
| Albania | 1994 | n.a. | n.a. | n.a. |
| Algeria | 1990 | 41.4 | n.a. | n.a. |
| Argentina | 1989, 2001 | 71.0 | 9.6 | 27.8 |
| Armenia | 1994 | n.a. | n.a. | n.a. |
| Azerbaijan | 1995 | n.a. | n.a. | n.a. |
| Belarus | 1995 | n.a. | n.a. | n.a. |
| Bolivia | 1994 | 0.0 | 6.0 | 15.2 |
| Bosnia-Herz. | 1992 | n.a. | n.a. | n.a. |
| Brazil | 1994 | 0 | 13.2 | 28.8 |
| Bulgaria | 1996 | 59.5 | 14.0 | 21.4 |
| Burkina Faso | 1990 | n.a. | n.a. | n.a. |
| Burundi | 1994 | 121.2 | n.a. | n.a. |
| Cameroon | 1995 | 8.1 | n.a. | n.a. |
| Cape Verde | 1993 | 0.0 | n.a. | n.a. |
| China | 1998 | 19.4 | 18.0 | n.a. |
| Colombia | 1998 | 43.4 | 6.3 | 15.9 |
| Congo Dem. Rep. | 1991, 1994 | 79.0 | n.a. | n.a. |
| Costa Rica | 1994 | 0.0 | n.a. | n.a. |
| Croatia | 1998 | n.a. | 6.9 | 15.0 |
| Czech Rep. | 1996 | n.a. | 6.8 | 9.2 |
| Dominican Rep. | 2003 | n.a. | 22.0 | 63.7 |
| Ecuador | 1998 | 25.4 | 21.7 | 76.6 |
| El Salvador | 1989 | 0.0 | n.a. | n.a. |
| Estonia | 1992 | n.a. | 1.9 | n.a. |
| Finland | 1991 | 69.6 | 12.8 | 15.5 |
| Georgia Rep. | 1991 | n.a. | n.a. | n.a. |
| Guyana | 1993 | 0.0 | n.a. | n.a. |
| Haiti | 1994 | 37.5 | n.a. | n.a. |
| Hungary | 1991 | 0.0 | 10.0 | 21.3 |
| India | 1993 | 0.0 | n.a. | n.a. |
| Indonesia | 1997 | 69.0 | 56.8 | 105.4 |
| Jamaica | 1996 | 37.8 | 43.9 | 142.9 |
| Japan | 1997 | 45.0 | 14.0 | 5.6 |
| Jordan | 1989 | 106.4 | 10.0 | 12.1 |
| Kenya | 1992 | 50.3 | n.a. | n.a. |
| Korea Rep. | 1997 | 57.6 | 31.2 | 27.2 |
| Kyrgyzstan | 1995 | n.a. | n.a. | n.a. |
| Latvia | 1995 | n.a. | 3.0 | 10.1 |
| Lebanon | 1990 | 102.2 | n.a. | n.a. |
| Lithuania | 1995 | n.a. | 3.1 | 18.7 |
| Macedonia | 1993 | 0.0 | 32.0 | n.a. |
| Malaysia | 1997 | 31.4 | 16.4 | 12.7 |
| Mexico | 1994 | 13.7 | 19.3 | 54.9 |
| Nigeria | 1991 | 0.0 | n.a. | n.a. |
| Norway | 1991 | 5.1 | 2.7 | 2.1 |
| Paraguay | 1996 | 15.3 | 12.9 | 48.5 |
| Poland | 1992 | 0.0 | 3.5 | 13.7 |
| Romania | 1990 | 0.0 | 0.6 | n.a. |
| Russian Fed. | 1998 | 0.0 | 0.1 | 0.3 |
| Sierra Leone | 1990 | 34.5 | n.a. | n.a. |
| Slovakia | 1998 | 0.0 | n.a. | n.a. |
| Slovenia | 1992 | n.a. | 14.6 | 4.4 |
| Sri Lanka | 1989 | 19.6 | 5.0 | 18.3 |
| Swaziland | 1995 | 45.7 | n.a. | n.a. |
| Sweden | 1991 | 32.9 | 3.6 | 2.6 |
| Thailand | 1997 | 109.3 | 43.8 | 30.6 |
| Togo | 1993 | 38.8 | n.a. | n.a. |
| Tunisia | 1991 | 1.3 | 3.0 | 5.0 |
| Turkey | 2000 | 37.0 | 32.0 | 111.2 |
| Ukraine | 1998 | 0.0 | 0.0 | n.a. |
| Uruguay | 2002 | 27.4 | 20.0 | 31.7 |
| Venezuela | 1994 | 1.2 | 15.0 | 60.4 |
| Vietnam | 1997 | 0.0 | 10.0 | 54.3 |
| Zambia | 1995 | 31.1 | 1.4 | 14.7 |
This table shows the inception dates of the banking crises and the severity of the crises measured by three different variables: Output losses that measures the crisis costs as a percentage of the GDP; Fiscal costs, calculated as the fiscal costs from the crisis over the GDP; and Fiscal costs as a proportion of the total amount of assets from the financial sector. The sample consists on 64 countries that experienced, at least, one systemic banking crisis during the 1989–2007 period following the Laeven and Valencia (2012) database.
We use three regulatory variables. The first is whether banks are allowed to take part in activities that generate non-interest income. This variable indicates whether bank activities in the securities, insurance, real estate markets, and participation on the ownership and control of non-financial firms are: (1) unrestricted, (2) permitted, (3) restricted, or (4) prohibited. This indicator, theoretically, can range from a minimum value of 4 to a maximum value of 16, where higher values indicate more restrictions on bank activities (RESTRICT1).
Second, we consider a regulatory index excluding the specific legal restrictions on bank ownership and control of non-financial firms (RESTRICT2). We exclude this legal restriction in order to analyze if the influence of restrictions on non-traditional banking activities on the impact of banking crises on bank market power remains after excluding regulations on the mix between banking and commerce. This variable can range, in theory, from a minimum value of 3 to a maximum value of 12. It is constructed giving value 1, 2, 3, or 4 if the banks activities in the securities, insurance, real estate markets are (1) unrestricted, (2) permitted, (3) restricted, or (4) prohibited. Therefore, higher values in this variable indicate more stringent regulation on non-traditional banking activities. Information on RESTRICT1 and RESTRICT2 comes from the World Bank's Bank Regulation and Supervision database described in Barth et al. (2006).
The third regulatory variable is an index measuring the legal requirements for entry into the banking industry (ENTRY). This variable measures barriers to entry by the number of documents required from applicants to obtain a banking license and operate in the sector. It is based on whether or not the following information is required: (1) draft by-laws; (2) intended organizational chart; (3) financial projections for first 3 years; (4) financial information on main potential shareholders; (5) background/experience of future directors; (6) background/experience of future managers; (7) sources of funds to be used to capitalize the new bank; and (8) market differentiation intended for the new bank. Each type of information is assigned a value of 1 if it is required and 0 otherwise. Thus, higher values indicate greater restrictiveness. In our sample ENTRY ranges from a minimum value of 3 to a maximum value of 8.
As institutional quality variables, we consider two alternative measures: the KKZ index (KKZ) and the Rule of Law indicator (RULE). The latter is directly obtained from The World Bank Institute's Governance Group database. Following Kaufman et al. (2001), we calculate the KKZ index as the average value of the six indicators of governance provided by The World Bank Institute's Governance Group: Voice and Accountability, Political Stability and Absence of Violence, Government Effectiveness, Regulatory Quality, Rule of Law, and Control of Corruption. These two variables have been a widely-used measure for the quality of institutions in a country. They can range from −2.5 to 2.5, with higher values indicating greater development of the institutional framework in the country.
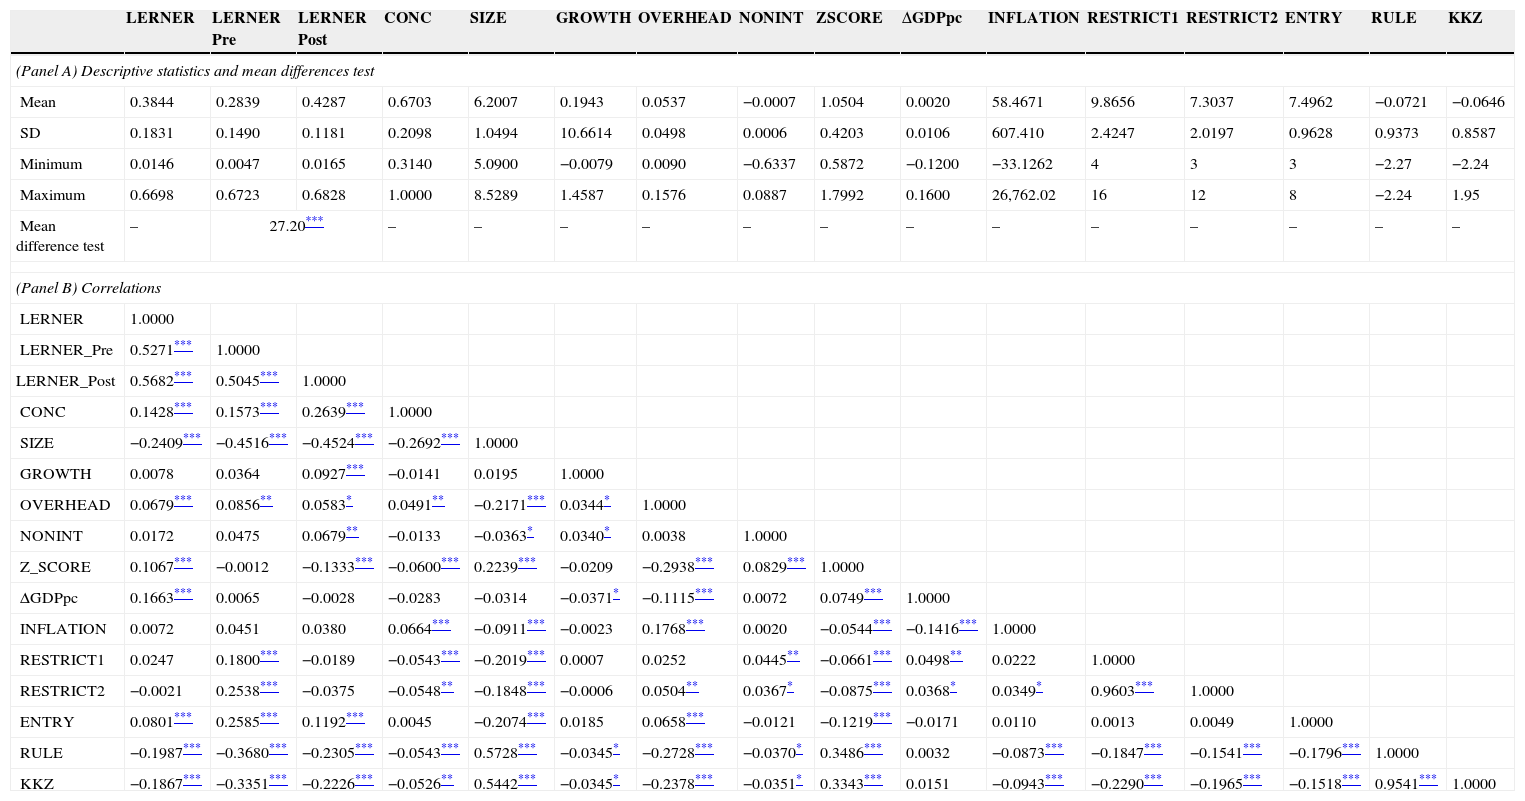
Table 2 reports descriptive statistics in Panel A and correlations in Panel B for bank-level, macroeconomic, regulatory, and institutional variables. Panel A shows that the mean value of market power is higher in the post-crisis period than in the pre-crisis period, and this difference between both periods is statistically significant. Moreover, the positive and statistically significant correlation between CONC and LERNER suggests, as expected, that in more concentrated banking sectors, the market power of banks operating in them is higher.
Descriptive statistics and correlations.
| LERNER | LERNER Pre | LERNER Post | CONC | SIZE | GROWTH | OVERHEAD | NONINT | ZSCORE | ΔGDPpc | INFLATION | RESTRICT1 | RESTRICT2 | ENTRY | RULE | KKZ | |
| (Panel A) Descriptive statistics and mean differences test | ||||||||||||||||
| Mean | 0.3844 | 0.2839 | 0.4287 | 0.6703 | 6.2007 | 0.1943 | 0.0537 | −0.0007 | 1.0504 | 0.0020 | 58.4671 | 9.8656 | 7.3037 | 7.4962 | −0.0721 | −0.0646 |
| SD | 0.1831 | 0.1490 | 0.1181 | 0.2098 | 1.0494 | 10.6614 | 0.0498 | 0.0006 | 0.4203 | 0.0106 | 607.410 | 2.4247 | 2.0197 | 0.9628 | 0.9373 | 0.8587 |
| Minimum | 0.0146 | 0.0047 | 0.0165 | 0.3140 | 5.0900 | −0.0079 | 0.0090 | −0.6337 | 0.5872 | −0.1200 | −33.1262 | 4 | 3 | 3 | −2.27 | −2.24 |
| Maximum | 0.6698 | 0.6723 | 0.6828 | 1.0000 | 8.5289 | 1.4587 | 0.1576 | 0.0887 | 1.7992 | 0.1600 | 26,762.02 | 16 | 12 | 8 | −2.24 | 1.95 |
| Mean difference test | – | 27.20*** | – | – | – | – | – | – | – | – | – | – | – | – | – | |
| (Panel B) Correlations | ||||||||||||||||
| LERNER | 1.0000 | |||||||||||||||
| LERNER_Pre | 0.5271*** | 1.0000 | ||||||||||||||
| LERNER_Post | 0.5682*** | 0.5045*** | 1.0000 | |||||||||||||
| CONC | 0.1428*** | 0.1573*** | 0.2639*** | 1.0000 | ||||||||||||
| SIZE | −0.2409*** | −0.4516*** | −0.4524*** | −0.2692*** | 1.0000 | |||||||||||
| GROWTH | 0.0078 | 0.0364 | 0.0927*** | −0.0141 | 0.0195 | 1.0000 | ||||||||||
| OVERHEAD | 0.0679*** | 0.0856** | 0.0583* | 0.0491** | −0.2171*** | 0.0344* | 1.0000 | |||||||||
| NONINT | 0.0172 | 0.0475 | 0.0679** | −0.0133 | −0.0363* | 0.0340* | 0.0038 | 1.0000 | ||||||||
| Z_SCORE | 0.1067*** | −0.0012 | −0.1333*** | −0.0600*** | 0.2239*** | −0.0209 | −0.2938*** | 0.0829*** | 1.0000 | |||||||
| ΔGDPpc | 0.1663*** | 0.0065 | −0.0028 | −0.0283 | −0.0314 | −0.0371* | −0.1115*** | 0.0072 | 0.0749*** | 1.0000 | ||||||
| INFLATION | 0.0072 | 0.0451 | 0.0380 | 0.0664*** | −0.0911*** | −0.0023 | 0.1768*** | 0.0020 | −0.0544*** | −0.1416*** | 1.0000 | |||||
| RESTRICT1 | 0.0247 | 0.1800*** | −0.0189 | −0.0543*** | −0.2019*** | 0.0007 | 0.0252 | 0.0445** | −0.0661*** | 0.0498** | 0.0222 | 1.0000 | ||||
| RESTRICT2 | −0.0021 | 0.2538*** | −0.0375 | −0.0548** | −0.1848*** | −0.0006 | 0.0504** | 0.0367* | −0.0875*** | 0.0368* | 0.0349* | 0.9603*** | 1.0000 | |||
| ENTRY | 0.0801*** | 0.2585*** | 0.1192*** | 0.0045 | −0.2074*** | 0.0185 | 0.0658*** | −0.0121 | −0.1219*** | −0.0171 | 0.0110 | 0.0013 | 0.0049 | 1.0000 | ||
| RULE | −0.1987*** | −0.3680*** | −0.2305*** | −0.0543*** | 0.5728*** | −0.0345* | −0.2728*** | −0.0370* | 0.3486*** | 0.0032 | −0.0873*** | −0.1847*** | −0.1541*** | −0.1796*** | 1.0000 | |
| KKZ | −0.1867*** | −0.3351*** | −0.2226*** | −0.0526** | 0.5442*** | −0.0345* | −0.2378*** | −0.0351* | 0.3343*** | 0.0151 | −0.0943*** | −0.2290*** | −0.1965*** | −0.1518*** | 0.9541*** | 1.0000 |
LERNER is a proxy for bank market power and it is defined as the difference between the price and the marginal cost, divided by the price. We show the average value of the Lerner index for the full sample of years (LERNER), for the years of the pre-crisis (LERNERPre), and the years after the crisis episode (LERNERPost). CONC is the fraction of assets of three largest banks as a share of assets of all commercial banks in a country. SIZE is the natural logarithm of total assets. GROWTH is the annual growth rate in total revenue of the bank. OVERHEAD is personnel expenses and other non-interest expenses over total assets. NONINT is the non-interest income to total revenue ratio. ZSCORE is the natural logarithm of Zscore, a proxy for insolvency risk that equals the return on assets plus the capital asset ratio divided by the standard deviation of asset returns. A five-year moving window is used to estimate the standard deviation of asset returns for each bank in each year. ΔGDPpc is the annual growth rate of the natural logarithm of real GDP per capita. INFLATION is the annual inflation rate. RESTRICT1 measures the extent to which bank activities on insurance, real state, securities, and ownership of non-financial firms are permitted on each country. RESTRICT2 measures the legal restrictions on bank activities on insurance, real state, and securities. ENTRY is an index that measures the legal restrictions to entry to operate into the banking industry. RULE and KKZ measure the quality of the institutional environment. Bank data are from the BankScope database of Fitch IBCA. Macro data are from the IMF's International Financial Statistics. Regulatory and institutional variables come from the World Bank's Bank Regulation and Supervision database (Barth et al., 2006) and World Bank Institute's Governance Group databases, respectively. The sample period is 1989–2007.
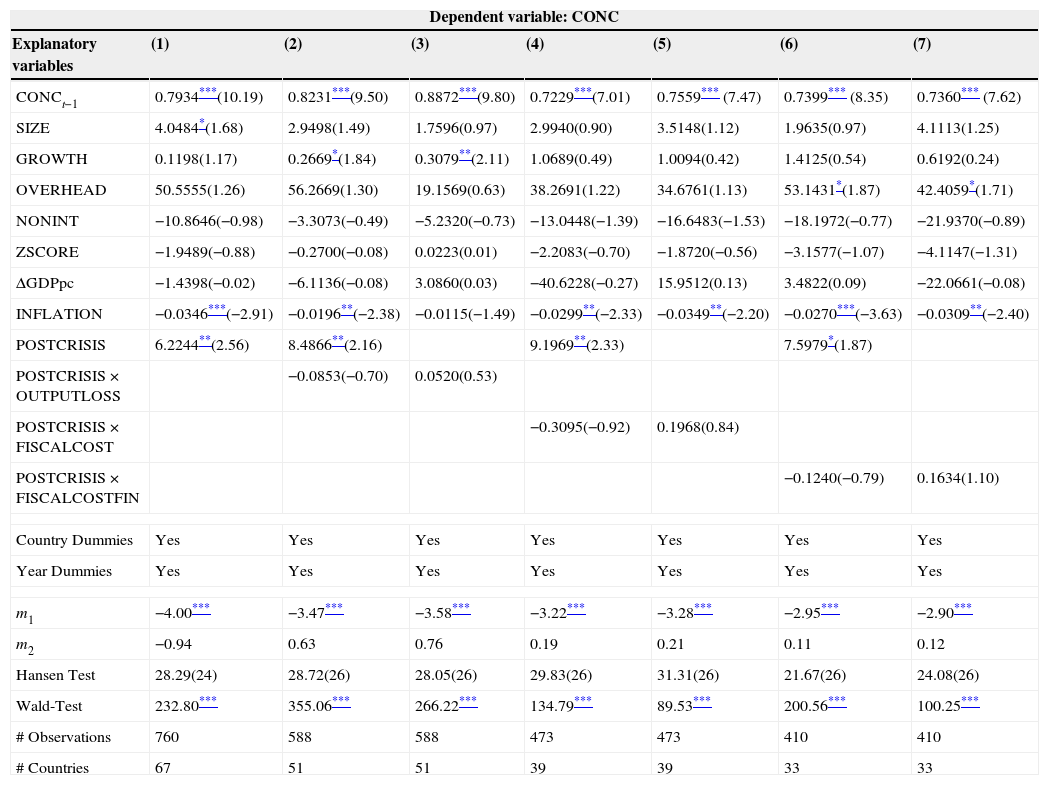
In this section we present the results for our basic model [1] explaining: (1) the impact of banking crises on bank concentration; (2) more relevantly, the effect on the Lerner index. Table 3 reports the results for the effect of a banking crisis on bank market concentration. The positive and significant coefficients of CONCjt−1 in all the estimations confirm the suitability of a partial adjustment model to explain the dynamic nature of bank concentration. In column (1), the dummy variable POSTCRISIS has a positive and statistically significant coefficient at conventional levels, indicating that bank market concentration increases after a banking crisis. This result is consistent with the restructuring processes that take place during (and, particularly, after) the crisis years in most countries (Laeven and Valencia, 2008). These processes lead to a more concentrated bank market because of the disappearance of non-profitable banks or the M&A waves that occur in the years after the banking distress. The variable POSTCRISIS keeps its sign and significance in all columns where it appears (columns (2), (4) and (6)). However, coefficients of the interactions between POSTCRISIS and each of our severity proxies are positive but non-significant in columns (2)–(7). This suggests that, regardless of the severity of a banking crisis, it increases the concentration of the bank market in subsequent years.
Banking crises and bank concentration: country-level estimations.
| Dependent variable: CONC | |||||||
| Explanatory variables | (1) | (2) | (3) | (4) | (5) | (6) | (7) |
| CONCt−1 | 0.7934***(10.19) | 0.8231***(9.50) | 0.8872***(9.80) | 0.7229***(7.01) | 0.7559*** (7.47) | 0.7399*** (8.35) | 0.7360*** (7.62) |
| SIZE | 4.0484*(1.68) | 2.9498(1.49) | 1.7596(0.97) | 2.9940(0.90) | 3.5148(1.12) | 1.9635(0.97) | 4.1113(1.25) |
| GROWTH | 0.1198(1.17) | 0.2669*(1.84) | 0.3079**(2.11) | 1.0689(0.49) | 1.0094(0.42) | 1.4125(0.54) | 0.6192(0.24) |
| OVERHEAD | 50.5555(1.26) | 56.2669(1.30) | 19.1569(0.63) | 38.2691(1.22) | 34.6761(1.13) | 53.1431*(1.87) | 42.4059*(1.71) |
| NONINT | −10.8646(−0.98) | −3.3073(−0.49) | −5.2320(−0.73) | −13.0448(−1.39) | −16.6483(−1.53) | −18.1972(−0.77) | −21.9370(−0.89) |
| ZSCORE | −1.9489(−0.88) | −0.2700(−0.08) | 0.0223(0.01) | −2.2083(−0.70) | −1.8720(−0.56) | −3.1577(−1.07) | −4.1147(−1.31) |
| ΔGDPpc | −1.4398(−0.02) | −6.1136(−0.08) | 3.0860(0.03) | −40.6228(−0.27) | 15.9512(0.13) | 3.4822(0.09) | −22.0661(−0.08) |
| INFLATION | −0.0346***(−2.91) | −0.0196**(−2.38) | −0.0115(−1.49) | −0.0299**(−2.33) | −0.0349**(−2.20) | −0.0270***(−3.63) | −0.0309**(−2.40) |
| POSTCRISIS | 6.2244**(2.56) | 8.4866**(2.16) | 9.1969**(2.33) | 7.5979*(1.87) | |||
| POSTCRISIS×OUTPUTLOSS | −0.0853(−0.70) | 0.0520(0.53) | |||||
| POSTCRISIS×FISCALCOST | −0.3095(−0.92) | 0.1968(0.84) | |||||
| POSTCRISIS×FISCALCOSTFIN | −0.1240(−0.79) | 0.1634(1.10) | |||||
| Country Dummies | Yes | Yes | Yes | Yes | Yes | Yes | Yes |
| Year Dummies | Yes | Yes | Yes | Yes | Yes | Yes | Yes |
| m1 | −4.00*** | −3.47*** | −3.58*** | −3.22*** | −3.28*** | −2.95*** | −2.90*** |
| m2 | −0.94 | 0.63 | 0.76 | 0.19 | 0.21 | 0.11 | 0.12 |
| Hansen Test | 28.29(24) | 28.72(26) | 28.05(26) | 29.83(26) | 31.31(26) | 21.67(26) | 24.08(26) |
| Wald-Test | 232.80*** | 355.06*** | 266.22*** | 134.79*** | 89.53*** | 200.56*** | 100.25*** |
| # Observations | 760 | 588 | 588 | 473 | 473 | 410 | 410 |
| # Countries | 67 | 51 | 51 | 39 | 39 | 33 | 33 |
Results showing the effect of banking crises on bank concentration. Regressions are estimated using the Blundell and Bond (1998) two-step system GMM estimator for dynamic panel data models. Our dependent variable is CONC. CONC is the bank concentration, measured as the fraction of assets of three largest banks as a share of assets of all commercial banks in a country. POSTCRISIS is a dummy variable that takes value 1 for the post-crisis period and 0 during the pre-crisis period. The crisis period is omitted. The pre-crisis period goes from t0 to t−1, where t0 is the first year of the sample and t is the inception date of the crisis. The crisis period goes from t to t+2, and the post-crisis period goes from t+3 to T, where T is the final year in our sample period. OUTPUTLOSS, FISCALCOST, and FISCALCOSTFIN are three alternative measures of the severity of the crisis. OUTPUTLOSS is the amount of losses from the crisis as a percentage of the GDP; FISCALCOST is the amount of fiscal costs over the GDP; FISCALCOSTFIN measures the percentage of fiscal costs over the total assets of the financial sector in each country. SIZE is the natural logarithm of total assets. GROWTH is the annual growth rate in total revenue of the bank. OVERHEAD is personnel expenses and other non-interest expenses over total assets. NONINT is the non-interest income to total revenue ratio. ZSCORE is the natural logarithm of Zscore, a proxy for insolvency risk that equals the return on assets plus the capital asset ratio divided by the standard deviation of asset returns. A five-year moving window is used to estimate the standard deviation of asset returns for each bank in each year. ΔGDPpc is the annual growth rate of the natural logarithm of real GDP per capita. INFLATION is the annual inflation rate. Bank data are from the BankScope database of Fitch IBCA. Macro data are from the IMF's International Financial Statistics. The sample period is 1989–2007.
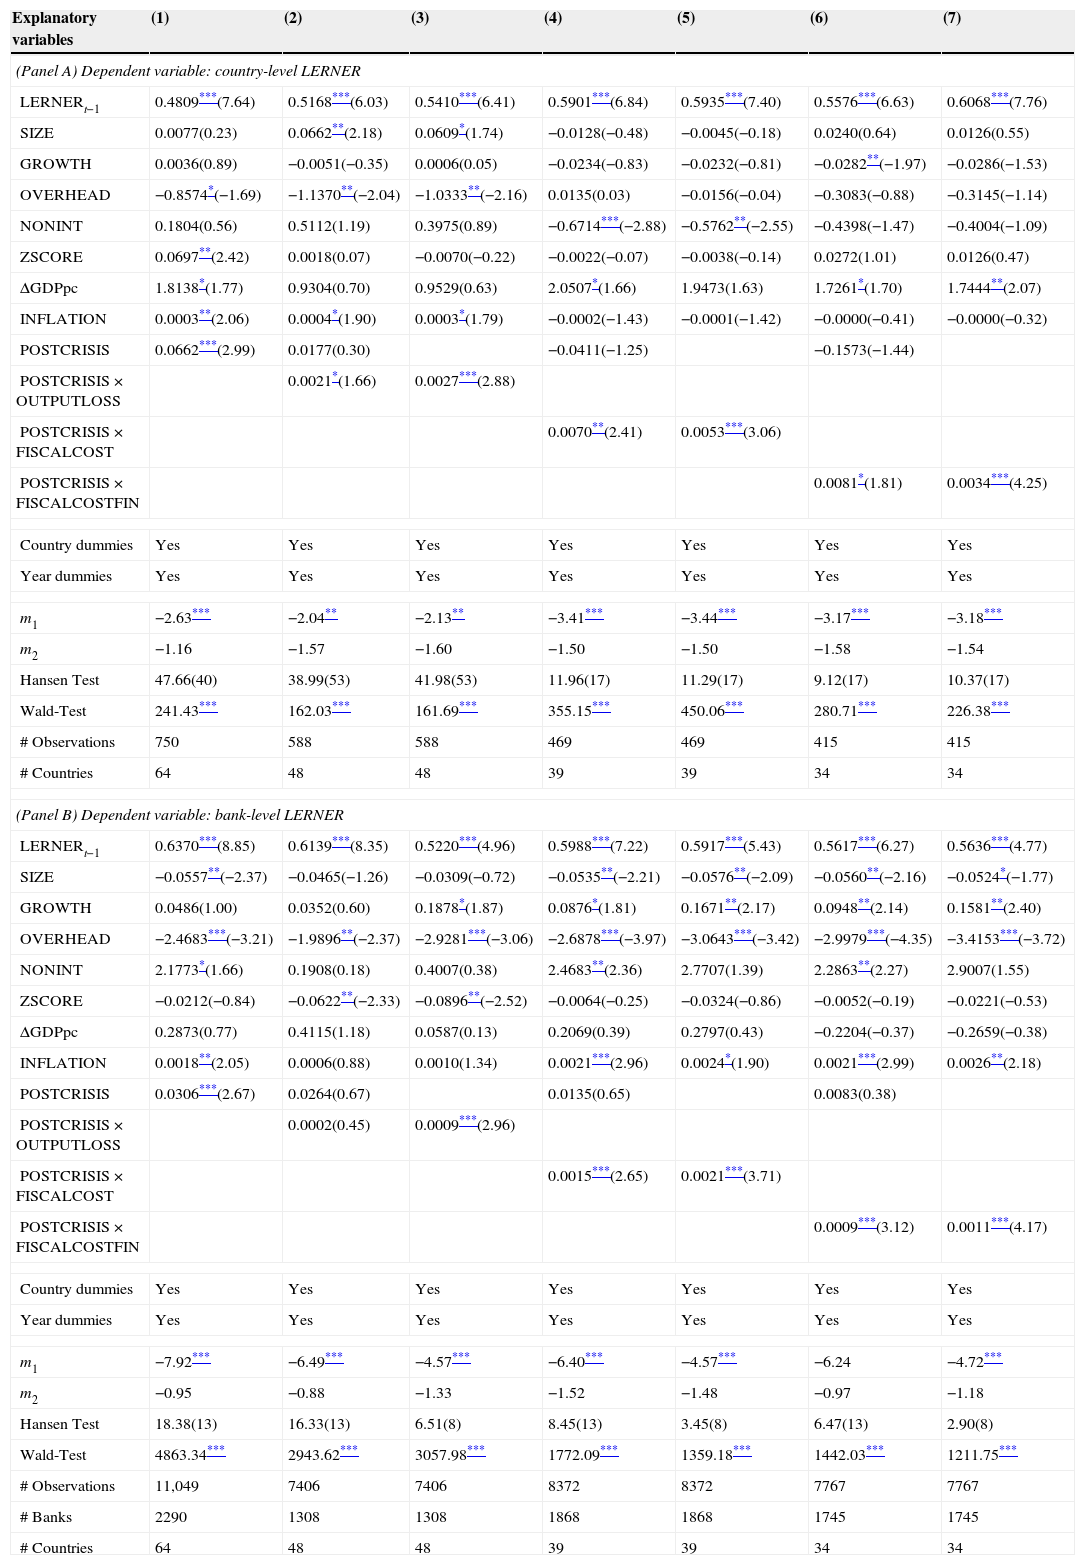
In Table 4 we present the results examining how bank market power changes after a crisis period, using both country-level (Panel A) and bank-level data (Panel B). In column (1) we firstly show the results when we exclude the POSTCRISIS×SEVERITY interaction in order to see how the fact that a country has suffered a banking crisis may affect bank market power in the years following the crisis episode. Columns (2), (4), and (6), show the results when we add the interaction term between POSTCRISIS and each of our severity proxies (OUTPUTLOSS, FISCALCOST, and FISCALCOSTFIN, respectively). Likewise, columns (3), (5), and (7), show the results when we consider these interaction terms but not the variable POSTCRISIS separately.
Banking crises and bank market power: country- and bank-level estimations.
| Explanatory variables | (1) | (2) | (3) | (4) | (5) | (6) | (7) |
| (Panel A) Dependent variable: country-level LERNER | |||||||
| LERNERt−1 | 0.4809***(7.64) | 0.5168***(6.03) | 0.5410***(6.41) | 0.5901***(6.84) | 0.5935***(7.40) | 0.5576***(6.63) | 0.6068***(7.76) |
| SIZE | 0.0077(0.23) | 0.0662**(2.18) | 0.0609*(1.74) | −0.0128(−0.48) | −0.0045(−0.18) | 0.0240(0.64) | 0.0126(0.55) |
| GROWTH | 0.0036(0.89) | −0.0051(−0.35) | 0.0006(0.05) | −0.0234(−0.83) | −0.0232(−0.81) | −0.0282**(−1.97) | −0.0286(−1.53) |
| OVERHEAD | −0.8574*(−1.69) | −1.1370**(−2.04) | −1.0333**(−2.16) | 0.0135(0.03) | −0.0156(−0.04) | −0.3083(−0.88) | −0.3145(−1.14) |
| NONINT | 0.1804(0.56) | 0.5112(1.19) | 0.3975(0.89) | −0.6714***(−2.88) | −0.5762**(−2.55) | −0.4398(−1.47) | −0.4004(−1.09) |
| ZSCORE | 0.0697**(2.42) | 0.0018(0.07) | −0.0070(−0.22) | −0.0022(−0.07) | −0.0038(−0.14) | 0.0272(1.01) | 0.0126(0.47) |
| ΔGDPpc | 1.8138*(1.77) | 0.9304(0.70) | 0.9529(0.63) | 2.0507*(1.66) | 1.9473(1.63) | 1.7261*(1.70) | 1.7444**(2.07) |
| INFLATION | 0.0003**(2.06) | 0.0004*(1.90) | 0.0003*(1.79) | −0.0002(−1.43) | −0.0001(−1.42) | −0.0000(−0.41) | −0.0000(−0.32) |
| POSTCRISIS | 0.0662***(2.99) | 0.0177(0.30) | −0.0411(−1.25) | −0.1573(−1.44) | |||
| POSTCRISIS×OUTPUTLOSS | 0.0021*(1.66) | 0.0027***(2.88) | |||||
| POSTCRISIS×FISCALCOST | 0.0070**(2.41) | 0.0053***(3.06) | |||||
| POSTCRISIS×FISCALCOSTFIN | 0.0081*(1.81) | 0.0034***(4.25) | |||||
| Country dummies | Yes | Yes | Yes | Yes | Yes | Yes | Yes |
| Year dummies | Yes | Yes | Yes | Yes | Yes | Yes | Yes |
| m1 | −2.63*** | −2.04** | −2.13** | −3.41*** | −3.44*** | −3.17*** | −3.18*** |
| m2 | −1.16 | −1.57 | −1.60 | −1.50 | −1.50 | −1.58 | −1.54 |
| Hansen Test | 47.66(40) | 38.99(53) | 41.98(53) | 11.96(17) | 11.29(17) | 9.12(17) | 10.37(17) |
| Wald-Test | 241.43*** | 162.03*** | 161.69*** | 355.15*** | 450.06*** | 280.71*** | 226.38*** |
| # Observations | 750 | 588 | 588 | 469 | 469 | 415 | 415 |
| # Countries | 64 | 48 | 48 | 39 | 39 | 34 | 34 |
| (Panel B) Dependent variable: bank-level LERNER | |||||||
| LERNERt−1 | 0.6370***(8.85) | 0.6139***(8.35) | 0.5220***(4.96) | 0.5988***(7.22) | 0.5917***(5.43) | 0.5617***(6.27) | 0.5636***(4.77) |
| SIZE | −0.0557**(−2.37) | −0.0465(−1.26) | −0.0309(−0.72) | −0.0535**(−2.21) | −0.0576**(−2.09) | −0.0560**(−2.16) | −0.0524*(−1.77) |
| GROWTH | 0.0486(1.00) | 0.0352(0.60) | 0.1878*(1.87) | 0.0876*(1.81) | 0.1671**(2.17) | 0.0948**(2.14) | 0.1581**(2.40) |
| OVERHEAD | −2.4683***(−3.21) | −1.9896**(−2.37) | −2.9281***(−3.06) | −2.6878***(−3.97) | −3.0643***(−3.42) | −2.9979***(−4.35) | −3.4153***(−3.72) |
| NONINT | 2.1773*(1.66) | 0.1908(0.18) | 0.4007(0.38) | 2.4683**(2.36) | 2.7707(1.39) | 2.2863**(2.27) | 2.9007(1.55) |
| ZSCORE | −0.0212(−0.84) | −0.0622**(−2.33) | −0.0896**(−2.52) | −0.0064(−0.25) | −0.0324(−0.86) | −0.0052(−0.19) | −0.0221(−0.53) |
| ΔGDPpc | 0.2873(0.77) | 0.4115(1.18) | 0.0587(0.13) | 0.2069(0.39) | 0.2797(0.43) | −0.2204(−0.37) | −0.2659(−0.38) |
| INFLATION | 0.0018**(2.05) | 0.0006(0.88) | 0.0010(1.34) | 0.0021***(2.96) | 0.0024*(1.90) | 0.0021***(2.99) | 0.0026**(2.18) |
| POSTCRISIS | 0.0306***(2.67) | 0.0264(0.67) | 0.0135(0.65) | 0.0083(0.38) | |||
| POSTCRISIS×OUTPUTLOSS | 0.0002(0.45) | 0.0009***(2.96) | |||||
| POSTCRISIS×FISCALCOST | 0.0015***(2.65) | 0.0021***(3.71) | |||||
| POSTCRISIS×FISCALCOSTFIN | 0.0009***(3.12) | 0.0011***(4.17) | |||||
| Country dummies | Yes | Yes | Yes | Yes | Yes | Yes | Yes |
| Year dummies | Yes | Yes | Yes | Yes | Yes | Yes | Yes |
| m1 | −7.92*** | −6.49*** | −4.57*** | −6.40*** | −4.57*** | −6.24 | −4.72*** |
| m2 | −0.95 | −0.88 | −1.33 | −1.52 | −1.48 | −0.97 | −1.18 |
| Hansen Test | 18.38(13) | 16.33(13) | 6.51(8) | 8.45(13) | 3.45(8) | 6.47(13) | 2.90(8) |
| Wald-Test | 4863.34*** | 2943.62*** | 3057.98*** | 1772.09*** | 1359.18*** | 1442.03*** | 1211.75*** |
| # Observations | 11,049 | 7406 | 7406 | 8372 | 8372 | 7767 | 7767 |
| # Banks | 2290 | 1308 | 1308 | 1868 | 1868 | 1745 | 1745 |
| # Countries | 64 | 48 | 48 | 39 | 39 | 34 | 34 |
Results showing the effect of banking crises on bank market power. Regressions are estimated using the Blundell and Bond (1998) two-step system GMM estimator for dynamic panel data models. Our dependent variable is LERNER. LERNER is a proxy for the bank market power, measured as the Lerner index, defined as the difference between the price and the marginal cost, divided by the price POSTCRISIS is a dummy variable that takes value 1 for the post-crisis period and 0 during the pre-crisis period. The crisis period is omitted. The pre-crisis period goes from t0 to t−1, where t0 is the first year of the sample and t is the inception date of the crisis. The crisis period goes from t to t+2, and the post-crisis period goes from t+3 to T, where T is the final year in our sample period. OUTPUTLOSS, FISCALCOST, and FISCALCOSTFIN are three alternative measures of the severity of the crisis. OUTPUTLOSS is the amount of losses from the crisis as a percentage of the GDP; FISCALCOST is the amount of fiscal costs over the GDP; FISCALCOSTFIN measures the percentage of fiscal costs over the total assets of the financial sector in each country. SIZE is the natural logarithm of total assets. GROWTH is the annual growth rate in total revenue of the bank. OVERHEAD is personnel expenses and other non-interest expenses over total assets. NONINT is the non-interest income to total revenue ratio. ZSCORE is the natural logarithm of Zscore, a proxy for insolvency risk that equals the return on assets plus the capital asset ratio divided by the standard deviation of asset returns. A five-year moving window is used to estimate the standard deviation of asset returns for each bank in each year. ΔGDPpc is the annual growth rate of the natural logarithm of real GDP per capita. INFLATION is the annual inflation rate. Bank data are from the BankScope database of Fitch IBCA. Macro data are from the IMF's International Financial Statistics. The sample period is 1989–2007.
In Panel A of Table 4 we report the results using the Lerner index calculated at country-level as the dependent variable. In all estimations we obtain a positive and significant coefficient for the lagged value of the dependent variable (LERNERjt−1) indicating that there is a dynamic process in the banking market that leads to the search for a target point for bank market power.
In column (1), the coefficient of POSTCRISIS is positive and statistically significant at the one percent level indicating that bank market power increases in the post-crisis period compared to before the crisis. This result is consistent with the previous one. In more concentrated banking markets, surviving banks that have absorbed the failed ones are expected to have greater market power.
In columns (2), (4), and (6) where the respective interaction terms are included with our three proxies for severity, the variable POSTCRISIS loses its significance. However, coefficients of these interactions are positive and statistically significant in columns (2)–(7), whatever the severity proxy we use. This suggests that, unlike what happens with bank concentration, what is mainly responsible for increased bank market power after a banking crisis is not the crisis episode itself but its severity in terms of output losses and fiscal costs.
Regarding other control variables, banks’ asset size (SIZE) is positively associated with bank market power in almost all estimations of Panel A, although coefficients are only statistically significant at conventional levels in columns (2) and (3). GROWTH is negative and statistically significant in column (6). Coefficients for NONINT are negative and significant at one and five percent, respectively, in columns (4) and (5). This result confirms the higher degree of integration and competition in bank markets with a lower retail activity. ZSCORE has a positive and statistically coefficient in column (1) of Panel A, indicating that a lower insolvency risk implies a higher relative margin and therefore greater bank market power. In relation to macroeconomic variables, the annual growth rate of the natural logarithm of GDP per capita has positive and significant coefficients in four estimations of Panel A where the country-level Lerner index is the dependent variable. Results for INFLATION show positive and significant coefficients in three cases to explain the level of bank market power.
The hypothesis of the absence of second-order serial correlation in the first-difference residuals is not rejected and confirms the consistency of the GMM estimates in all regressions. The non-significant values of the Hansen test confirm the validity of the instruments in all the estimations.
In relation to the bank-level results reported in Panel B of Table 4, the positive and significant coefficients of LERNERijt−1 in all the estimations confirm the suitability of a partial adjustment model to explain the dynamic nature of bank market power. In column (1), the dummy variable POSTCRISIS has a positive and statistically significant coefficient at the one percent level confirming the results obtained in the country-level analysis. In the remaining columns, this variable is not significant. However, the interaction terms between it and our three proxies for severity (OUTPUTLOSS, FISCALCOST, and FISCALCOSTFIN) show positive and statistically significant coefficients in all estimations except in column (3). Therefore, the results of our bank-level analysis corroborate the importance of the severity of a banking crisis for increasing bank market power in the years following the crisis.
Regarding other control variables, SIZE is negatively associated with the Lerner index and its coefficients are statistically significant in five estimations. This is consistent with the view that smaller banks tend to operate on local markets where competition is weaker and larger banks tend to operate on bigger markets with stronger competition. As expected, GROWTH shows positive and statistically significant coefficients in columns (3)–(7). Surprisingly, coefficients for NONINT are positive and coefficients for ZSCORE are negative, although both are statistically significant in a few cases. In relation to macroeconomic variables, the variable of annual growth rate of the natural logarithm of GDP per capita has non-significant coefficients and INFLATION shows positive and significant coefficients to explain bank market power in almost all estimations.
The m2 and Hansen J-statistics allow us to reject the null hypothesis of the absence of second-order serial correlation in the first-difference residuals and confirm the validity of the instruments in all estimations.
4.2Banking crises and bank market power: the influence of regulation and institutionsIn this section we present the results at both country- and bank-level on how the effect of a banking crisis on bank market power may vary across countries depending on their bank regulation and institutional quality.
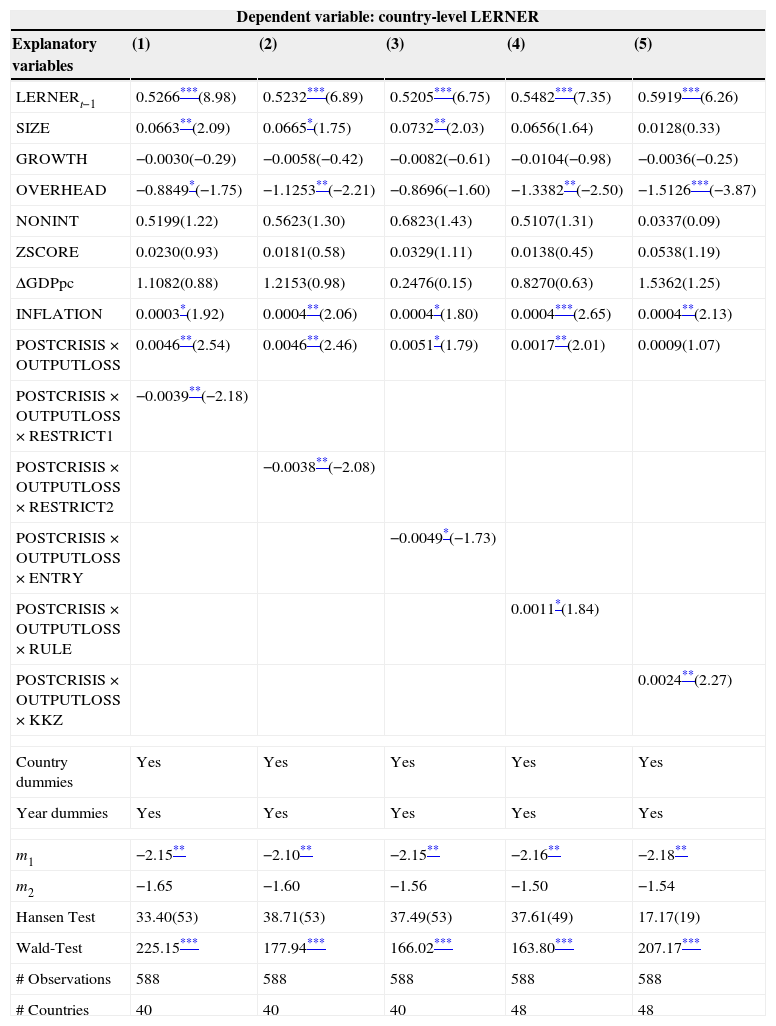
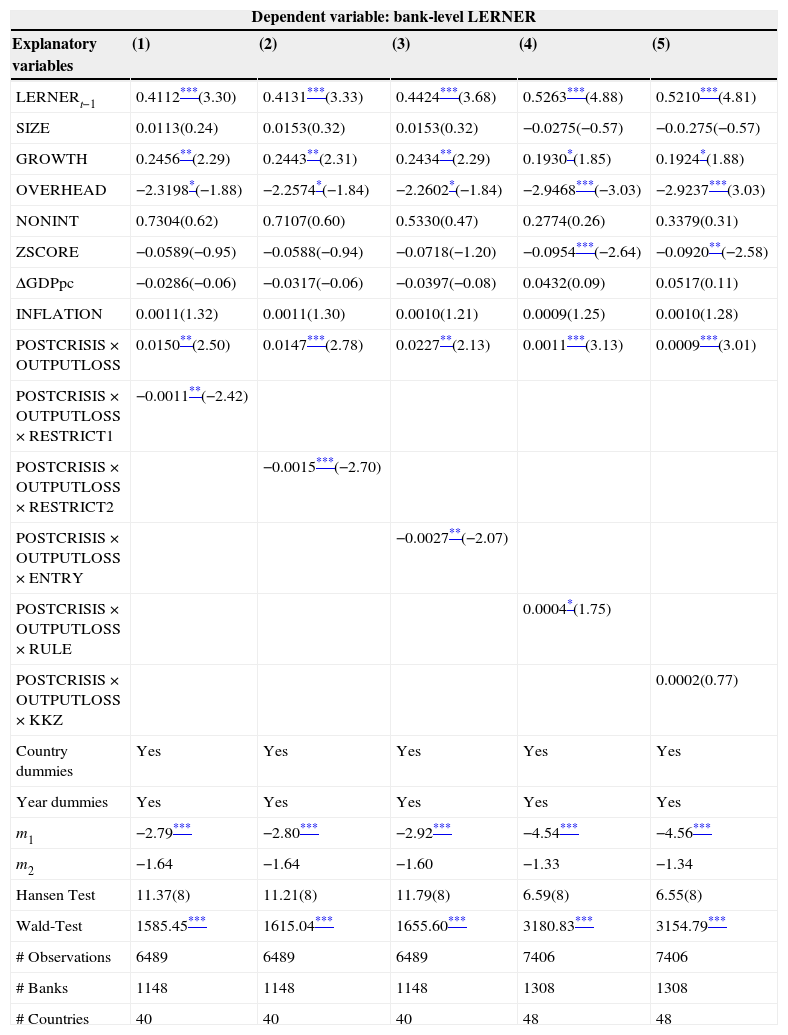
Table 5 reports the results for the country-level regressions, while Table 6 shows the results for the bank-level analysis. After the results in the previous section, we control in all the estimations for the severity of a crisis and then focus on the interaction between POSTCRISIS and OUTPUTLOSS. Moreover, we include now an additional interaction term between this variable and each one of our proxies for bank regulation and institutional quality.2
Banking crises, bank market power, regulations, and institutions: country-level estimations.
| Dependent variable: country-level LERNER | |||||
| Explanatory variables | (1) | (2) | (3) | (4) | (5) |
| LERNERt−1 | 0.5266***(8.98) | 0.5232***(6.89) | 0.5205***(6.75) | 0.5482***(7.35) | 0.5919***(6.26) |
| SIZE | 0.0663**(2.09) | 0.0665*(1.75) | 0.0732**(2.03) | 0.0656(1.64) | 0.0128(0.33) |
| GROWTH | −0.0030(−0.29) | −0.0058(−0.42) | −0.0082(−0.61) | −0.0104(−0.98) | −0.0036(−0.25) |
| OVERHEAD | −0.8849*(−1.75) | −1.1253**(−2.21) | −0.8696(−1.60) | −1.3382**(−2.50) | −1.5126***(−3.87) |
| NONINT | 0.5199(1.22) | 0.5623(1.30) | 0.6823(1.43) | 0.5107(1.31) | 0.0337(0.09) |
| ZSCORE | 0.0230(0.93) | 0.0181(0.58) | 0.0329(1.11) | 0.0138(0.45) | 0.0538(1.19) |
| ΔGDPpc | 1.1082(0.88) | 1.2153(0.98) | 0.2476(0.15) | 0.8270(0.63) | 1.5362(1.25) |
| INFLATION | 0.0003*(1.92) | 0.0004**(2.06) | 0.0004*(1.80) | 0.0004***(2.65) | 0.0004**(2.13) |
| POSTCRISIS×OUTPUTLOSS | 0.0046**(2.54) | 0.0046**(2.46) | 0.0051*(1.79) | 0.0017**(2.01) | 0.0009(1.07) |
| POSTCRISIS×OUTPUTLOSS×RESTRICT1 | −0.0039**(−2.18) | ||||
| POSTCRISIS×OUTPUTLOSS×RESTRICT2 | −0.0038**(−2.08) | ||||
| POSTCRISIS×OUTPUTLOSS×ENTRY | −0.0049*(−1.73) | ||||
| POSTCRISIS×OUTPUTLOSS×RULE | 0.0011*(1.84) | ||||
| POSTCRISIS×OUTPUTLOSS×KKZ | 0.0024**(2.27) | ||||
| Country dummies | Yes | Yes | Yes | Yes | Yes |
| Year dummies | Yes | Yes | Yes | Yes | Yes |
| m1 | −2.15** | −2.10** | −2.15** | −2.16** | −2.18** |
| m2 | −1.65 | −1.60 | −1.56 | −1.50 | −1.54 |
| Hansen Test | 33.40(53) | 38.71(53) | 37.49(53) | 37.61(49) | 17.17(19) |
| Wald-Test | 225.15*** | 177.94*** | 166.02*** | 163.80*** | 207.17*** |
| # Observations | 588 | 588 | 588 | 588 | 588 |
| # Countries | 40 | 40 | 40 | 48 | 48 |
Results showing the effect of banking crises, regulation, and institutions on bank market power on each country. Regressions are estimated using the Blundell and Bond (1998) two-step system GMM estimator for dynamic panel data models. Our dependent variable is the Lerner index, defined as the difference between the price and the marginal cost, divided by the price. POSTCRISIS is a dummy variable that takes value 1 for the post-crisis period and 0 during the pre-crisis period. The crisis period is omitted. The pre-crisis period goes from t0 to t−1, where t0 is the first year of the sample and t is the inception date of the crisis. The crisis period goes from t to t+2, and the post-crisis period goes from t+3 to T, where T is the final year in our sample period. OUTPUTLOSS is the amount of losses from the crisis as a percentage of the GDP. SIZE is the natural logarithm of total assets. GROWTH is the annual growth rate in total revenue of the bank. OVERHEAD is personnel expenses and other non-interest expenses over total assets. NONINT is the non-interest income to total revenue ratio. ZSCORE is the natural logarithm of Zscore, a proxy for insolvency risk that equals the return on assets plus the capital asset ratio divided by the standard deviation of asset returns. A five-year moving window is used to estimate the standard deviation of asset returns for each bank in each year. ΔGDPpc is the annual growth rate of the natural logarithm of real GDP per capita. INFLATION is the annual inflation rate.RESTRICT1 measures the extent to which bank activities on insurance, real state, securities, and ownership of non-financial firms are permitted on each country. RESTRICT2 measures the legal restrictions on bank activities on insurance, real state, and securities. ENTRY is an index that measures the legal restrictions to entry to operate into the banking industry. RULE and KKZ measure the quality of the institutional environment. Bank data are from the BankScope database of Fitch IBCA. Macro data are from the IMF's International Financial Statistics. Regulatory and institutional variables come from the World Bank's Bank Regulation and Supervision database (Barth et al., 2006) and World Bank Institute's Governance Group databases, respectively. The sample period is 1989–2007.
Banking crises, bank market power, regulations, and institutions: bank-level estimations.
| Dependent variable: bank-level LERNER | |||||
| Explanatory variables | (1) | (2) | (3) | (4) | (5) |
| LERNERt−1 | 0.4112***(3.30) | 0.4131***(3.33) | 0.4424***(3.68) | 0.5263***(4.88) | 0.5210***(4.81) |
| SIZE | 0.0113(0.24) | 0.0153(0.32) | 0.0153(0.32) | −0.0275(−0.57) | −0.0.275(−0.57) |
| GROWTH | 0.2456**(2.29) | 0.2443**(2.31) | 0.2434**(2.29) | 0.1930*(1.85) | 0.1924*(1.88) |
| OVERHEAD | −2.3198*(−1.88) | −2.2574*(−1.84) | −2.2602*(−1.84) | −2.9468***(−3.03) | −2.9237***(3.03) |
| NONINT | 0.7304(0.62) | 0.7107(0.60) | 0.5330(0.47) | 0.2774(0.26) | 0.3379(0.31) |
| ZSCORE | −0.0589(−0.95) | −0.0588(−0.94) | −0.0718(−1.20) | −0.0954***(−2.64) | −0.0920**(−2.58) |
| ΔGDPpc | −0.0286(−0.06) | −0.0317(−0.06) | −0.0397(−0.08) | 0.0432(0.09) | 0.0517(0.11) |
| INFLATION | 0.0011(1.32) | 0.0011(1.30) | 0.0010(1.21) | 0.0009(1.25) | 0.0010(1.28) |
| POSTCRISIS×OUTPUTLOSS | 0.0150**(2.50) | 0.0147***(2.78) | 0.0227**(2.13) | 0.0011***(3.13) | 0.0009***(3.01) |
| POSTCRISIS×OUTPUTLOSS×RESTRICT1 | −0.0011**(−2.42) | ||||
| POSTCRISIS×OUTPUTLOSS×RESTRICT2 | −0.0015***(−2.70) | ||||
| POSTCRISIS×OUTPUTLOSS×ENTRY | −0.0027**(−2.07) | ||||
| POSTCRISIS×OUTPUTLOSS×RULE | 0.0004*(1.75) | ||||
| POSTCRISIS×OUTPUTLOSS×KKZ | 0.0002(0.77) | ||||
| Country dummies | Yes | Yes | Yes | Yes | Yes |
| Year dummies | Yes | Yes | Yes | Yes | Yes |
| m1 | −2.79*** | −2.80*** | −2.92*** | −4.54*** | −4.56*** |
| m2 | −1.64 | −1.64 | −1.60 | −1.33 | −1.34 |
| Hansen Test | 11.37(8) | 11.21(8) | 11.79(8) | 6.59(8) | 6.55(8) |
| Wald-Test | 1585.45*** | 1615.04*** | 1655.60*** | 3180.83*** | 3154.79*** |
| # Observations | 6489 | 6489 | 6489 | 7406 | 7406 |
| # Banks | 1148 | 1148 | 1148 | 1308 | 1308 |
| # Countries | 40 | 40 | 40 | 48 | 48 |
Results showing the effect of banking crises, regulation, and institutions on bank market power on each country. Regressions are estimated using the Blundell and Bond (1998) two-step system GMM estimator for dynamic panel data models. Our dependent variable is the Lerner index, defined as the difference between the price and the marginal cost, divided by the price. POSTCRISIS is a dummy variable that takes value 1 for the post-crisis period and 0 during the pre-crisis period. The crisis period is omitted. The pre-crisis period goes from t0 to t−1, where t0 is the first year of the sample and t is the inception date of the crisis. The crisis period goes from t to t+2, and the post-crisis period goes from t+3 to T, where T is the final year in our sample period. OUTPUTLOSS is the amount of losses from the crisis as a percentage of the GDP. SIZE is the natural logarithm of total assets. GROWTH is the annual growth rate in total revenue of the bank. OVERHEAD is personnel expenses and other non-interest expenses over total assets. NONINT is the non-interest income to total revenue ratio. ZSCORE is the natural logarithm of Zscore, a proxy for insolvency risk that equals the return on assets plus the capital asset ratio divided by the standard deviation of asset returns. A five-year moving window is used to estimate the standard deviation of asset returns for each bank in each year. ΔGDPpc is the annual growth rate of the natural logarithm of real GDP per capita. INFLATION is the annual inflation rate.RESTRICT1 measures the extent to which bank activities on insurance, real state, securities, and ownership of non-financial firms are permitted on each country. RESTRICT2 measures the legal restrictions on bank activities on insurance, real state, and securities. ENTRY is an index that measures the legal restrictions to entry to operate into the banking industry. RULE and KKZ measure the quality of the institutional environment. Bank data are from the BankScope database of Fitch IBCA. Macro data are from the IMF's International Financial Statistics. Regulatory and institutional variables come from the World Bank's Bank Regulation and Supervision database (Barth et al., 2006) and World Bank Institute's Governance Group databases, respectively. The sample period is 1989–2007.
In both Tables 5 and 6, columns (1), (2), and (3) refer to bank regulation variables and columns (4) and (5) refer to institutional quality variables. Results at country- and bank-level are very similar. In both cases, coefficients of interaction terms between the variable POSTCRISIS×OUTPUTLOSS and the respective country-level variable are negative when the country variables are RESTRICT1, RESTRICT2, or ENTRY (columns (1), (2), and (3)). These results indicate that the increase in bank market power in the years after a severe banking crisis is lower in countries with stricter restrictions on non-traditional bank activities (securities, insurance, real estate markets, and participation in the ownership and control of non-financial firms). This also happens when we exclude the latter activity in order to not consider regulations on the mixing between banking and commerce. In countries with stricter barriers to bank entry, the effect of a severe banking crisis on increasing bank market power is also weaker. These findings are consistent with the fact that stricter restrictions on bank activities and bank entry do not favor competition. Therefore, in countries with these characteristics, if the market power of banks was higher before the crisis, there is a smaller margin to increase it after.
On the other hand, coefficients of interaction terms between the variable POSTCRISIS×OUTPUTLOSS and the respective country-level variable are positive when the country variables are KKZ or RULE. However, in column (5) of Table 6, the sign of the interactive term POSTCRISIS×OUTPUTLOSS×KKZ, although positive, is not statistically significant at conventional levels. These results indicate that the increase in bank market power in the years after a severe banking crisis is greater in countries with greater institutional development. This is consistent with the fact that, in more developed countries with high-quality institutions, bank competition is promoted. This means that, in such countries, bank market power would be lower before the crisis and there is a larger margin to increase it after.
We obtain similar coefficients for the control variables to those reported in previous tables. The m2 statistic and Hansen J-statistic, respectively, allow us to reject the lack of second-order serial correlation in the first-difference residuals and to confirm the validity of the instruments in all estimations.
4.3Robustness testsIn further analysis we check for the robustness of the results. First, we include the crisis period in our analysis. In this case, we employ two dummy variables: (1) POSTCRISIS takes a value of one for years after the crisis period and zero both for the pre-crisis and crisis periods; that is from t0 to t+3, where t is the year of inception of the banking crisis; (2) CRISIS takes a value of one during the three years of the crisis period (t, t+3). Our main results do not vary since the variable POSTCRISIS shows positive coefficients corroborating the increase in bank market power after a banking crisis. Coefficients for the CRISIS dummy are positive but statistically non-significant.
Second, apart from using the Rule of Law indicator and KKZ index as proxies for countries’ institutional quality, we also consider variables indicating countries’ economic development. Specifically, we use a dummy variable that classifies countries according to their income level (Beck and Demirgüç-Kunt, 2009) and a dummy that takes a value of one when the real GDP percentage is higher than the median value of distribution of the sample, and zero otherwise. In the bank-level analysis, coefficients for the respective interaction terms between POSTCRISIS×OUTPUTLOSS and each one of these two variables (ECONDEVELOP and ABOVEMEDIANGDP) are positive and statistically significant, suggesting that in countries with higher economic development favoring bank competition, the increase in bank market power in the years after a severe banking crisis is greater.
5ConclusionsThis paper analyzes how a banking crisis affects bank market power in an international sample of 64 countries over the period before the current global financial crisis (1989–2007). We also study whether and how this effect varies depending on the degree of severity of the crisis and across countries depending on their bank regulation and institutional quality.
From country- and bank-level data, we provide empirical evidence on the increase in bank market power in the years after banking crisis that is consistent with the processes of restructuring that often occur during episodes of financial distress. The disappearance of failed banks, mergers or absorption of banks with insolvency problems by others imply an increase in the level of bank market concentration that seems to increase the market power of surviving banks. Moreover, the greater the severity of the crisis, the higher the increase experienced by banks in terms of market power in the following years.
Our results also indicate that the effect is stronger in countries with more competitive banking systems before the crisis. Bank competition is greater in countries with less strict restrictions on non-traditional bank activities and fewer barriers to bank entry so banks operating in the sector will probably enjoy a greater market power. Likewise, in countries with well-developed institutions promoting bank competition, the increase in market power after the crisis will be more pronounced.
The results obtained from this research show the importance of taking into account the costs associated with certain bank restructuring measures adopted by governments during and after periods of banking crises to reduce bank competition. Our findings also show that these costs would be especially high in countries where regulation and institutions favored bank competition in the years before a financial crisis.
These 14 countries are: Central African Republic, Chad, Guinea-Bissau, Guinea, Djibouti, Eritrea, Liberia, Nicaragua, Philippines, Republic of Congo, Sao Tome Principe, Uganda, Yemen, and Zimbabwe.
We select OUTPUTLOSS as a proxy for banking crisis severity because it is available for more countries (48) than FISCALCOST (39 countries) or FISCALCOSTFIN (34 countries). The results do not change when we use alternatively FISCALCOST or FISCALCOSTFIN.

