


The aim of the paper is to analyze the effect of European financial integration on economic growth. We focus on how the international financial crisis that started in 2007 has affected integration and growth. By combining information at country, sector and firm level, we quantify the effect of financial integration on financial development and therefore on economic growth. Our results illustrate that until the outbreak of the crisis, a significant part of financial development is attributable to progress in integration, with a positive contribution of around 0.04pp to the EU-15 countries’ GDP growth over the period 1999–2007 of advance in integration. However, during the crisis, the decrease in the degree of integration has had a negative impact on financial development and economic growth. Consequently, the European banking union is essential given the economic benefits associated with financial integration.
Among the issues brought to light by the current crisis is the key role the financial sector plays in developed economies. The international financial crisis that started in the summer of 2007 with the subprime crisis in the U.S. and became more widespread since the summer of 2008 (especially after the collapse of Lehman Brothers) has meant a dramatic decline in their activity. At the same time market values plunged, public debt became refuge markets during the peak of the crisis, at certain moments even presenting zero returns. However, after the improvements observed in 2009 in some segments of the financial markets, in 2010 the worsening fiscal conditions in several Euro area countries affected the bond, and money markets, in a context of a sovereign debt crisis. The subsequent period of instability was so intensive that the possibility of a euro break-up was even considered. It was the action of the ECB supporting the euro in the summer of 2012, and the decisions taken by European leaders to set up a banking union, which has allowed some recovery of the previous degree of financial integration and the normalization, to some extent, of the smooth functioning of the financial markets.
Banking activity also fell significantly owing to various factors. Distrust between institutions caused a decline in the market value of interbank transactions. The first stages of the crisis also saw bank credit plunge in the most developed countries, given that financial institutions were forced to restructure their balance sheets due to either exposure to toxic assets or excessive concentration in real estate markets, or both. During this period, intervention in Europe was needed to recapitalize numerous banks. The high level of indebtedness of some economies (both in the public and private sectors) and the increasing deterioration of bank assets determine the chances of recovery of credit, which is important for some European countries. Moreover, the fragmentation of the financial market has increased the cost of credit in the distressed countries, hindering the investment recovery.
Once the financial turmoil exploded, it spread rapidly to the rest of the economy, having a virulent impact. As a result of all these factors mentioned above, many of the economies around the world have entered one of the worst recessions since the 1929 crash and the Great Depression of the 1930s. Never before have economic agents and the media as a whole been so aware of the importance of the financial sector in the economy. This importance stems from the fact that it is the financial sector which provides investors with the financial surplus of ultimate savers. As a result, either directly in the markets or indirectly through financial intermediaries, this sector helps to finance investment and thus output and employment growth. Furthermore, it makes a direct contribution to economic growth, representing 5.2% of GDP and 2.8% of employment (data for 2011) in the Euro area in the most recent years available.
European authorities have also been aware of the importance of development and financial integration for economic performance for one reason: financial integration contributes to the development of the financial system by increasing competition, enhancing stability, expanding markets and increasing the efficiency of financial intermediaries, thereby resulting in lower intermediation costs and a more efficient allocation of capital (Obstfeld, 1994). In addition, financial integration increases the depth and liquidity of financial markets, and consequently enhances the resilience of the European financial system. It also offers greater scope for geographical risk diversification, promoting consumption and income risk sharing. But as Brezigar et al. (2008) point, financial integration can also stimulate growth indirectly by means of improvements in the institutional framework (improved regulation and corporate governance). This will enhance the overall stability and reduce problems of asymmetric information. Another channel of influence of financial integration on growth is by allowing domestic firms to access foreign financial markets (direct lending and listing on foreign stock markets).
It was precisely for these reasons that the integration process of financial markets started in the mid 1980s in the EU, with the objective of achieving a single perfectly integrated internal market. Among the measures implemented were the first and second banking directives, freedom of capital movements, the harmonization of deposit insurance, the introduction of the Euro, the Financial Services Action Plan (FSAP), etc. In general, the studies available illustrate that, at least until the beginning of the financial crisis, the integration process indeed advanced (much more so in the wholesale markets than in retail), and that it had a positive effect on economic growth (see European Central Bank, 2012; CRA International, 2009, among others).
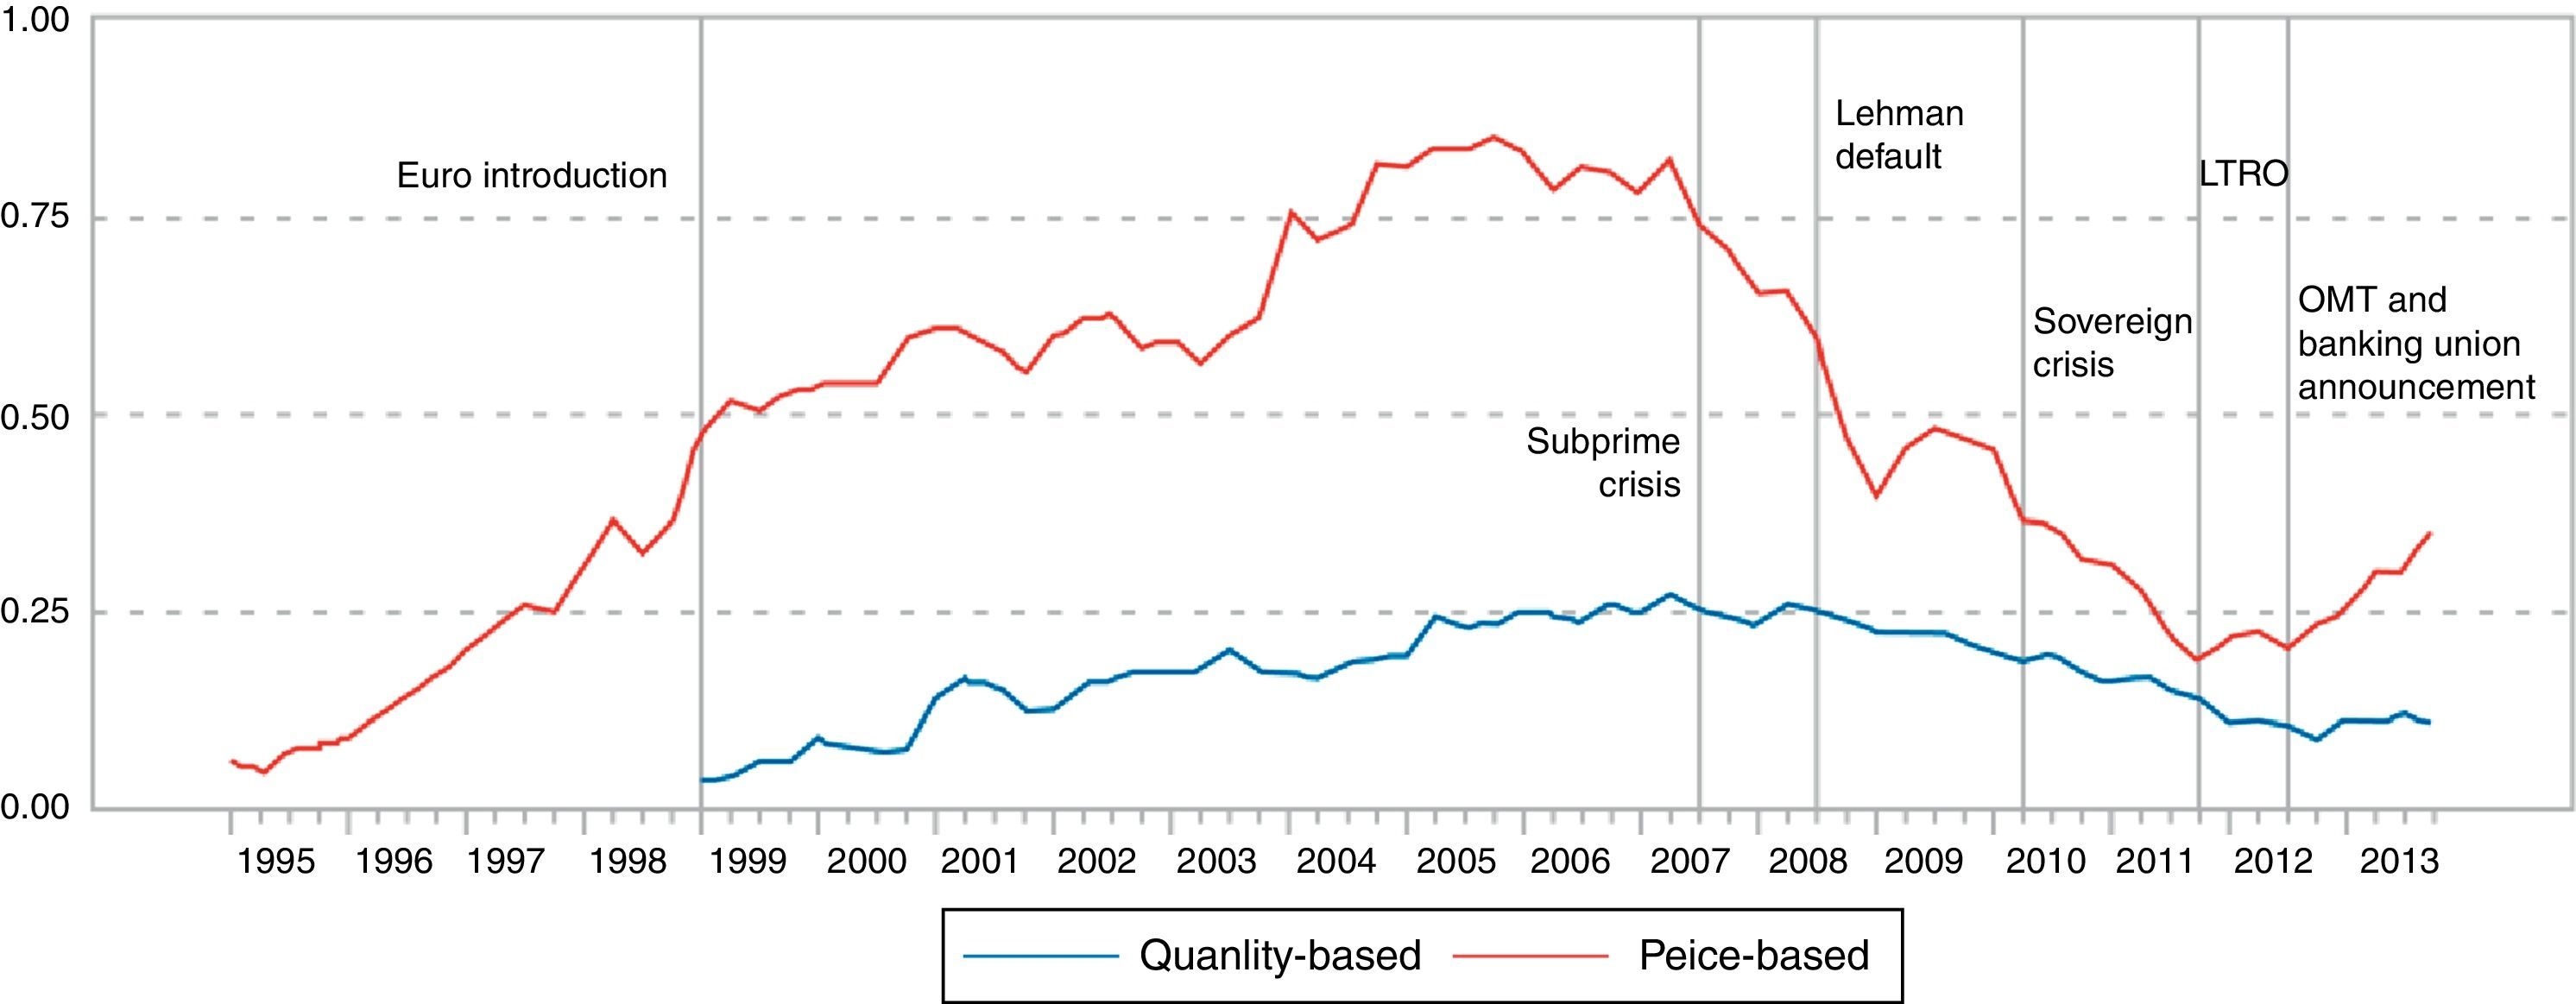
The financial turmoil that started in mid 2007 in the USA and rapidly spread to the rest of the world was a shock of such magnitude that it has affected not only the level of financial flows but also the progress of financial integration in Europe. In fact, the reports of the European Central Bank noted a slowdown and even a reversal of the financial integration process, although the effect is uneven across different market segments. Thus, as Fig. 1 shows, the new synthetic indicator of financial integration of the ECB1 shows the damage caused by the financial crisis, as it triggered fragmentation to reach levels similar to those seen before the euro was introduced.

One of the reasons for this decline in financial integration is the protectionist measures implemented by some countries as a reaction to the turmoil, along with a preference for national institutions (with the increase in the home bias), given the lack of trust in international markets. Fortunately, the initial isolated responses gave way to coordinated measures as the creation of a new architecture of financial supervision in Europe (with three new European Supervisory Authorities), a new Basel agreement on bank regulation (Basel III) and the establishment of the European Financial Stabilization Mechanism (EFSM) and the European Financial Stability Facility (EFSF) with the aim of reducing tensions in the Euro area sovereign markets. More recently, the measures adopted by the ECB in September 2012 (OMT program) and the banking union announcement have reduced the financial instability and improved the degree of integration.
In this context, it is therefore fundamental to examine how the crisis has affected financial integration, and by this means to quantify its impact on economic growth. Furthermore, it will be useful to compare the impact of the crisis over an extensive time period and assess the financial integration process as a whole rather than merely over the last years. The aim of our paper is to analyze the impact of financial integration on the economic growth of Euro area countries since the introduction of the Euro and the implementation of the FSAP in 1999, quantifying the differential impact of the financial crisis and disintegration over the period 2008–2012. In order to achieve this, our work evaluates the part of financial development growth which is attributable to financial integration over the period analyzed, so as to isolate its contribution to growth. Thus, we decompose the total financial development observed in each EU country into a component related to financial integration and into another component which could be considered “pure” financial development. By doing this, it is also possible to quantify the impact of the crisis on integration and economic growth.
The results illustrate that both financial development and integration have been important driving forces behind the growth of European economies. In fact, from 1999 to 2007 estimations show that financial development contributed with 0.23 percentage points (pp) per year to the GDP growth of the EU-15, thus explaining 9.5% of annual GDP growth. The contribution was found to be highest in those countries which had increased more their level of financial development. However, following the international crisis, there has been a fall in the growth of financial flows, and the contribution of financial development to GDP growth is negative in some countries. In the case of the contribution of the process of financial integration, progress made until 2007 accounts for an important part of financial development growth (around 45%), with a contribution to GDP growth of around 0.04pp per year. However, due to the crisis, there has been a decrease in the level of financial integration and in its contribution to financial development. In fact, the decrease in the degree of integration has had a negative impact on GDP growth in the period 2008–2012.
Our paper is structured as follows. Section 2 reviews the literature analyzing the impact of financial integration on economic growth. Sections 3 and 4 outline the methodology used to measure the impact of development and financial integration on economic growth (the finance–growth nexus), and also to decompose the part of observed financial development which is due to integration. The effect of financial development and integration on growth is evaluated in Section 5, while summary and conclusion are presented in the last section.
2Financial integration and economic growth: backgroundSeveral survey papers and collections of articles analyze the different channels through which financial integration affects economic growth. Financial integration: (a) facilitates the functions carried out by the financial systems (to intermediate funds from ultimate borrowers and lenders of the economy), leading a better risk sharing and diversification; (b) allows economic agents to access more sources of funding, increasing the supply of funds for investment opportunities; and (c) fosters competition and the efficiency in the task of financial intermediation, reducing intermediation costs and bank margins. Thus, financial integration translates into a reduction in the cost of intermediation, a more efficient allocation of capital, a better access to the markets, and an increase in portfolio diversification. Through all these channels, a higher degree of financial integration implies more financial development and, therefore, economic growth.
There are only a few papers that estimate the impact of financial integration on economic growth. Two studies supported by the European Commission are particularly worth mentioning: one by London Economics (2002) in association with PricewaterhouseCoopers and Oxford Economic Forecasting, and the other study by Guiso et al. (2004).
The first study focuses on examining how integration affects the reduction of financing costs in debt and equity markets, as well as the cost of bank financing. The report's findings suggest that integration in European financial markets represents 1.1% long-term GDP growth and 0.5% employment. The largest contribution to growth (45%) comes from the reduction in the cost of equity capital. The contribution of bank financing is lower and even negligible for the bond market. The results show significant differences between countries in terms of the potential benefits of integration.
Guiso et al. (2004) analyze the economic impact of financial integration by evaluating its expected impact on the level of financial development. That is, after the authors quantified the effect of financial development on growth using the methodology of Rajan and Zingales (1998), they simulated a scenario of a single financial market in Europe, with a similar level of financial development to that of the United States. Indeed, as confirmed by the indicators which compare financial development in Europe and the United States, the degree of total capitalization (market capitalization+bonds+loans to private sector) as a percentage of GDP is higher in the U.S. than in most EU countries. However, the effect on growth is simulated in a second scenario that controls the influence that other institutional variables2 might have on the level of financial development.
In the first scenario, the manufacturing industry's potential growth of value added amounted to 0.72% per year, representing 0.2% of GDP of the EU assuming a zero impact of integration on the other sectors of the economy. In the second scenario, the estimation is downward corrected taking into account the effect of other variables that affect financial development. The contribution of financial integration in this case is 0.53pp.
Recently, Fernández de Guevara et al. (2013) have analyzed how the increase and the subsequent decrease in the European financial integration have affected investment in the non-financial sector. They do not find any effect of financial integration on investment growth through the channel of financial depth (increase in financial development). However, the interest rates surge in numerous EU countries (the distressed countries) since the beginning of the crisis is associated with more rapid declines in investment. To the extent that financial disintegration has played a role in these interest rate increases, it has likely decreased investment. They also show that in a scenario of full integration, in which bank funding cost would converge to the minimum value observed in the EU, it could lead to an increase of 4.2pp in annual investment growth. Consequently, they conclude that completing the European banking union is the single most important step toward realizing this scenario.
The studies carried out until now, apart from that of Fernández de Guevara et al. (2013), are limited given that they quantify the potential benefit of financial integration in a scenario of full integration corresponding to a single European market (which does not reflect reality, especially in retail markets, as shown by different studies). However, the economic impact related to the effective advance of integration has not been estimated. The contribution of our work is therefore to evaluate the economic impact of the progress achieved to date in the degree of financial integration. Moreover, unlike the work of Guiso et al. (2004), the estimated impacts cover the total economy including not only the manufacturing sector but also all sectors of the economy.
3Methodology: financial development and growthTo analyze the impact of financial integration on economic growth, we follow the strategy of Guiso et al. (2004) who justify that financial integration has a positive impact on financial development through increased competition and improvements in national regulations. Financial development in turn promotes growth via a reduction in the costs of financial intermediation and an improvement in the allocation of capital. Thus, it is possible to estimate the impact of financial integration on growth throughout its effect on financial development.
The impact of financial development on economic growth has already been estimated in Maudos and Fernández de Guevara (2011). This work applies the methodology of Rajan and Zingales (1998), and quantifies the effect of financial development on economic growth. The intuition of the Rajan and Zingales’ methodology is simple, and is based on testing whether the sectors most dependent on external finance present higher growth rates in countries with a higher level of financial development, once the characteristics of the different sectors and countries have been controlled for.
Maudos and Fernández de Guevara (2011) apply the specification of Rajan and Zingales (1998) using a sample of 53 sectors in 21 countries over the period 1993–2003. The main advantage of that paper is that they extend the sector coverage of the sample including the services sectors, whereas, up until then, the Rajan and Zingales methodology had been tested in several papers only for the manufacturing sector (for example, Rajan and Zingales, 1998; Cetorelli and Gambera, 2001; Claessens and Laeven, 2005; Raddatz, 2006; Laeven and Valencia, 2011; Arcand et al., 2012; etc.). Furthermore, this paper updates the financial dependence indicator, calculating it for a more recent period (mid 1990s to early 2000s) instead of the original indicator calculated for the 1980s by Rajan and Zingales (1998), and used in most of the papers that apply this methodology. Maudos and Fernández de Guevara (2011) calculate the indicator of financial development using balance-sheet data obtained at firm level (9.087 firms) from AMADEUS (Bureau Van Dijk). As a benchmark for the indicator of financial dependence, they use the average of the external financial dependence of listed UK firms, instead of US firms as Rajan and Zingales (1998) did. The election of the UK as a benchmark is justified for 3 reasons: (a) UK is one of the European countries with the highest level of financial development; (b) it has a sufficiently diversified economy as to have listed companies in most sectors; and (c) the database used to measure the financial dependence only covers European countries.3
Real sectorial growth used in Maudos and Fernández de Guevara (2011) is obtained from the 60-Industry Database (Groninghenn Growth and Development Centre) which offers the evolution of value added of 26 countries broken down in 57 sectors (classified in ISIC rev. 3). These authors calculate the impact of financial development on economic growth for the period 1993–2003, which is somewhat different to the period we are using in this paper (1999–2008). Therefore, we adopt the assumption that the impact of financial development on growth is constant over time (at least in the last years).
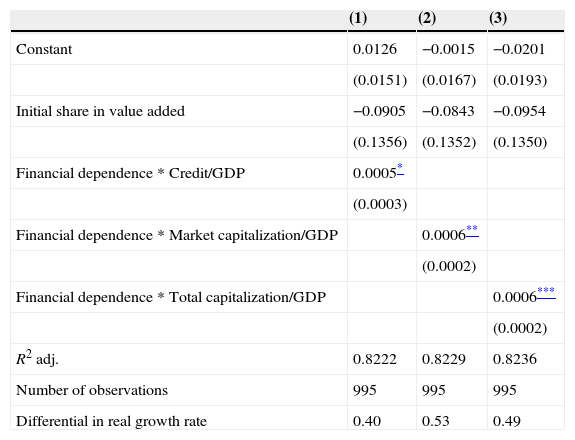
Table 1 shows Maudos and Fernández de Guevara's (2011) results where the effect of financial development on economic growth is estimated. The columns in Table 1 illustrate the results of the basic specification of Rajan and Zingales. In line with these authors, the results show that the sectors most dependent on external finance grow faster in countries with more developed financial markets, irrespective of the indicator of financial development used (stock market capitalization/GDP, credit/GDP or total capitalization/GDP). Specifically, the economic impact of going from a situation of low financial development to another of higher development translates into approximately 0.50 percentage points of growth of the more financially dependent sectors. Consequently, in line with the prior studies by Rajan and Zingales (1998), Cetorelli and Gambera (2001), Guiso et al. (2004), etc., Maudos and Fernández de Guevara (2011) obtain evidence favorable to the hypothesis that financial development facilitates economic growth.
Economic growth and financial development.
| (1) | (2) | (3) | |
|---|---|---|---|
| Constant | 0.0126 | −0.0015 | −0.0201 |
| (0.0151) | (0.0167) | (0.0193) | |
| Initial share in value added | −0.0905 | −0.0843 | −0.0954 |
| (0.1356) | (0.1352) | (0.1350) | |
| Financial dependence*Credit/GDP | 0.0005* | ||
| (0.0003) | |||
| Financial dependence*Market capitalization/GDP | 0.0006** | ||
| (0.0002) | |||
| Financial dependence*Total capitalization/GDP | 0.0006*** | ||
| (0.0002) | |||
| R2 adj. | 0.8222 | 0.8229 | 0.8236 |
| Number of observations | 995 | 995 | 995 |
| Differential in real growth rate | 0.40 | 0.53 | 0.49 |
Note: The dependent variable is the annual growth rate in value added over the period 1993–2003 for each sector in each country. The differential in real growth rate measures (in percentage terms) how much faster a sector at the 75th percentile level of financial dependence grows with respect to a sector at the 25th percentile level when it is located in a country at the 75th percentage of financial development rather than in one at 25th percentile. All regressions include both country and sector fixed effects (not reported). Robust standard errors are reported in parentheses.
The following section uses this elasticity to calculate the effect of both financial development and financial integration on economic growth. Because both of these variables (financial integration and financial development) interact with financial dependence in the model, the calculations are made at the sectorial level.
4Decomposing financial development: pure financial development vs. integrationGiven that this work aims not only to assess the impact of financial development on growth, but also the role that European integration has had as a catalyst for financial development, we need to isolate the part of progress in financial development attributable to integration. In this way, and on the basis of the assumptions described below, we decompose total financial development into two parts: one part attributable to financial integration, and the other part that we shall call “pure” financial development. The “pure” financial development is the financial development which would have been attained regardless of the progress in integration. In particular, each component of the financial development indicator (private credit, bonds and securities) can be decomposed into three parts: one which has been financed with domestic funds, another with EU-15 funds, and a third with funds from the rest of the world. The exercise will therefore consist of assuming how much funding each country would have obtained from its EU partners in the absence of financial integration in Europe.
In a first stage, for each asset we disaggregate the domestic and the foreign component by using data from the Eurostat Financial Accounts. From the total liabilities of each country provided by Eurostat, we calculate the percentage represented by both domestic and foreign funding for each of the assets considered (bonds, securities and bank loans). We use these percentages to disaggregate each component of our financial development indicator in Fig. 1. Once we know how much funding each asset type receives from the rest of the world (non-domestic financing), we then disaggregate the foreign component between funding obtained from European countries (EU-15) and that from third countries. In order to carry out this breakdown, we use other sources of data described below.
The statistics from the Coordinated Portfolio Investment Survey4 conducted by the International Monetary Fund provide the geographical breakdown of each country's issues of debt and securities. The percentage distribution of total financial liabilities (bonds on the one hand, and equity on the other) of each year is applied to data on foreign funding that has been calculated as described in the paragraph above. In this way, we have an estimate of funding from the EU-15 and elsewhere. In the case of bank financing (loans), we use the percentage distribution of funding received from countries in the EU-15 vs. rest of the world provided by BIS in the Consolidated Bank Statistics. By using this distribution, and based on the total amount of loans from abroad calculated as was stated in the previous paragraph, we estimate the amount of loans from the rest of the EU-15 vs. third countries. We can obtain the total capitalization by summing the disaggregation of the three assets (credit, bonds and market capitalization) in the domestic component from the EU-15 and elsewhere.5
The total capitalization disaggregated according to the geographical origin of the funding is used to estimate a hypothetical degree of lower financial development in a scenario of no integration. First of all we decompose the growth of the financial development indicator (total capitalization, Ct) in its three geographic components: domestic finance, funding obtained in other EU-15 countries, and funding obtained in the rest of the world. That is, the accumulated variation of the total financial development (as % of GDP) between years t and t−i is decomposed into a weighted sum of the variations in domestic capitalization (CD), capitalization from other EU-15 countries (CEU) and from the rest of the world (CRW). The weighting factors correspond to the percentage each source of funding represents in total in the initial year:
in which the total capitalization in year t (Ct) corresponds to the amount of bonds, securities and bank loans.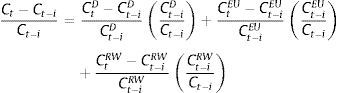
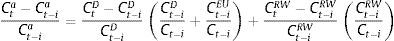
By decomposing the growth of total financial assets we can assume what would have been the growth of the total capitalization if financial integration had not advanced. To this end, we use two alternative scenarios. In the first one (scenario A), we assume that if the degree of integration had not advanced, the growth of funds received by each European country from other EU-15 countries would have been equal to the growth of funds received from the rest of the world. In the second one (scenario B) we assume that in a scenario of non-integration, the growth of funds received by each European countries from other EU-countries would have been equal to the growth in domestic funding. The simulation exercise therefore estimates the level of financial development (total funding collected as a percentage of GDP) that would have been reached in 2012 if the growth of funds received from EU-15 countries (excluding domestic finance) would have been equal (a) to the growth of funds received from the rest of the world; and (b) to the growth of domestic funding. With these assumptions, Eq. (1) can be expressed as follows:
where Cta and Ctb is, in each scenario, the volume of capitalization that would have been presented in year t if the European integration process had not taken place, that is, what we call “pure” financial development.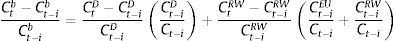
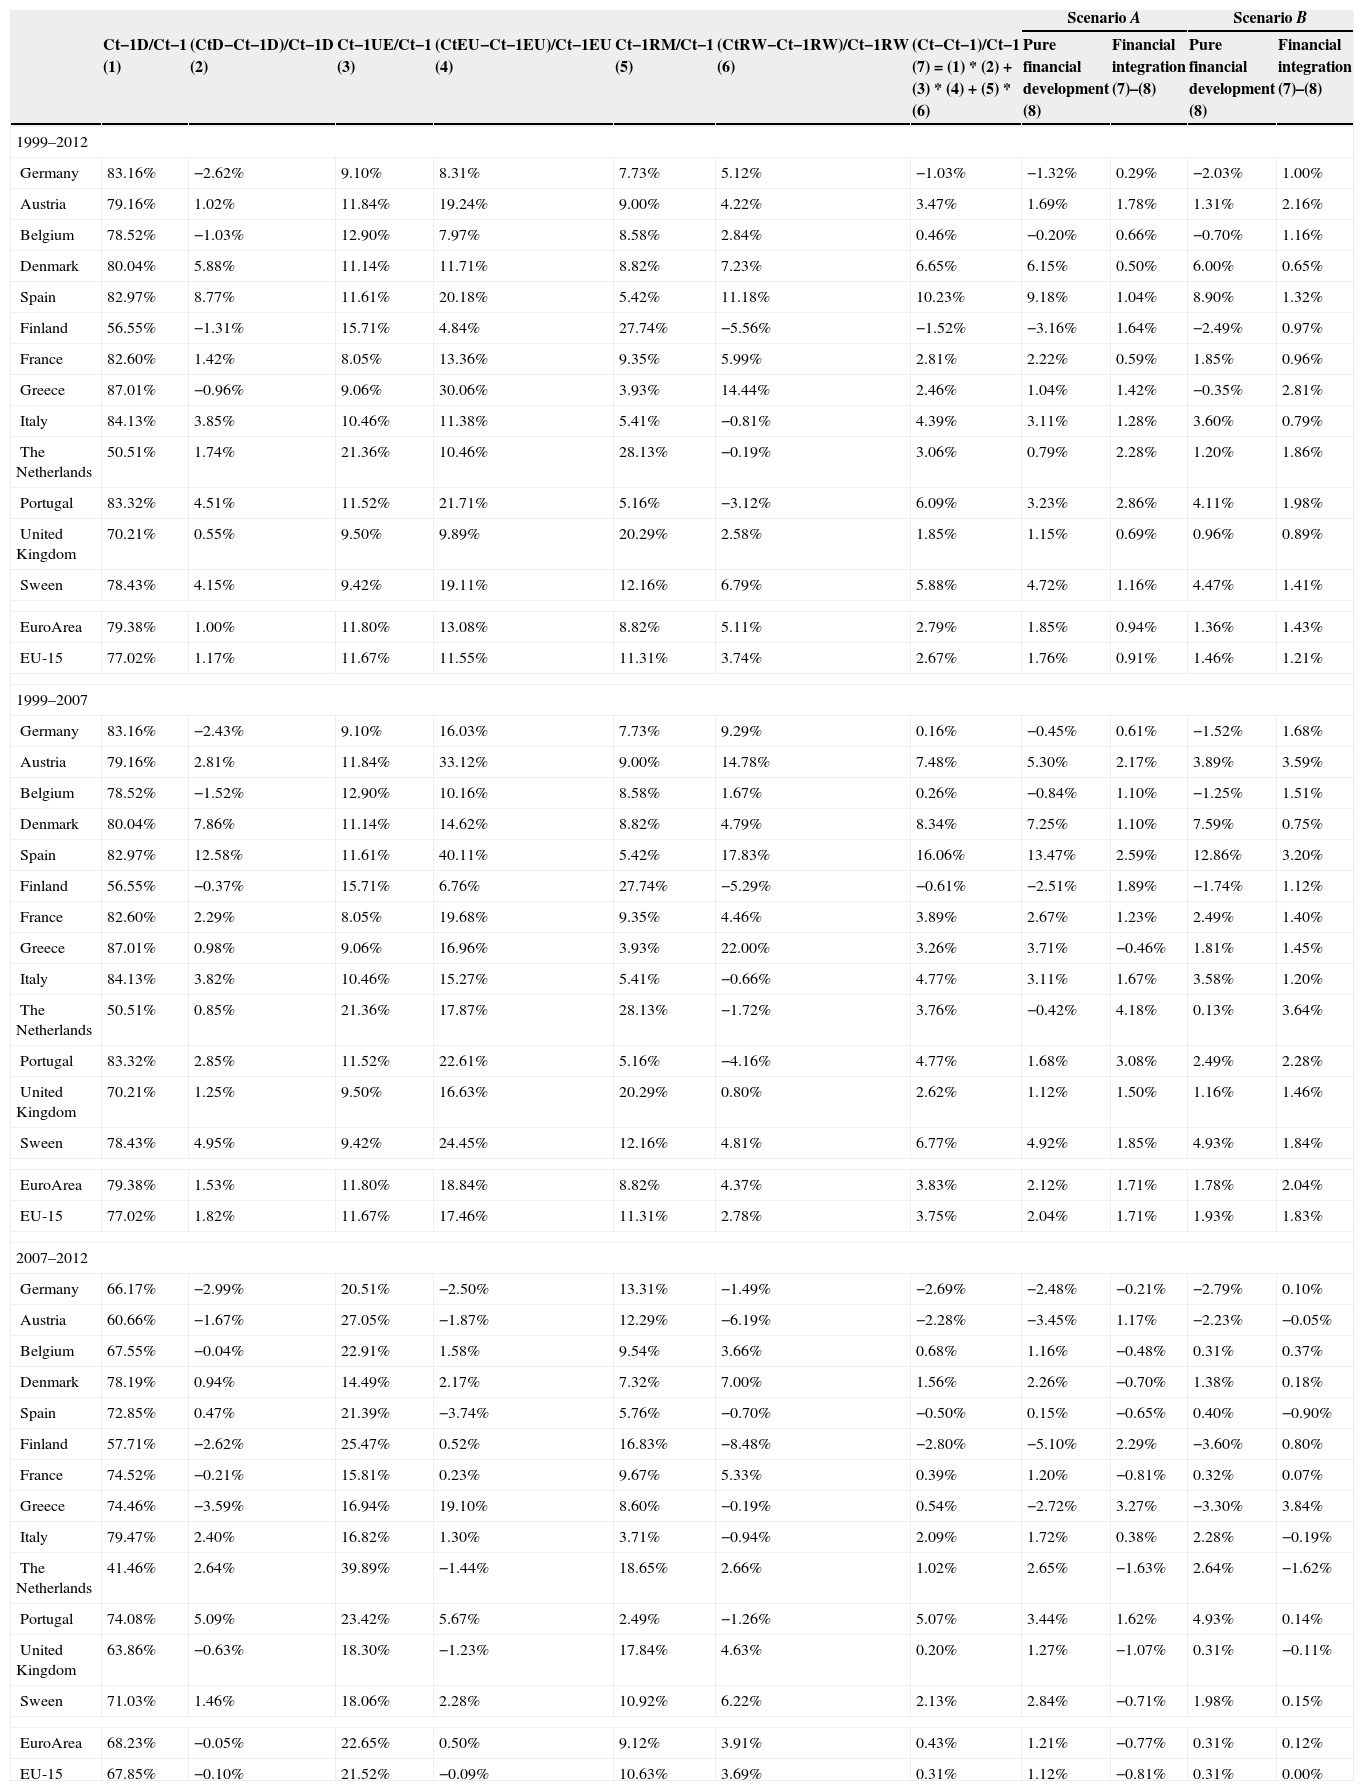
Using the approach and assumptions discussed earlier, Table 2 contains the observed values of growth in total capitalization (financial development indicator) and their decomposition in the contribution of domestic funding, funding from other EU-15 countries, and funding from elsewhere during 1999–2007, 2007–2012 and 1999–2012. In the pre-crisis period, the total capitalization increased at an annual growth rate of 3.75% for the EU-15 countries,6 with a significant contribution of capital from the EU-15. That is to say, 54% growth in total funding (provided as % of GDP) can be explained by the financial contribution of the EU-15, 37% by domestic financing and 8% by funding obtained from other countries. Thus, the annual growth rate in funding from the EU-15 was 17.46% compared to 1.82% in the case of domestic finance over the period 1999–2007. This increased growth of funding from the EU-15 shows the beneficial effect of the progress made in European financial markets integration, which has allowed the EU-15 to access sources of funding from others EU members.
Decomposition of total financial capitalization of EU-15 countries: (domestic credit to the private sector+market capitalization+private debt)/GDP (annual growth rate): Percentages.
| Scenario A | Scenario B | ||||||||||
|---|---|---|---|---|---|---|---|---|---|---|---|
| Ct−1D/Ct−1 (1) | (CtD−Ct−1D)/Ct−1D (2) | Ct−1UE/Ct−1 (3) | (CtEU−Ct−1EU)/Ct−1EU (4) | Ct−1RM/Ct−1 (5) | (CtRW−Ct−1RW)/Ct−1RW (6) | (Ct−Ct−1)/Ct−1 (7)=(1)*(2)+(3)*(4)+(5)*(6) | Pure financial development (8) | Financial integration (7)–(8) | Pure financial development (8) | Financial integration (7)–(8) | |
| 1999–2012 | |||||||||||
| Germany | 83.16% | −2.62% | 9.10% | 8.31% | 7.73% | 5.12% | −1.03% | −1.32% | 0.29% | −2.03% | 1.00% |
| Austria | 79.16% | 1.02% | 11.84% | 19.24% | 9.00% | 4.22% | 3.47% | 1.69% | 1.78% | 1.31% | 2.16% |
| Belgium | 78.52% | −1.03% | 12.90% | 7.97% | 8.58% | 2.84% | 0.46% | −0.20% | 0.66% | −0.70% | 1.16% |
| Denmark | 80.04% | 5.88% | 11.14% | 11.71% | 8.82% | 7.23% | 6.65% | 6.15% | 0.50% | 6.00% | 0.65% |
| Spain | 82.97% | 8.77% | 11.61% | 20.18% | 5.42% | 11.18% | 10.23% | 9.18% | 1.04% | 8.90% | 1.32% |
| Finland | 56.55% | −1.31% | 15.71% | 4.84% | 27.74% | −5.56% | −1.52% | −3.16% | 1.64% | −2.49% | 0.97% |
| France | 82.60% | 1.42% | 8.05% | 13.36% | 9.35% | 5.99% | 2.81% | 2.22% | 0.59% | 1.85% | 0.96% |
| Greece | 87.01% | −0.96% | 9.06% | 30.06% | 3.93% | 14.44% | 2.46% | 1.04% | 1.42% | −0.35% | 2.81% |
| Italy | 84.13% | 3.85% | 10.46% | 11.38% | 5.41% | −0.81% | 4.39% | 3.11% | 1.28% | 3.60% | 0.79% |
| The Netherlands | 50.51% | 1.74% | 21.36% | 10.46% | 28.13% | −0.19% | 3.06% | 0.79% | 2.28% | 1.20% | 1.86% |
| Portugal | 83.32% | 4.51% | 11.52% | 21.71% | 5.16% | −3.12% | 6.09% | 3.23% | 2.86% | 4.11% | 1.98% |
| United Kingdom | 70.21% | 0.55% | 9.50% | 9.89% | 20.29% | 2.58% | 1.85% | 1.15% | 0.69% | 0.96% | 0.89% |
| Sween | 78.43% | 4.15% | 9.42% | 19.11% | 12.16% | 6.79% | 5.88% | 4.72% | 1.16% | 4.47% | 1.41% |
| EuroArea | 79.38% | 1.00% | 11.80% | 13.08% | 8.82% | 5.11% | 2.79% | 1.85% | 0.94% | 1.36% | 1.43% |
| EU-15 | 77.02% | 1.17% | 11.67% | 11.55% | 11.31% | 3.74% | 2.67% | 1.76% | 0.91% | 1.46% | 1.21% |
| 1999–2007 | |||||||||||
| Germany | 83.16% | −2.43% | 9.10% | 16.03% | 7.73% | 9.29% | 0.16% | −0.45% | 0.61% | −1.52% | 1.68% |
| Austria | 79.16% | 2.81% | 11.84% | 33.12% | 9.00% | 14.78% | 7.48% | 5.30% | 2.17% | 3.89% | 3.59% |
| Belgium | 78.52% | −1.52% | 12.90% | 10.16% | 8.58% | 1.67% | 0.26% | −0.84% | 1.10% | −1.25% | 1.51% |
| Denmark | 80.04% | 7.86% | 11.14% | 14.62% | 8.82% | 4.79% | 8.34% | 7.25% | 1.10% | 7.59% | 0.75% |
| Spain | 82.97% | 12.58% | 11.61% | 40.11% | 5.42% | 17.83% | 16.06% | 13.47% | 2.59% | 12.86% | 3.20% |
| Finland | 56.55% | −0.37% | 15.71% | 6.76% | 27.74% | −5.29% | −0.61% | −2.51% | 1.89% | −1.74% | 1.12% |
| France | 82.60% | 2.29% | 8.05% | 19.68% | 9.35% | 4.46% | 3.89% | 2.67% | 1.23% | 2.49% | 1.40% |
| Greece | 87.01% | 0.98% | 9.06% | 16.96% | 3.93% | 22.00% | 3.26% | 3.71% | −0.46% | 1.81% | 1.45% |
| Italy | 84.13% | 3.82% | 10.46% | 15.27% | 5.41% | −0.66% | 4.77% | 3.11% | 1.67% | 3.58% | 1.20% |
| The Netherlands | 50.51% | 0.85% | 21.36% | 17.87% | 28.13% | −1.72% | 3.76% | −0.42% | 4.18% | 0.13% | 3.64% |
| Portugal | 83.32% | 2.85% | 11.52% | 22.61% | 5.16% | −4.16% | 4.77% | 1.68% | 3.08% | 2.49% | 2.28% |
| United Kingdom | 70.21% | 1.25% | 9.50% | 16.63% | 20.29% | 0.80% | 2.62% | 1.12% | 1.50% | 1.16% | 1.46% |
| Sween | 78.43% | 4.95% | 9.42% | 24.45% | 12.16% | 4.81% | 6.77% | 4.92% | 1.85% | 4.93% | 1.84% |
| EuroArea | 79.38% | 1.53% | 11.80% | 18.84% | 8.82% | 4.37% | 3.83% | 2.12% | 1.71% | 1.78% | 2.04% |
| EU-15 | 77.02% | 1.82% | 11.67% | 17.46% | 11.31% | 2.78% | 3.75% | 2.04% | 1.71% | 1.93% | 1.83% |
| 2007–2012 | |||||||||||
| Germany | 66.17% | −2.99% | 20.51% | −2.50% | 13.31% | −1.49% | −2.69% | −2.48% | −0.21% | −2.79% | 0.10% |
| Austria | 60.66% | −1.67% | 27.05% | −1.87% | 12.29% | −6.19% | −2.28% | −3.45% | 1.17% | −2.23% | −0.05% |
| Belgium | 67.55% | −0.04% | 22.91% | 1.58% | 9.54% | 3.66% | 0.68% | 1.16% | −0.48% | 0.31% | 0.37% |
| Denmark | 78.19% | 0.94% | 14.49% | 2.17% | 7.32% | 7.00% | 1.56% | 2.26% | −0.70% | 1.38% | 0.18% |
| Spain | 72.85% | 0.47% | 21.39% | −3.74% | 5.76% | −0.70% | −0.50% | 0.15% | −0.65% | 0.40% | −0.90% |
| Finland | 57.71% | −2.62% | 25.47% | 0.52% | 16.83% | −8.48% | −2.80% | −5.10% | 2.29% | −3.60% | 0.80% |
| France | 74.52% | −0.21% | 15.81% | 0.23% | 9.67% | 5.33% | 0.39% | 1.20% | −0.81% | 0.32% | 0.07% |
| Greece | 74.46% | −3.59% | 16.94% | 19.10% | 8.60% | −0.19% | 0.54% | −2.72% | 3.27% | −3.30% | 3.84% |
| Italy | 79.47% | 2.40% | 16.82% | 1.30% | 3.71% | −0.94% | 2.09% | 1.72% | 0.38% | 2.28% | −0.19% |
| The Netherlands | 41.46% | 2.64% | 39.89% | −1.44% | 18.65% | 2.66% | 1.02% | 2.65% | −1.63% | 2.64% | −1.62% |
| Portugal | 74.08% | 5.09% | 23.42% | 5.67% | 2.49% | −1.26% | 5.07% | 3.44% | 1.62% | 4.93% | 0.14% |
| United Kingdom | 63.86% | −0.63% | 18.30% | −1.23% | 17.84% | 4.63% | 0.20% | 1.27% | −1.07% | 0.31% | −0.11% |
| Sween | 71.03% | 1.46% | 18.06% | 2.28% | 10.92% | 6.22% | 2.13% | 2.84% | −0.71% | 1.98% | 0.15% |
| EuroArea | 68.23% | −0.05% | 22.65% | 0.50% | 9.12% | 3.91% | 0.43% | 1.21% | −0.77% | 0.31% | 0.12% |
| EU-15 | 67.85% | −0.10% | 21.52% | −0.09% | 10.63% | 3.69% | 0.31% | 1.12% | −0.81% | 0.31% | 0.00% |
Table 2 also shows the results of what would have been the growth in total capitalization in the scenario A of non-integration, which assumes that the growth of funds received by each European country from other EU-15 countries would have been equal to the growth of funds received from the rest of the world. It is clear that funding from the EU-15 increased more quickly than from the rest of the world from 1999 to 2007, as has already been proven. It is for this reason that this hypothetical scenario means reducing capitalization growth and therefore, the level of financial development achieved. To be specific, instead of financial development increasing at an annual growth rate of 3.75%, this scenario of non-integration would have meant a growth of 1.71% (“pure” financial development), and therefore 2.04pp less financial development.
Table 2 shows the same calculations over the periods of crisis 2007–2012 and over the whole period 1999–2012. In the first case, we can see that the financial turmoil has caused a modest increase of only 0.31% (per year) of the total financial development in the EU-15. What it is more interesting is the fact that if we compare this limited increase of financial development with what we would have observed if financial disintegration had not taken place (under scenario A), the increase of financial development would have been positive (+1.12%) because funding coming from the EU countries have actually decreased at an annual rate of 0.09% while funding from the rest of the world have increased 3.69% per year. Consequently, financial disintegration has subtracted 0.81pp annually to financial development.
For the whole period starting from the introduction of the Euro in 1999–2012, financial development has increased at annual growth rate of 2.67%, of which 0.91pp are due to the impact of financial integration. Therefore, despite the decline in financial integration that has taken place in the crisis period, the net balance of integration since 1999 remains positive and explains a third of the increase of financial capitalization of the EU-15.
Under scenario B, which assumes that the growth of funds received by each European country from other EU-15 countries would have been equal to the growth of domestic funds, in the period of advance of financial integration (1999–2007), the results are quite similar, integration explaining 49% of financial development compared to 46% in scenario A. According to results of scenario B, in the years of disintegration (2007–2012) financial development has a positive contribution to the growth of total capitalization, since funding from the EU countries has fallen to a similar rate as the domestic funding (−0.10% per year). Therefore, regardless of the assumption used, financial disintegration that has taken place since the outbreak of the crisis has had a negative impact on financial development.
5Financial development, financial integration and growth: resultsIn this section we quantify the economic growth brought about by financial development in each EU-15 country since 1999 by applying the estimated elasticity of economic growth to financial development presented in Table 1. This estimate is simply the product at the sector level of the elasticity estimated by the increase in the level of financial capitalization (as a percentage of GDP) in the period analyzed, taking into account the degree of financial dependence of each sector. The country aggregated effect is calculated weighting each sector according to its relevance in the country's value added.
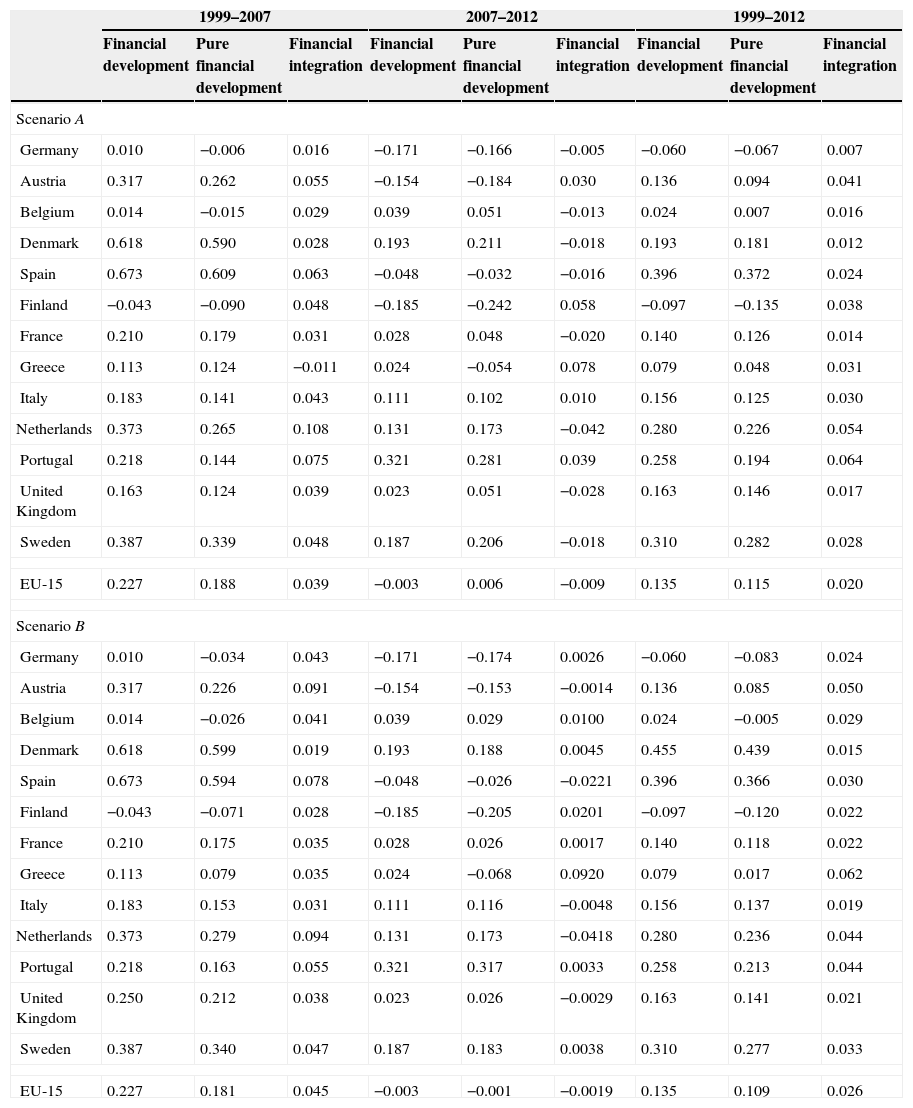
Table 3 illustrates the annual contribution (percentage points) of financial development to GDP growth in each of the Euro area countries over the periods 1999–2007, 2007–2012 and 1999–2012 considering scenarios A and B. In both scenarios the contribution of total financial development is the same, as it does not depend on the assumptions made for disentangling the pure and financial development contribution. For the whole period, the annual contribution in the EU-15 was 0.135pp, accounting for 10% increase of GDP. The detailed information by countries shows that financial development made the most significant contribution in Spain (0.396pp per year). This is due to the fact that this is the country with the highest financial capitalization growth (10.2% per year). On the contrary, in Finland and Germany the contribution of financial development is negative because the level of total capitalization was lower in 2012 than in 1999. It is clear that the countries with the highest contribution of financial development to economic growth are those that more increased the value of financial capital relative to GDP.
Impact of financial development and financial integration on economic growth (annual contribution to GDP growth, in percentage points).
| 1999–2007 | 2007–2012 | 1999–2012 | |||||||
|---|---|---|---|---|---|---|---|---|---|
| Financial development | Pure financial development | Financial integration | Financial development | Pure financial development | Financial integration | Financial development | Pure financial development | Financial integration | |
| Scenario A | |||||||||
| Germany | 0.010 | −0.006 | 0.016 | −0.171 | −0.166 | −0.005 | −0.060 | −0.067 | 0.007 |
| Austria | 0.317 | 0.262 | 0.055 | −0.154 | −0.184 | 0.030 | 0.136 | 0.094 | 0.041 |
| Belgium | 0.014 | −0.015 | 0.029 | 0.039 | 0.051 | −0.013 | 0.024 | 0.007 | 0.016 |
| Denmark | 0.618 | 0.590 | 0.028 | 0.193 | 0.211 | −0.018 | 0.193 | 0.181 | 0.012 |
| Spain | 0.673 | 0.609 | 0.063 | −0.048 | −0.032 | −0.016 | 0.396 | 0.372 | 0.024 |
| Finland | −0.043 | −0.090 | 0.048 | −0.185 | −0.242 | 0.058 | −0.097 | −0.135 | 0.038 |
| France | 0.210 | 0.179 | 0.031 | 0.028 | 0.048 | −0.020 | 0.140 | 0.126 | 0.014 |
| Greece | 0.113 | 0.124 | −0.011 | 0.024 | −0.054 | 0.078 | 0.079 | 0.048 | 0.031 |
| Italy | 0.183 | 0.141 | 0.043 | 0.111 | 0.102 | 0.010 | 0.156 | 0.125 | 0.030 |
| Netherlands | 0.373 | 0.265 | 0.108 | 0.131 | 0.173 | −0.042 | 0.280 | 0.226 | 0.054 |
| Portugal | 0.218 | 0.144 | 0.075 | 0.321 | 0.281 | 0.039 | 0.258 | 0.194 | 0.064 |
| United Kingdom | 0.163 | 0.124 | 0.039 | 0.023 | 0.051 | −0.028 | 0.163 | 0.146 | 0.017 |
| Sweden | 0.387 | 0.339 | 0.048 | 0.187 | 0.206 | −0.018 | 0.310 | 0.282 | 0.028 |
| EU-15 | 0.227 | 0.188 | 0.039 | −0.003 | 0.006 | −0.009 | 0.135 | 0.115 | 0.020 |
| Scenario B | |||||||||
| Germany | 0.010 | −0.034 | 0.043 | −0.171 | −0.174 | 0.0026 | −0.060 | −0.083 | 0.024 |
| Austria | 0.317 | 0.226 | 0.091 | −0.154 | −0.153 | −0.0014 | 0.136 | 0.085 | 0.050 |
| Belgium | 0.014 | −0.026 | 0.041 | 0.039 | 0.029 | 0.0100 | 0.024 | −0.005 | 0.029 |
| Denmark | 0.618 | 0.599 | 0.019 | 0.193 | 0.188 | 0.0045 | 0.455 | 0.439 | 0.015 |
| Spain | 0.673 | 0.594 | 0.078 | −0.048 | −0.026 | −0.0221 | 0.396 | 0.366 | 0.030 |
| Finland | −0.043 | −0.071 | 0.028 | −0.185 | −0.205 | 0.0201 | −0.097 | −0.120 | 0.022 |
| France | 0.210 | 0.175 | 0.035 | 0.028 | 0.026 | 0.0017 | 0.140 | 0.118 | 0.022 |
| Greece | 0.113 | 0.079 | 0.035 | 0.024 | −0.068 | 0.0920 | 0.079 | 0.017 | 0.062 |
| Italy | 0.183 | 0.153 | 0.031 | 0.111 | 0.116 | −0.0048 | 0.156 | 0.137 | 0.019 |
| Netherlands | 0.373 | 0.279 | 0.094 | 0.131 | 0.173 | −0.0418 | 0.280 | 0.236 | 0.044 |
| Portugal | 0.218 | 0.163 | 0.055 | 0.321 | 0.317 | 0.0033 | 0.258 | 0.213 | 0.044 |
| United Kingdom | 0.250 | 0.212 | 0.038 | 0.023 | 0.026 | −0.0029 | 0.163 | 0.141 | 0.021 |
| Sweden | 0.387 | 0.340 | 0.047 | 0.187 | 0.183 | 0.0038 | 0.310 | 0.277 | 0.033 |
| EU-15 | 0.227 | 0.181 | 0.045 | −0.003 | −0.001 | −0.0019 | 0.135 | 0.109 | 0.026 |
Table 3 also shows the effect of financial development on growth during the periods 1999–2007 and 2008–2012. It is obvious that the fall of financial development growth rate during the crisis implies a reduction in its impact on GDP growth.7 For the EU-15 average (excluding Ireland and Luxembourg due to lack of data in the Eurostat Financial Accounts), the crisis reduced the contribution of financial development to growth and it is even negative: −0.003pp per year.
By countries, there are important differences. Obviously, the crisis has had the most considerable impact on those countries whose level of total capitalization fell more sharply over the period 2007–2012. The countries most affected are Finland (with a 0.185pp annual decline in GDP due to the reduction of financial development), Germany (−0.171pp), Austria (−0.154pp) and Spain (−0.048pp) while at the other extreme stand Portugal (with a positive contribution of 0.321pp) and Denmark (0.193).
In the period of expansion and advance in financial integration (1999–2007), the strong increase in financial capitalization had a high contribution to GDP growth. Specifically, for the average of the EU-15, the contribution was 0.227pp per year, highlighting the high impact in Spain (0.673), which is the country with the largest increase in financial capitalization (0.618). Only in Finland the contribution was negative (−0.043), as it is the only country where capitalization decreased.
The results obtained thus far quantify the contribution of progress in financial development to economic growth, and the impact of the financial crisis over the period 2008–2012. However, progress in financial development is not only due to the advance of the financial integration (with measures such as those implemented in the FSAP, as well as the introduction of the Euro as a single currency and catalyst for the integration process) but could also be influenced by other factors.
By applying these simulated values of a lower level of financial development in the absence of financial integration advancing, and following Rajan and Zingales’ (1998) approach, we can quantify the impact of financial integration on economic growth. As Table 3 illustrates, in the period 1999–2007, the “pure” financial development's contribution to growth is lower given the fact that, in the absence of integration, there is less growth in the value of total capitalization relative to GDP. Specifically, the table reports the percentage point reduction in the GDP annual growth rate in a situation in which the degree of financial integration has not advanced. In this period, the progress made in financial integration following the adoption of the FSAP and the introduction of the Euro contributed 0.039pp to annual GDP growth in the EU-15 countries in the scenario A. On average over this period, the advance of financial integration explains 17.1% of contribution of financial development to GDP growth.
During the crisis, the contribution of financial integration to financial development fell (from 49% over the period 1999–2007 to 0.15% over the period 2007–2012) in scenario A and, therefore, also decreased its impact on GDP growth. Concretely, the contribution of financial integration to GDP growth is negative and estimated in −0.009pp for the average of the EU-15 countries in this same scenario. In four countries the impact of financial integration on growth is negative due to the fact that financial funds coming from the EU countries increase at a lower rate compared with the funds coming from the rest of the world (see Table 2).
Despite the negative impact of the financial disintegration has had on economic growth in the period of crisis, results suggest that the net contribution of integration on GDP growth since 1999–2012 is positive (0.020 percentage points per year) and explains 15% of the impact of financial development on GDP growth.
Under scenario B (the assumption is that growth of funds received from other EU-15 countries would have been equal to the growth of domestic funds), the balance of the impact of financial integration on economic growth since 1999 is similar for average of the EU-15 countries, with a positive contribution of 0.026 pp per year, which explains 19% of the contribution of financial development to GDP growth. Results are also quite similar in the period of advance of integration until 2007, with a positive contribution to the GDP growth of 0.045pp per year. Over the period 2007–2012, under scenario B, the effect of financial disintegration on economic growth is negative but negligible (−0.0019pp) because domestic financing (in percent of GDP) fell at a similar rate to that from other countries EU-15 countries. In any case, the message that the decrease in the level of integration that has taken place since the beginning of the crisis has been detrimental to economic growth holds.
6ConclusionsThe international financial crisis that we have been witnessing since mid 2007 has caused a reduction in the growth rate of financial flows and a regression in the level of financial integration. In fact, as the European Central Bank (2009) affirmed, “signs of retrenchment within natural borders have recently emerged in certain financial market segments”. The protectionist measures implemented in many countries, the lack of trust in international markets, the fall in funding sources, etc., have increased home bias, while cross-border activity across European countries has decreased.
Estimates in this paper demonstrate that financial development and financial integration have been fundamental in driving the recent growth in European economies. Specifically, from 1999 to 2007, the economic impact of progress in the degree of financial development has contributed 0.227pp of annual GDP growth in the EU-15 countries, which accounts for on an average 9.4% of the observed economic growth (2.4% for the countries analyzed).
Given that the financial crisis which started in the summer of 2007 in the USA with the subprime crisis led to a general decline in the growth rate of total capitalization, the contribution of financial development to GDP growth also decreases during the period 2007–2012 of crisis. To be specific, the financial retrenchment due to the crisis implies a fall in the annual growth rate of our measure of financial development, from 3.75% over the period 1999–2007 to 0.31% over the period 2007–2012.
Since the introduction of the Euro in 1999 and until the outbreak of the crisis, results indicate that EU-15 GDP increased around 0.039pp per year owing to progress in financial integration, and that financial development would have progressed at a slower pace in the absence of integration. The measures that were implemented with the objective of achieving a single financial market in Europe account for almost 50% of the growth of financial development and 1.6% of GDP growth. With the crisis and the consequent decline in the degree of integration, its contribution to GDP growth is negative, although of a small magnitude (−0.009 pp per year). Anyway, despite the negative effect of financial disintegration in the period of crisis, the net balance of the impact on financial integration on economic growth for the whole period 1999–2012 is still positive, with a contribution to the GDP growth of 0.020pp per year.
The paper makes different assumptions to test the effect of financial integration on growth, but the general conclusion is that as the financial crisis and (in the first stage of the crisis) national protectionist reactions have led to a reversal in integration, it is necessary to return to the pace of progress in integration, given the cost in terms of economic growth of not moving forward. Initiatives to seek coordinated measures at an international rather than a national level are moving in the right direction, especially the construction of the banking union. Fortunately, the measures taken by the ECB in summer 2012 along with the announcement of the banking union project have allowed to slow down, and even reverting, the process of disintegration. However, the European financial market remains fragmented with a level of integration below the pre-crisis level, so it remains a priority to achieve a single financial market to promote economic growth.
Authors wish to thank financial support from Ministerio de Economía y Competitividad (ECO2013-43959-R) and Generalitat Valenciana (PROMETEOII/2014/046).
This indicator tracks the overall level of financial integration over time and reflects the developments in four main market segments: money, bonds, equities and banking.
Among these variables we can quote the efficiency of the judicial system, the degree of fulfillment of contracts, the legal origin of the financial system, etc.
The degree of external financial dependence is proxied as the ratio of debt with cost to current liabilities. This ratio may also be expressed as Interest Bearing Debt/[Stockholders’ Equity+Interest Bearing Debt] and represents the debt to total capital ratio, excluding accounts payable and accrual liabilities from the numerator and the denominator of the ratio.
The IMF Coordinated Portfolio Investment Survey provides data for 1997 and 2001–2012. For this reason, the geographical breakdown of the 1999 financial indicator is carried out using the percentage distribution of funding from the EU-15 vs. the rest of the world in 1997.
In 2010, the geographical breakdown was made using statistical data on the domestic and cross-border position of the monetary Financial Institutions of the European Central Bank, the only source available.
Tables reported in the paper do not provide information for Ireland and Luxembourg. The reason is that Eurostat does not provide information for Ireland before 2000 and for Luxembourg before 2008.
Our calculations reflect the medium term effects on growth of financial development (Rajan and Zingales, 1998). Therefore, the exercise of the effect of the crises on growth has to be understood as a simulation exercise in which we assess the effect of the crisis as if the financial retrenchment were permanent.

