New imaging studies have appeared in recent years for the diagnosis and follow-up of metastatic urological tumours.
Material and methodsA total of 41 patients were reviewed with suspected recurrence of a urothelial or kidney tumour, analysing the diagnostic performance of PET-CT scans undertaken between 2013 and 2016.
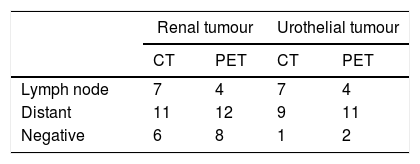
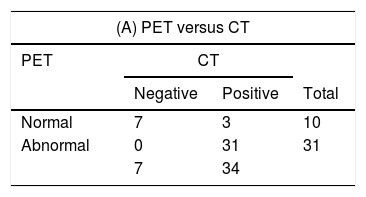
ResultsWe collected 17 urothelial tumours and 24 renal tumours, with a median follow-up of 30 months. A total of 39.3% of the urothelial tumours were high grade and 29.3% of the kidney tumours were clear cell Fuhrman II. As a whole, the imaging studies detected recurrences in 34 patients. CT was positive in 83% of the patients, while the PET scan was positive in 75.6%, CT/PET coincidence was 50%. The PET scan detected further disease in 41% of the cases compared to 5% by CT. This resulted in a change of therapeutic strategy in 40% of the patients. Sensitivity, specificity, positive predictive value and negative predictive value for the CT and the PET scans were 92% and 92%, 57% and 100%, 92% and 100%, and 57% and 70% respectively.
ConclusionThe PET scan showed similar sensitivity for urological tumours to the standard imaging techniques but with higher specificity, positive predictive value and negative predictive value. This led to a change in treatment strategy for 40% of the patients in our series. The PET scan will probably become the standard test in the extension and follow-up studies of most urological tumours.
En los últimos años han surgido nuevos estudios de imagen en diagnóstico y seguimiento de tumores urológicos metastásicos.
Material y métodosSe revisa a 41 pacientes con sospecha de recidiva de tumor urotelial o renal, analizando el rendimiento diagnóstico de las PET-TC realizadas entre 2013 y 2016.
ResultadosRecopilamos 17 tumores uroteliales y 24 renales, con una mediana de seguimiento de 30 meses. Un 29,3% de los uroteliales corresponden a alto grado y un 29,3% de los renales a carcinoma de célula clara Furhman II. En conjunto, los estudios de imagen detectaron recidivas en 34 pacientes. La TC fue positiva en el 83% de los pacientes, mientas la PET lo fue en el 75,6%. La coincidencia TC/PET fue del 50%. La PET detectó más enfermedad en un 41% de los casos frente a un 5% con TC. Esto supuso un cambio en la estrategia terapéutica en el 40% de los pacientes. La sensibilidad, especificidad, valor predictivo positivo y negativo para la TC y la PET fueron de 92 y 92%; 57 y 100%; 92 y 100% y 57 y 70%, respectivamente.
ConclusiónEn tumores urológicos, la PET presenta una sensibilidad similar a las técnicas de imagen estándar, pero con una mayor especificidad, valor predictivo positivo y valor predictivo negativo. Esto supuso un cambio en la estrategia de tratamiento en el 40% de los pacientes de nuestra serie. La PET probablemente se convierta en la prueba de referencia en los estudios de extensión y seguimiento de la mayor parte de los tumores urológicos.
Artículo
Comprando el artículo el PDF del mismo podrá ser descargado
Precio 19,34 €
Comprar ahora


