INTRODUCTION
Clinical management requires having reliable information available for making decisions. Although hospitals generate a lot of data from different sources, this information, although usually accessible 1, is hardly ever used to its full extent in clinical management.
There are various reasons for this. On one hand, the information that interests professional clinicians is usually immersed in a wide series of data that is of little interest to them. On the other hand, the indicators are complex or insufficiently defined, the information is generated in different reports and at different times and, as there is no adequate way of divulging this information, it does not reach all the people involved in clinical management.
Working with closed subsystems is not recommended in healthcare centres because the information should be available to all heathcare wor-kers.
Some authors have proposed hospital quality indicators 2-5, but they have been developed to compare the operation of different hospitals or for use by hospital management. In Spain, we already have experience in the development of indicators designed to measure quality results agreed by hospital services 6. More recently, Sainz et al 7. published an article whose basic purpose was to consider the development of regular indicators of general interest for the hospital and particular interest for each service, as they would be a useful working tool to aid clinical management. These indicators, using economic terminology, are called the control sheet or control table, and are a series of indicators that provide information on the degree of compliance with the proposed aims and objectives. The implementation of this control sheet and its consolidation in the hospital area enables the regular presentation of a document for each hospital service that contains indicators relating to the service and the hospital, including appropriate comparisons, and which measures whether targets are met. The application and divulgation of this tool is a stimulus for better clinical management, understood as the use of intellectual, human, technological and organisational resources for better patient care 8. This information makes it possible for professionals to ma-nage better and adopt measures to improve patient care 9.
Management agreements with services and units are the forebears of clinical management, and should be considered as an improvement as they foster a relationship between managers and healthcare service professionals. Everything seems to indicate that clinical management is going to be progressively implemented in hospitals, and that budget allocations will be made to different services. But it will only come where there is a well defined management agreement.
The main purpose of this study is to examine the development of analytical accounting, proceeding with the restructuring of functional units in the Allergology Service, with identification of the human resources on the level of Homogeneous Functional Groups (HFGs) and their distribution in the areas of activity of the Service, designing an organisation chart of the different areas studied and then proceeding with the divulgation of the usefulness of the tool, especially in aspects related to clinical management.
MATERIAL AND METHOD
Specification of processes
The first step to be carried out was the creation, in January 2005 and on the suggestion of the Management of the "Virgen de la Arrixaca" University Hospital, of a multidisciplinary working group to develop the following processes:
Development of clinical management indicators.
Definition of the selected indicators, including continuous control over them to consider the possibility of the inclusion of new indicators and the elimination of previously selected indicators.
Development of a model document for the results of each hospital service, including the presentation of service and hospital indicators and the inclusion of appropriate comparisons.
Creation and maintenance of a computerised procedure for the process of design and calculation of indicators.
Specification of the flow of information through the different databases available in the hospital.
Determination of the way to divulge these documents to the services and people involved so that the information acts as a stimulus to improve quality.
Control by the working group of various procedures to make appropriate modifications as required in each of the individual processes.
Work schedule
The working group, after considering the problem, distributing information and bibliographic references related to indicators of health care assistance results 10 and, taking the instrument previously developed by some members of the team in the same centre as a basic working hypothesis, established an approximate work schedule before beginning discussion of the upcoming objectives agreement of the Management Contract. One member of the group was designated to carry out the negotiations with the professionals of the Allergology Service and to prepare a study of proposed specific indicators for that Service. At the same time an agreement was reached with the professionals of the Service on the restructuring of the functional units, identification of human resources on a HFG level and their distribution in the areas of activity of the Service, designing an organisation chart of the different areas studied.
In a later meeting of the working group, an agreement was reached on the indicators selected and specifications defined for the procedure of data collection from the various sources of information and the general characteristics of the output form. It was decided to make a pilot study using the data for the first six-months of 2005. When the pilot study was finalised in December, an analysis was made of the indicators corresponding to the first six-months of 2005, comparing them with those for the same period of 2004.
The ensuing discussion and consideration of the whole process in the group meetings led to modifications in the number of indicators and their presentation. This process was dynamic, with continuous modifications after periodical reviews by the working group.
Sources of information
The administrative management of patients in the Outpatient Department, the management of tasks relating to the process of patient appointments, and the capture of the activity of patients in this Area of the Hospital, is carried out in the HP-HIS1® by the Outpatient Department module. This provides a flexible system for the design of the appointment agenda. The module is designed so that the administrative staff of the Centre for Programming the Service of Admission to the Outpatient Department make the appointments for the patient's first visit, and the Allergology Unit makes those of subsequent appointments and consultations as required. The appointments module consists of an interface that presents the user with all the information required for perform these tasks, such as programming appointments, registration of new patients, changes in the programming (cancellations, reprogramming) or the capture of information on the activity carried out, in accordance with the profile of the Unit.
The frequency of the controls and the professional who attended each specific visit was defined by the schedule already defined in the Allergology Unit.
The source of data was completed by the Minimum Basic Data Set (MBDS), the code of the diagnosis-related group (DRG), the medical discharge code for medical documentation and information from the Pharmacy Service.
Computer procedure for the creation of the result sheet
The structure selected for entry and presentation of data was a Microsoft Excel Spreadsheet under Office XP Professional 11, which was set up as a series of spreadsheets describing each activity for evaluation of the service.
Procedure for collection and divulgation
The planned process began with the physician designated by the group requesting the information relative to the Evaluation Unit from the services handling the sources of general information being considered. After collecting these data, they were transcribed into the corresponding cells of the Excel application whose previously defined calculations automatically displayed the results for the Service. The person responsible for the Allergology Service was then interviewed and informed of the results, together with a explanation of the glossary of terms.
Agreements were then reached with Allergology professionals on the restructuring of the functional units, identification of the human resources at a HFG level and their distribution in areas of activity for the Service, designing an organisation chart of the different areas studied which distributed the schedule of each professional in accordance with the activity they carried out.
RESULTS
Cost allocation to the HFG
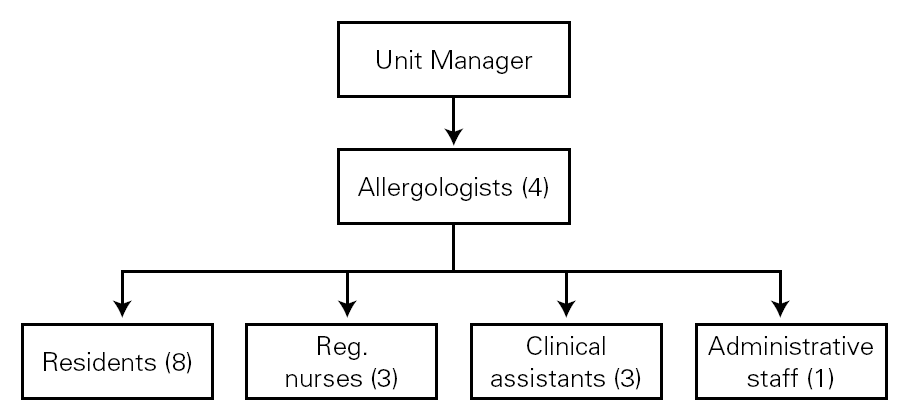
The Allergology Service is comprised of various professionals (fig. 1).
Figure 1.--Professionals of the Allergology Service.
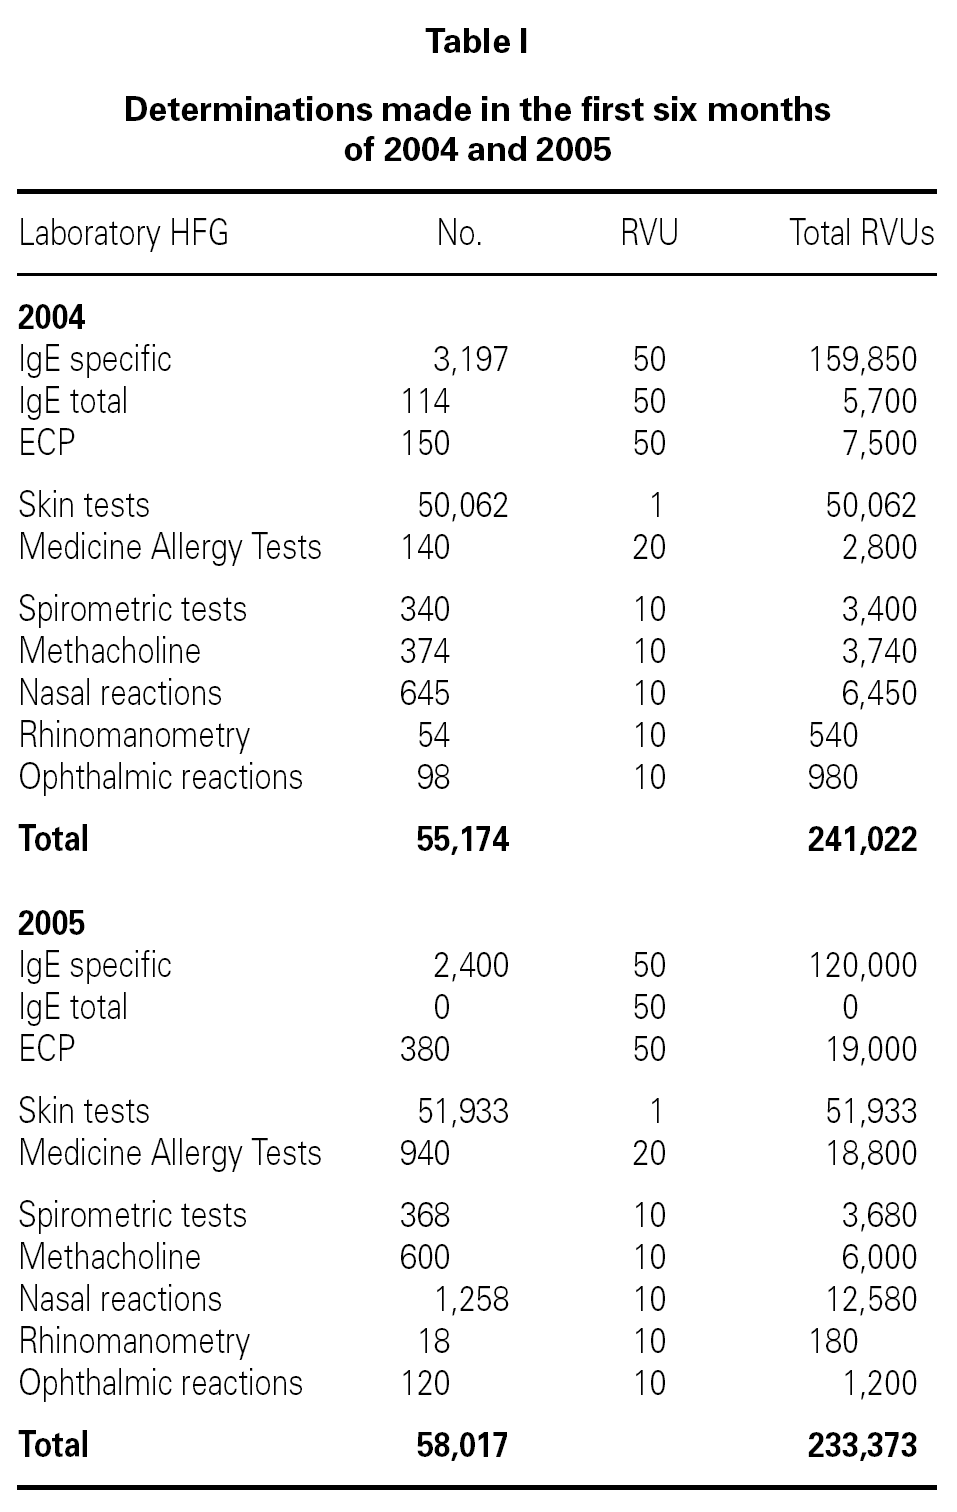
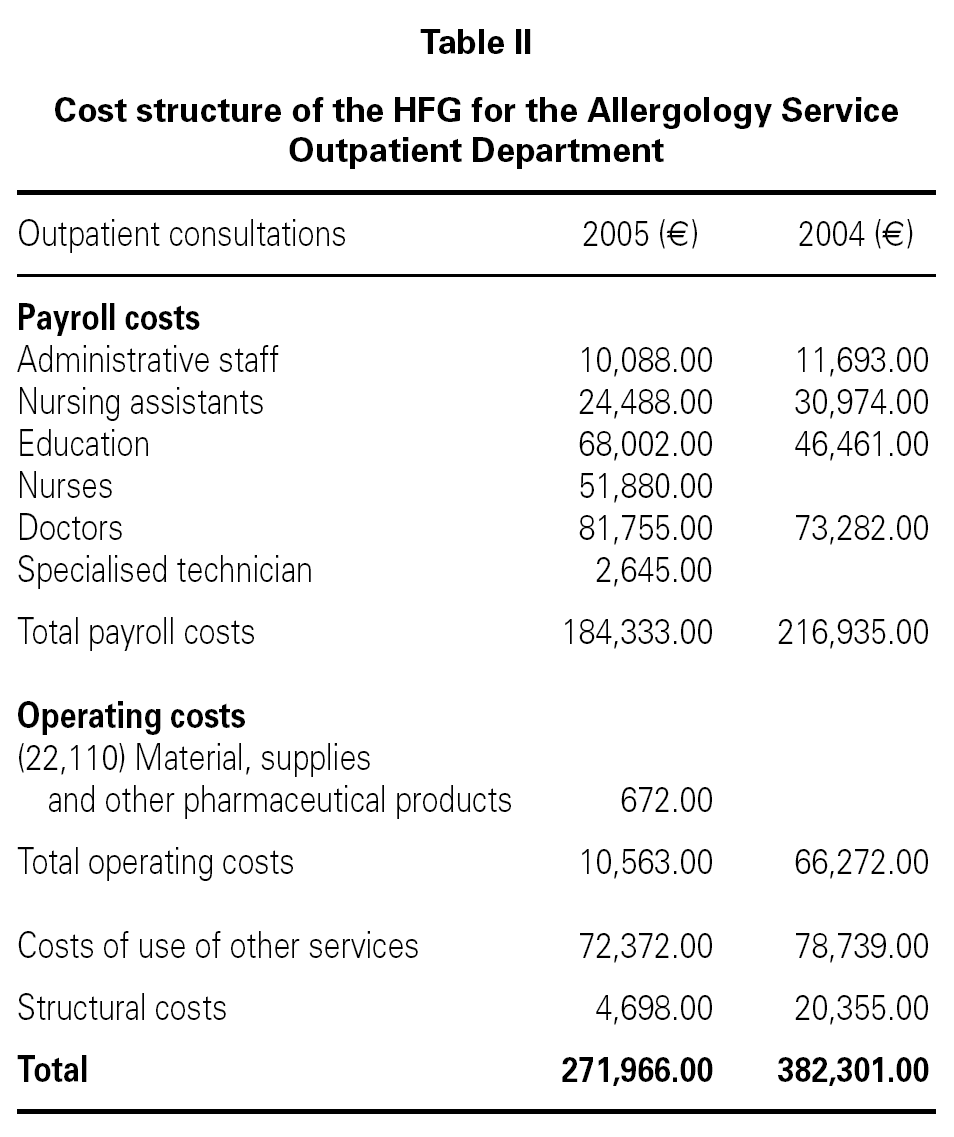
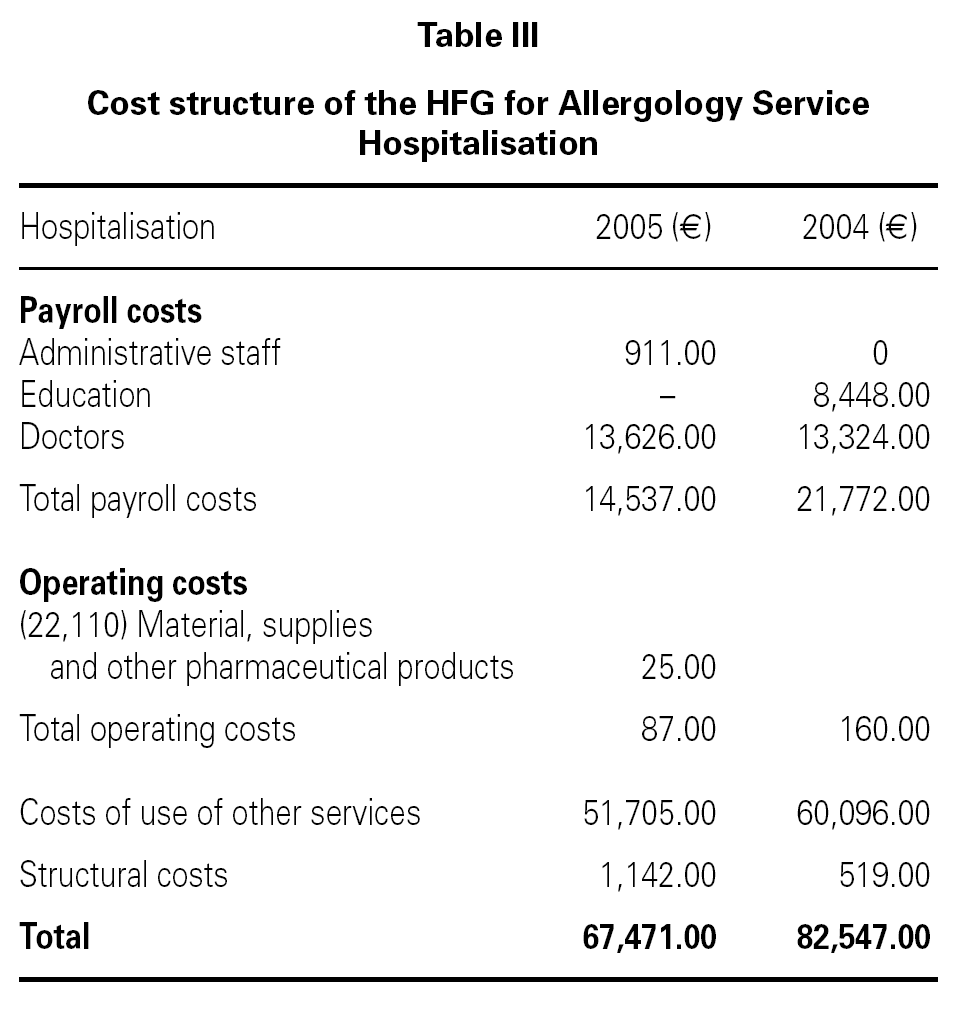
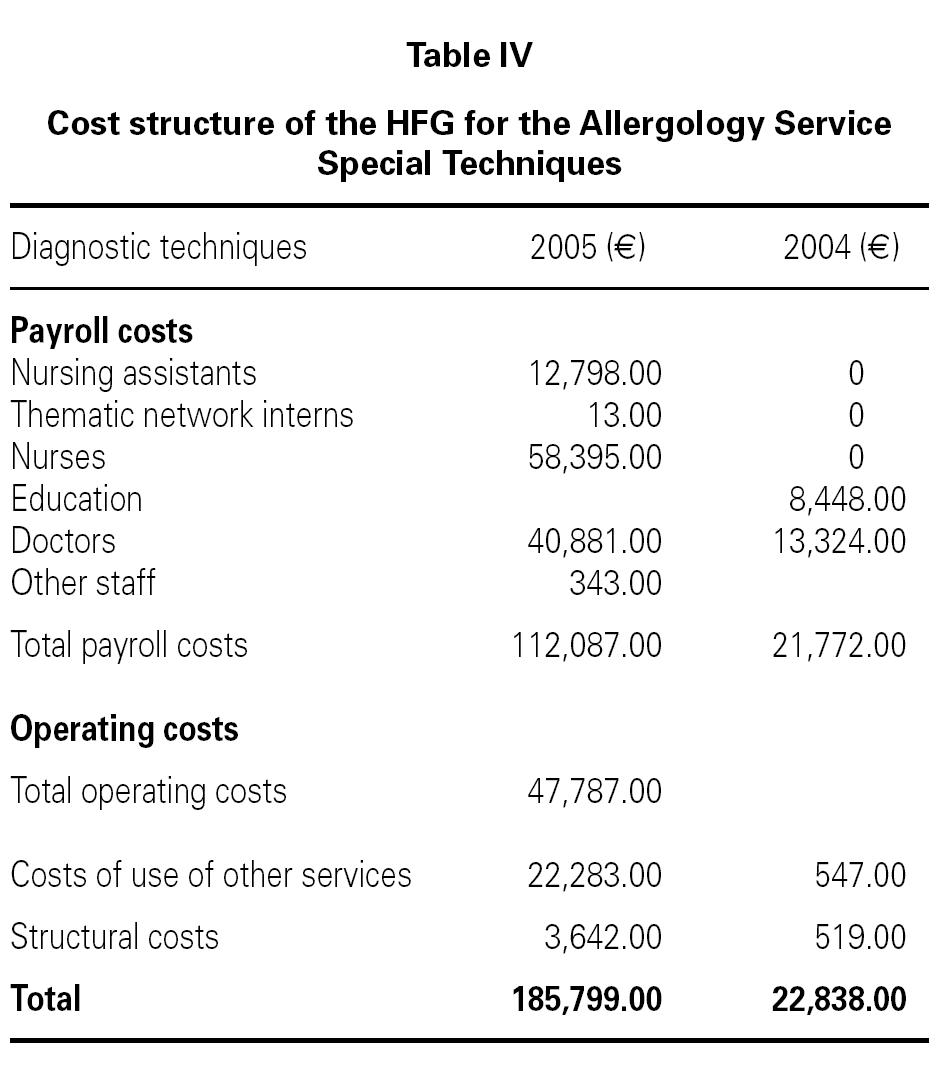
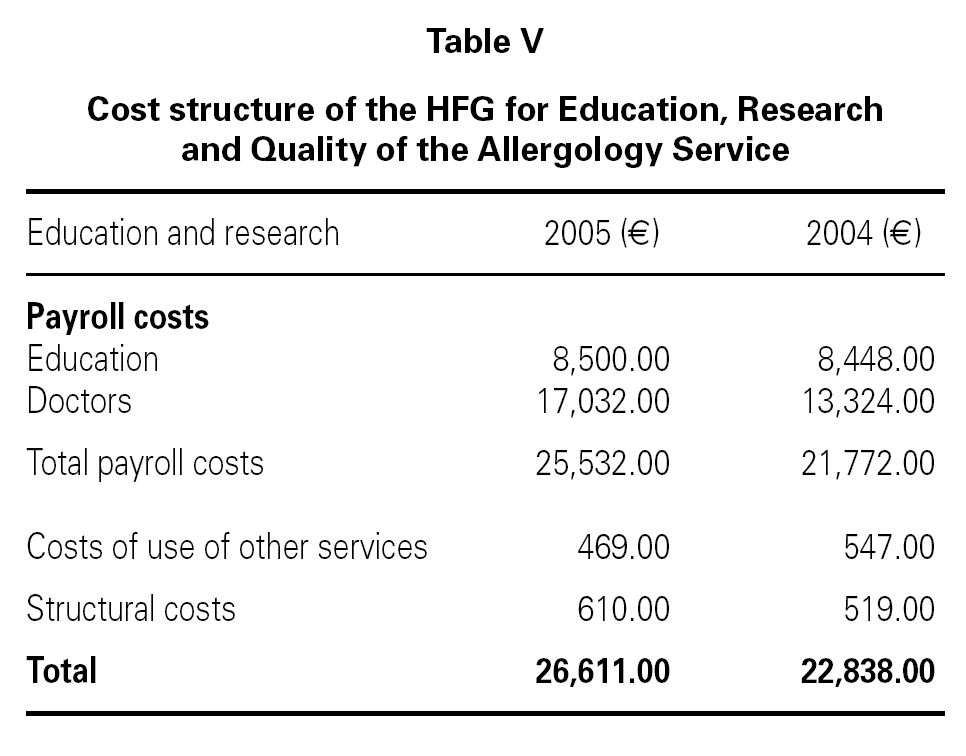
A summary of the follow-up of the activity related to diagnostic techniques and an economic estimate of the HFGs of the Service is shown in tables I-V.
As no Relative Value Units (RVU) are defined for each type of Consultation, the distribution coefficient was assumed to be one minute of the doctor's time, considering that 30 minutes were dedicated to each first visit and 20 minutes to each successive visit, as proposed in a previous article by our group 12.
Year 2004
During the first six-months of 2004 a total of 1,137 patients were attended to for the first time and there were 6,676 subsequent visits.
Doctor's Time = (1,137 x 30) + (6,676 x 20) = 167,630 minutes.
Where the cost per minute of healthcare would be:
Cost per minute = 382,301 euros/167,630 = 2.28 euros
So that the cost of a first visit can be estimated at:
Cost of first visit = 30 x 2.28 = 68.4 euros
And that of successive visits:
Cost of successive visit = 20 x 2.28 = 45.6 euros
Year 2005
During the first six-months of 2005 a total of 1,226 patients were attended to for the first time and there were 6,892 successive visits.
Doctor's time = (1,226 x 30) + (6,892 x 20) = 174,620 minutes.
Where the cost per minute of healthcare would be:
Cost per minute = 271,966 euros /174,620 = 1.58 euros
So that the cost of a first visit can be estimated at:
Cost of first visit = 30 x 1.58 = 47.4 euros
And that of successive visits:
Cost of successive visit = 20 x 1.58 = 31.6 euros
As an approximation of the costs of complementary examinations carried out on patients by the Allergology Unit, they can be calculated from the determinations made (table I), and from the follow-up of the economic estimate of the HFG for "Diagnostic Tests" during the first six months of 2004 and 2005, as shown in table IV.
Therefore, during the first six-months of 2004:
Cost RVU = 22,838 Euros/ 241,022 RVU = 0.095 euros
Cost per prick test = 0.095 Euros x 1 = 0.095 euros
Inhalative challenge tests = 10 RVU x 0.095 euros = 0.95 euros
Challenge tests with medicines = 20 RVU x 0.095 euros = 1.895 euros
Determination of serum IgE = 50 RVU x 0.095 = 4.75 euros
The same can be calculated for the first six months of 2005:
Cost RVU = 185,799 euros/233,373 RVU = 0.796 euros
Cost per "prick test" = 0.796 euros x 1 = 0.796 euros
Inhalative challenge tests = 10 RVU x 0.796 euros = 7.96 euros
Challenge tests with medicines = 20 RVU x0.796 euros = 15.92 euros
Determination of serum IgE = 50 RVU x 0.796 = 39.8 euros
The above allows calculation of the cost of a patient attended to for the first time in 2005, for symptoms suggesting pollinosis, and who was given skin tests with 20 pneumoallergens frequent in the Region of Murcia
First visit47.4 euros
Prick-test [pneumoallergens (20) + Controls (2)] x 0.796 = 17.51 euros
Total cost64.91 euros
DISCUSSION
The purpose of this study was to achieve much more effective activity, that is, the applications for the patient are in the design centre and access to the contents is fast so that the appropriate decisions can be made, without being distracted by technological concepts that are apparently very good, but which, in reality, are not very useful for the every day work of professionals.
Variations in imputations between 2004 and 2005 years are justified by the re-distribution of human resources that was implemented with the members of the Service. The decrease in structural costs and utilization of other Services are explained in part by the share coefficient established acording with the number of profesionals. The relative increase in metacholine test is due to the independent counting of this thechnique from basal spirometries and spirometries with bronchodilators performed at the outpatient clinic.
The series of hospital indicators of the Allergology Service presented in relation to both healthcare and economic activity can be used as a control sheet for the regular evaluation of clinical management and improvement of the quality of the service as well as the hospital. These indicators were divulged among the professionals of the Allergology Service and were very well received. Furthermore this control sheet was used as a basis for the annual definition of objectives for the year 2006.
After having made an approximation to the microcosmos of Allergology, establishing indicators that have a real value for clinicians, the implementation of this control sheet could be a step forward in the Quality policy of the Allergology Service and the hospital, as it implies making more efficient use of the information sources available, divulging them, and promoting decision making based on contrasted data of public access. The main advantage of this work is its multidisciplinary character, the result of the collaboration of professionals from different fields related to clinical management and information processing, with the implication of clinicians who, in the end, are the people generating the expense as, although clinicians did not participate directly in the first stages of the development of the indicators, they did contribute later with criticisms and suggestions to improve successive versions presented during interviews carried out with them.
Although other authors have widely described hospital quality indicators, our work includes, apart from a series of general hospital indicators, indicators that are unique to Allergology to aid clinical management from within the Service itself. This control sheet represents the extension and development of previous attempts along the same lines 13,14 that will make it possible for the Allergology Service to evaluate its own indicators after the application of management decisions, as proposed by Rodríguez Radial et al 15.
We are aware that the indicators proposed suffer from the limitations inherent to the validity and reliability of the data collected in the Minimum Basic Data Set 16, during the process of coding the clinical records 17 and in the sources of the data, and so we are now in a phase of careful revision, in close collaboration with the professionals of the Allergology Service.
As the quality of the data in these databases improves, so will the reliability of the indicators and, therefore, the confidence of all the professionals involved in clinical management. This control sheet includes economic or administrative details, such as the cost per production unit, and in the future this information could be improved by the data provided by analytical accounting.
CONCLUSIONS
The current analytical management system:
1. Provides information.
2. This information must be valid for Clinicians.
3. It is necessary to identify the real generators of expenses in the microcosmos of daily clinical practice to enable reallocation of resources.
4. Make corrections possible that enable decisions to be taken to ensure the best possible management of expenses.
5. Once more we emphasise the importance that clinical management and analysis go hand in hand, so as to be able to take the necessary steps to optimise resources.
Correspondence:
J.M. Negro Álvarez
Valle, 7
30120 El Palmar. Murcia. Spain
E-mail: jnegroa@meditex.es


