INTRODUCTION
Although Spain belongs, from a geographical point of view, to Southern Europe and the socalled Mediterranean area, this is not the case, aerobiologically speaking, of all of its territory. Thus, NW Spain, a wet region with mild temperatures, is more similar, as far as pollination is concerned, to Northern and Central Europe (1-3). It is well known that the presence of pollen in the atmosphere is capable of triggering respiratory problems in allergic patients. However, the minimum levels of atmosphere pollen required to produce symptoms is only known for some pollen types (4, 5). It has thus been verified that 80 % of patients allergic to Betula pollen show symptoms when its atmospheric level is greater than 30 grains/m3 (4), and the same is true of Poaceae pollen and the corresponding allergic patients when it surpasses 50 grains/m3 (5). There are few studies relating clinical and areobiological data in NW Spain (6-8).
The aim of this study was to establish a relationship between pollen types detected in the atmosphere and clinical data obtained by questionnaire, ad telephone calls in an area of NW Spain.
PATIENTS, MATERIAL AND METHODS
Patients
In this prospective study, a total of 24 patients (12 men and 12 women) aged 28 ± 10.6 (range, 7-51 years) were studied in the Allergy Unit from January to December 2000. All of the patients were found to be allergic to pollens on the basis of case history (rhinoconjunctivitis in 23, and/or bronchial asthma in 10), and having positive skin prick tests with pollens: Alnus glutinosa (n = 2 patients), Artemisia vulgaris (n = 3), Betula alba (n = 5), Chenopodium album (n = 6), Corylus avellana (n = 4), Fraxinus excelsior (n = 3), Olea europeae (n = 1), Parietaria judaica (n = 1), Plantago lanceolata (n = 10), Platanus acerifolia (n = 2), Quercus robur (n = 3), and several Poaceae: Anthoxantum odoratum (n = 14), Cynodon dactylon (n = 10), Lolium perenne (n = 22), and Phragmites communis (n = 15). Twenty-one patients had more than one sensitisation. No patient presented sensitisation against Cupressus sempervivens, Ligustrum vulgare, Pinus radiata, Rumex, Salix, Urtica dioica, house dust mites, moulds and cat and dog dander.
All patients came from the health-care area of Santiago. The city is located in the NW of Spain (42 degrees 53'N, 8 degrees 32'W) with nearly 100,000 inhabitants. Meteorological data during 2000 (supplied by the Observatorio Astronómico Ramón María Aller) showed a total annual precipitation of 2,472 mm, April being one of the wettest month (average daily value of 16 mm) and June the driest. The average monthly temperature in winter months oscillated between 7.4 °C and 13.6 °C. Temperatures significantly increased from May onwards with maximum daily values of 24.8 °C in August.
Study methods
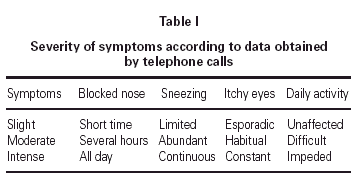
Seasonal and hourly rhythm of symptoms and their intensity during previous years were assessed by questionnaire at the first visit. The same data for the year 2000 was obtained monthly, in which case a researcher telephoned each patient once a month in order to obtain information about his health during the previous month. Symptoms were classified as slight, moderate or intense (table I).
Airborne pollen concentration
Atmospheric pollen was collected between January to December 2000 using a Hirst-type volumetric pollen sampler, set up on the top of a building in the centre of Santiago de Compostela, at 26 metres above ground level. Samples were processed following the methodology proposed by the Aerobiological European Network. Mean daily pollen concentration (grains/m3) was measured. The model of Galán et al. was employed to evaluate the hourly diurnal variation of principal pollen types (9). Data was expressed as the proportion of pollen trapped during each hour of the day.
RESULTS
Airborne pollen counts
The total atmospheric pollen recorded in Santiago during the study period was 12,698 pollen grains. The most important types of pollen detected were Poaceae (3,181 grains 25 % of the total), Betula (2,888 grains 23 %), Parietaria (1,001 grains 8 %), Plantago (581 grains 5 %), and, to a lesser extent, Quercus, Platanus, and Alnus. Artemisia, Chenopodium, Corylus, Fraxinus, and Olea pollens were barely presented (< 0.1 %).
In relation to mean daily concentration, more than 30 grains/m3 of Betula were detected during 21 days, and more than 80 grains/m3 during 12 days. Levels greater than 10 grains/m3 of Quercus, Alnus, and Platanus were recorded during 14, 7 and 9 days, respectively. On June and July, Poaceae pollen reached 50 grains/m3 during 20 days.
Relationship between allergic symptoms and pollen counts
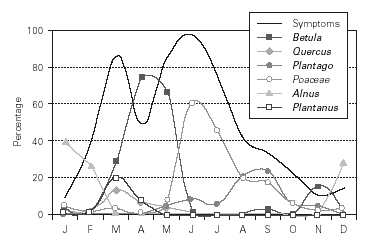
From a clinical point of view, most patients showed symptoms during March (20/24, 83 %) and in the period between May and July (23/24), coinciding with the greatest quantity of atmospheric pollen. The sharp decrease in allergy symptoms in April may be related to the scarcity of pollen due to the effect of rainfall, since this month was the rainiest in the year apart from winter (439 mm) (fig. 1).
Figure 1.Monthly frequency of symptoms, rainfall and pollen data.
The intensity of symptoms according to the monthly questionnaire was slight (scale 0-1) during the first months of the year (from January to March) and affected 50 % (12/24 patients) of the studied population, although 21 % of the patients (5/24) reported the same kind of symptoms throughout the rest of the year. Starting from May the intensity of symptoms increased to moderate (scale 1-2), affecting 33 % (8/24) of the patients. Symptomatology became intense in the following months, affecting 67 % (16/24) of the individuals in June. From September onwards between 4-14 % of the patients showed moderate symptoms, which may be related mainly to pollen of Plantago, late-flowering gramineae and Urticaceae. Parietaria pollen (which caused skin sensitisation in 8 % of the sample) reached average daily concentrations of more than 10 grains/m3 during 34 days.
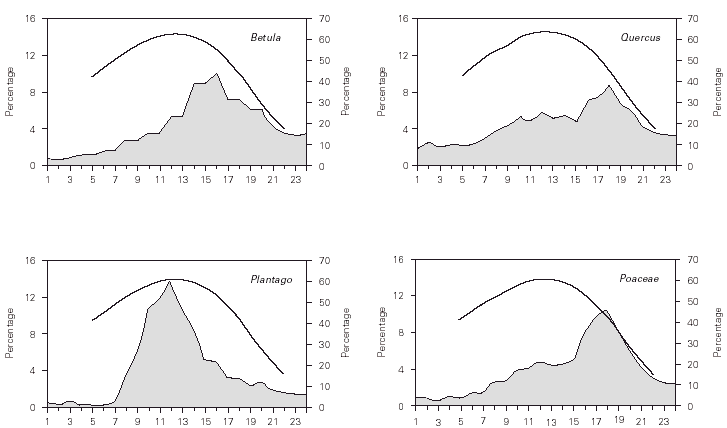
In relation to diurnal variations (fig. 2), 56 % of the cases showed symptoms during the first hours of the morning, generally on waking or going outside; 63 % of the patients experienced allergic reactions during the central hours of the day and 22 % at nightfall. With respect to each sensitization, 80 % of the patients allergic to Betula showed symptoms during this taxon's hours of maximum atmospheric levels, i.e. in the afternoon. In the same way, all the patients that skin-tested positively for Quercus showed allergic symptoms at night, coinciding with this pollen type's maximum atmospheric presence in the year 2000. In the case of Plantago, 70 % of the patients coincided with a greater allegic incidence around 2 pm and in that of gramineae, 59 % of the patients experienced symptoms in the evening, coinciding with this pollen type's hours greatest pollen concentration.
Figure 2.Relationship between frequency of symptoms and intardiurna pollen representation. X-axis, hours of the day. Right Y-axis, percentage of symptomatic patients. Left Y-axis, percentage of each pollen type in the atmosphere.
DISCUSSION
Coinciding with studies carried out in other towns in the NW Iberian Peninsula (6), pollinosis sufferers in the Santiago de Compostela health district are predominantly sensitised to the pollen of gramineae (Poaceae). The results obtained in this study confirm the clinical relevance of this sensitisation in direct correspondence with the presence of such pollens in the atmosphere during June and July. Despite the frequency with which the patients show other sensitisations, these seem to be of limited clinical importance since the presence of those pollens hardly produced any intensification of symptoms. Specifically, the ten patients allergic to Plantago did not seem to be affected at all by the presence of this pollen during August and September, when the levels were greatest, since there was no modification in the decline of symptoms. Another important taxon from an aerobiological point of view, specially in the Mediterranean area and also detected in some coastal regions of Galicia, is Parietaria (8, 10). Nevertheless, the prevalence of sensitisation to this plant is very low in the study population and its atmospheric pollen levels only accounted for a minority of the total pollens recorded. It is therefore of limited interest regarding the study population.
In relation to allergy to arboreal pollen types, while Betula is the genus that most frequently produces sensitisation, it seems that the symptomatology detected in March may be attributed to Platanus and Quercus; although Betula levels are on the increase then, no worsening of symptoms was detected during its maximum pollination in April. This fact should be analysed with precaution since April was the month with the highest rainfall (439 mm). It is well known that this phenomenon may exert a cleansing influence on the atmosphere and decrease pollen counts. The Betula figures recorded in the year 2000 were lower than those of previous years (11). However, they were sufficiently high in order to trigger, at least in theory, symptoms in allergic individuals. This point should therefore be analysed in future studies with a greater number of patients. Lastly, the high Alnus pollen concentrations detected at the end of winter did not seem to produce symptoms in 8 % of the sensitised individuals.
With regard to the hourly relationship between symptoms and presence of pollen, the obtained results confirm the worsening of symptoms from 9 am onwards, peaking during the central hours of the day. It is surprising that the maximum pollen levels, which are recorded during the afternoon hours, do not appear to affect the patients. One possible explanation is the improvement associated with the intake of symptomatic medication at the moment when patients feel worse. The fact of staying at home undoubtedly justifies the slight symptomatology detected during the night and first hours of the morning.
Finally, it is worth pointing out that the method employed in this study in order to obtain information about the patients' symptomatology telephoning their homes once a month proved to be useful and enabled the objectification of a clear relationship between the presence of certain pollens in the atmosphere and the appearance of symptomatology. This monitoring method has the advantage of obtaining information directly from the patient with a periodicity that enables him to remember his state of health during the previous weeks. Its disadvantages are the need for personnel to carry out the aforementioned surveys and not obtaining detailed information on a daily basis. The latter seems to be less important judging from the experience of previous studies, which showed that patients who were given symptom cards to be filled out daily only did so shortly before consultation (12).


