


The distribution of major causes of liver cancer (LC) in the United States (US) has changed significantly over time. This study analyzes recent temporal trends in the causes of LC in the US from 1990 to 2021 and predicts future trends.
Materials and MethodsWe obtained detailed data on LC in the US from the Global Burden of Disease (GBD) 2021 study. Estimated annual percentage change (EAPC) values for LC in the US were then calculated using linear regression models. An exponential smoothing (ES) projection model and Bayesian Age-Period-Cohort (BAPC) projection model were then used to predict the future disease burden of LC. Risk factors for LC were also assessed.
ResultsIn 2021, the disease burden of LC in the US was significantly higher than in 1990. Hepatitis C virus (HCV)-associated LC resulted in the greatest burden of disease. The fastest growing burden of disease was attributed to metabolic dysfunction-associated steatotic liver disease (MASLD)-associated LC. Higher burdens of disease were seen in older and male populations.
ConclusionsIn the US, the disease burden of LC from different etiologies continues to rise. As such, targeted prevention and control strategies should be developed to address these unique disease characteristics.
Liver cancer (LC) is a form of malignant tumor with a very high incidence and mortality rate. According to 2020 Global Cancer Data, LC is the sixth most diagnosed cancer and the third leading cause of cancer deaths worldwide after lung and colorectal cancers, with about 906,000 (4.7 %) new cases and 830,000 (8.3 %) new deaths per year [1]. It has been the leading cause of cancer deaths in 23 countries [1]. Chronic hepatitis B virus (HBV) or hepatitis C virus (HCV) infection, excessive alcohol consumption, liver fluke, aflatoxin exposure, and metabolic dysfunction-associated steatotic liver disease (MASLD) have all been shown to be strongly associated with the development of primary LC [2–7]. However, the main risk factors vary by region, with chronic HBV infection, aflatoxin exposure, or both being the main risk factors in China, South Korea, and sub-Saharan Africa; HCV infection the main cause in countries such as Japan, Italy, and Egypt; and HBV or HCV infection, and alcohol consumption being the main causes in Mongolia. The incidence of LC varies considerably globally, with Asian countries still having the highest incidence rates. Many high-risk countries in East and Southeast Asia have experienced a decline in LC incidence and mortality in recent years, whereas most low-risk countries in Europe, North America, Australia, New Zealand, and South America have seen an increase in incidence or have stabilized at a higher level in recent years [8].
In the United States (US), the incidence of LC has more than doubled in the past two decades [9] and is the fastest-growing cause of cancer-related deaths [10]. LC is projected to become the third leading cause of cancer-related deaths in the US by 2040 [11]. The rising incidence of LC in the US imposes a significant financial burden on the nation and impacted individuals, with median Medicare payments and individual patient payments for LC patients exceeding $65,000 and $10,000, respectively, in the first year after diagnosis, according to Mohammad A. Karim et al [12]. As a result, addressing the growing burden of disease due to LC in the U.S is of great importance. Importantly, LC can be prevented by eliminating or reducing risk factors associated with the disease [13,14]. To develop effective prevention and mitigation strategies for LC, a timely and in-depth understanding of the trends in incidence and mortality from LC due to different risk factors and accurate prediction of future disease trends is imperative.
To the best of our knowledge, there are few previous studies on the temporal trends and distributional characteristics of LC incidence and mortality rates in the US, delineating various LC etiologies. In this study, we retrieved data on primary LC incidence, mortality, disability-adjusted life years (DALYs), prevalence, and underlying etiologies in the US using the Global Burden of Disease (GBD) 2021 study to characterize disease trends over the past three decades and project evolving trends over the next twenty-five years, providing a more comprehensive understanding for future targeted disease prevention and mitigation strategies.
2Materials and methods2.1Data sourcesThe GBD 2021 database provides data on the number of deaths, DALYs, morbidity, and prevalence associated with 369 diseases and injuries in 204 countries and territories from 1990 to 2021. The GBD 2021 study is the most comprehensive and scientifically rigorous study to assess global epidemiological burden data and collects data through systematic assessments of censuses, household surveys, civil registration and vital statistics, disease registries, disease notifications, health service utilization, and other sources.
To assess the burden of LC in the US, incidence of LC, number of DALYs, number of deaths, prevalence and the corresponding age-standardized incidence rate (ASIR), age-standardized DALYs, age-standardized deaths rate (ASDR), age-standardized prevalence rate (ASPR), and other data (with the corresponding 95 % uncertainty interval (UI)) were extracted from the disease database (https://ghdx.healthdata.org/gbd-resultstool). Cases of LC were coded using the International Classification of Diseases (ICD) 9th edition (155-155.963) and 10th edition (C22.0-22.9).
2.2Statistical analysisWe analyzed LC data from four etiologies (HBV, HCV, alcoholic steatohepatitis, and MASLD). Analyses included the number of deaths from LC of different causes, DALYs, incidence, and prevalence and their age-standardized rates (ASRs) in 2021. Age standardization is necessary and representative when comparing several populations with different age structures or populations at the same time. Data are disaggregated by age group and sex. Second, the study also used the estimated annual percentage change (EAPC) value calculated with a linear regression model to investigate the time trend of the disease burden specific to each LC subtype in the US from 1990 to 2021. EAPC is a measure of the ASR trend over a time interval, calculated by the method proposed by Hankey. The ASR was fitted to a regression model: ln(ASR) = α + βx + ε, where α is the intercept term, β is the annual change per 100,000 in the rates, x is the calendar year, and ε is the error term. EAPC was calculated as 100 × (exp(β) - 1), and its 95 % confidence interval was also computed similarly from the linear regression model [15–17]. To enhance predictions of disease burden from 2021 to 2046, we utilized an exponential smoothing (ES) prediction model and Bayesian Age-Period-Cohort (BAPC) model. BAPC model effectively captures trends in disease burden across various times and populations by integrating age, period, and cohort effects. Utilizing Bayesian statistical inference, the BAPC model leverages historical data to forecast future disease burden. The age effect accounts for variations in health risks among different age groups, the period effect evaluates public health changes at specific time points, and the cohort effect examines shifts in health status among populations born in different time periods. Finally, the risk factors for LC of different etiologies were analyzed. Statistical significance was defined as a P-value less than 0.05. Data was processed and analyzed using R software (version 4.3.2).
2.3Ethics declarationsEthics approval and consent to participate—this study is based exclusively on data from previously published sources and publicly available datasets; therefore, ethics approval and consent to participate are not applicable. Consent for publication—Not applicable.
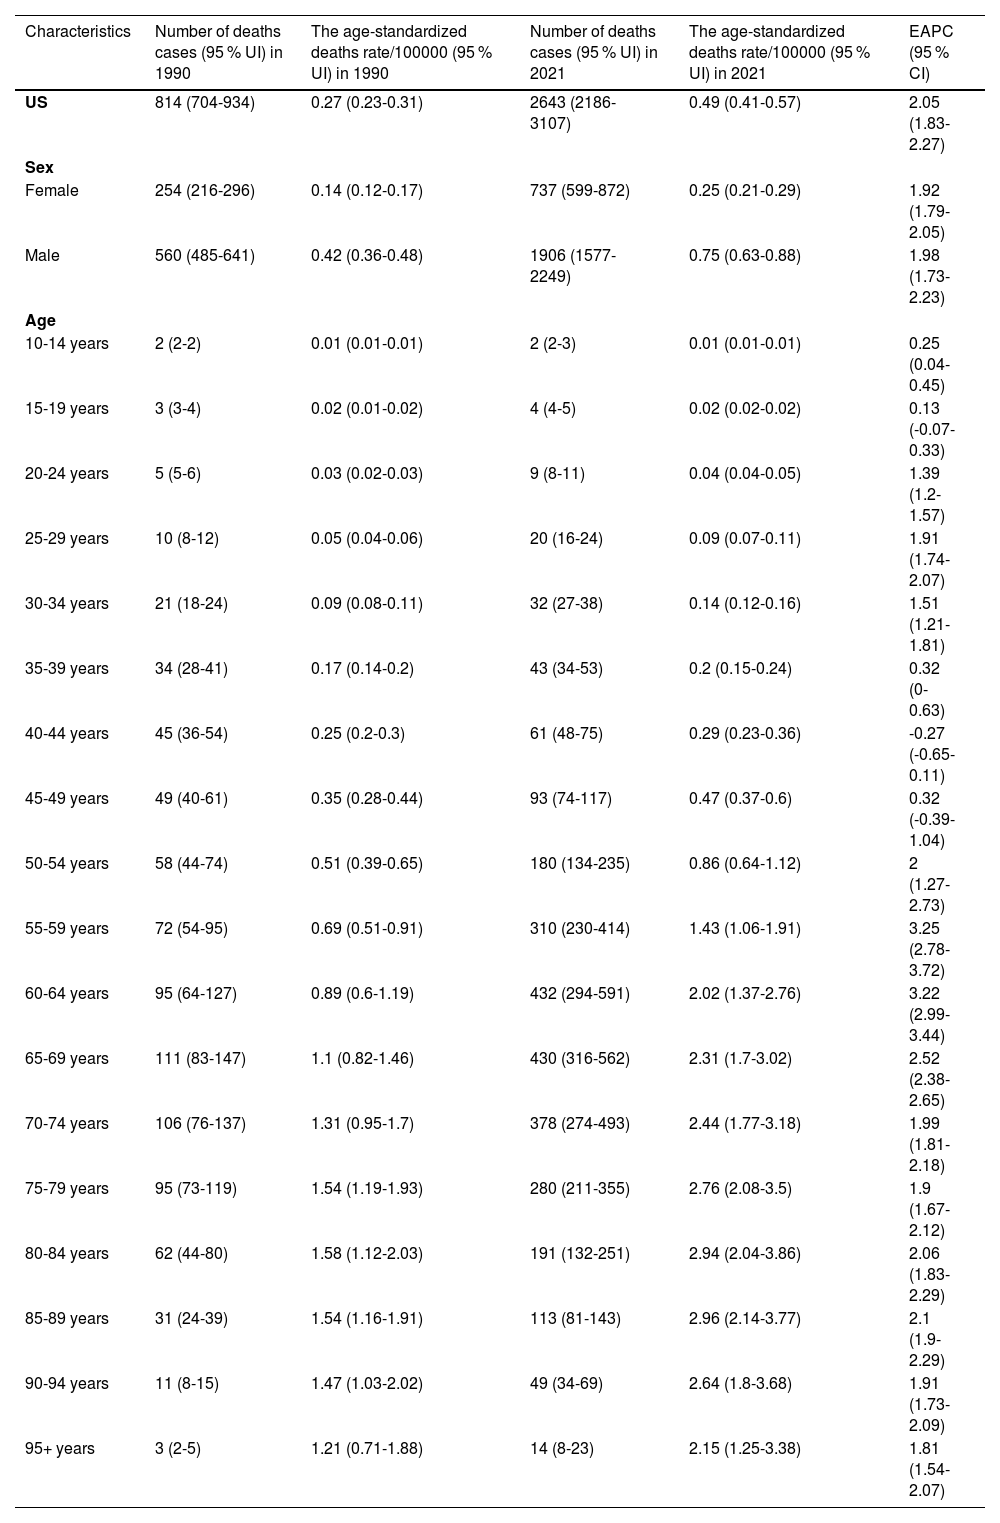
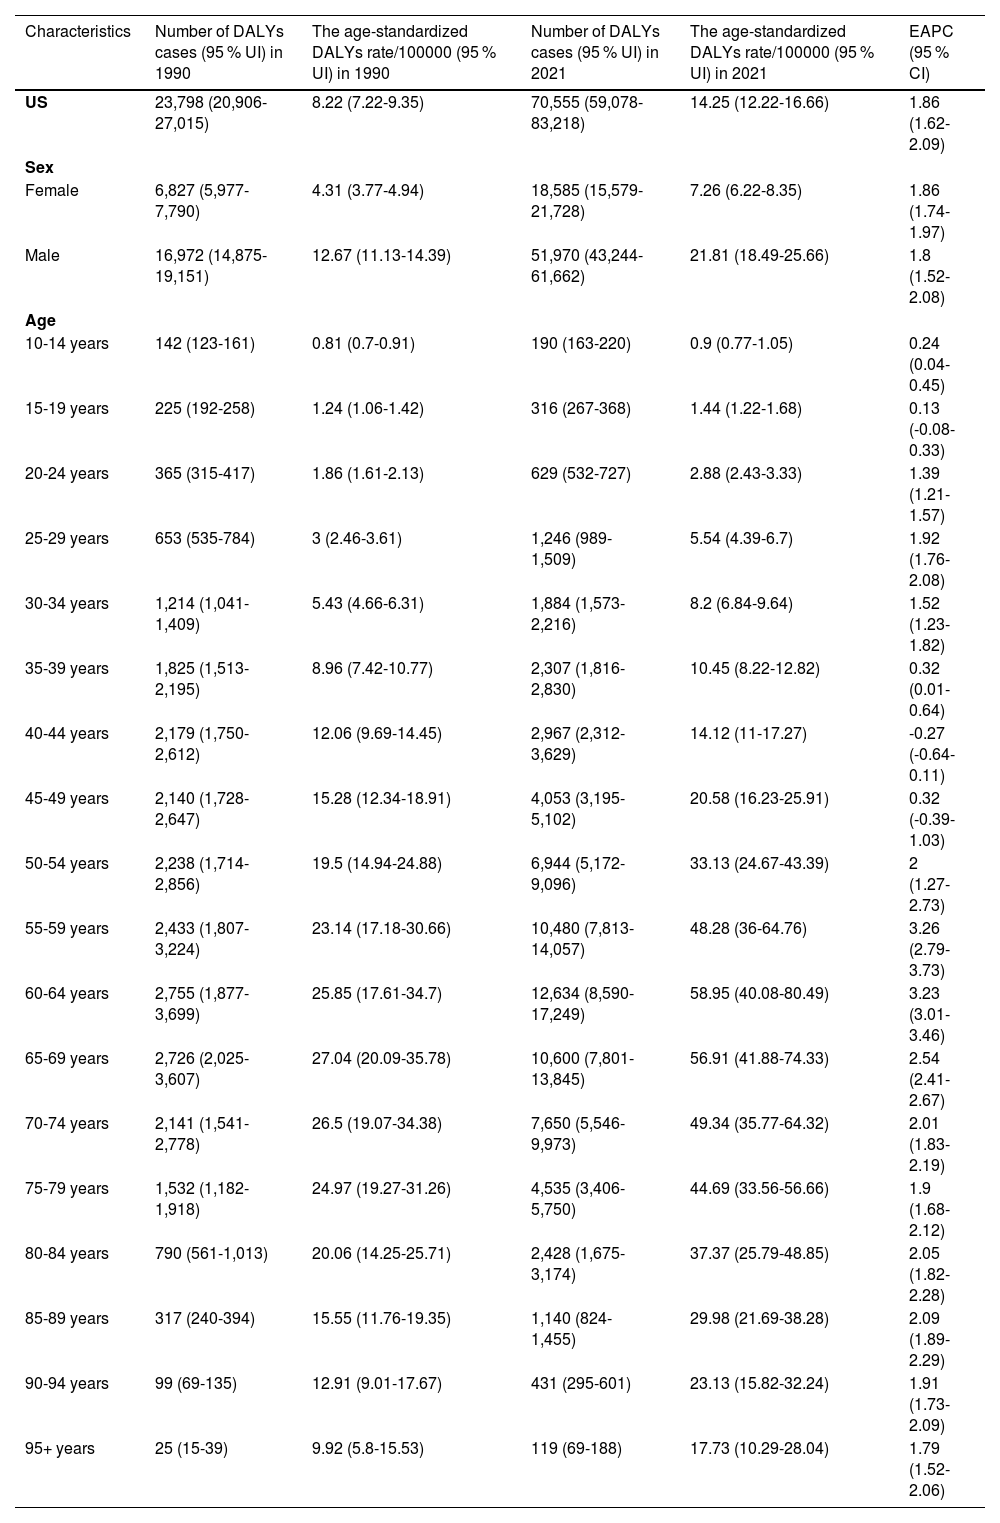
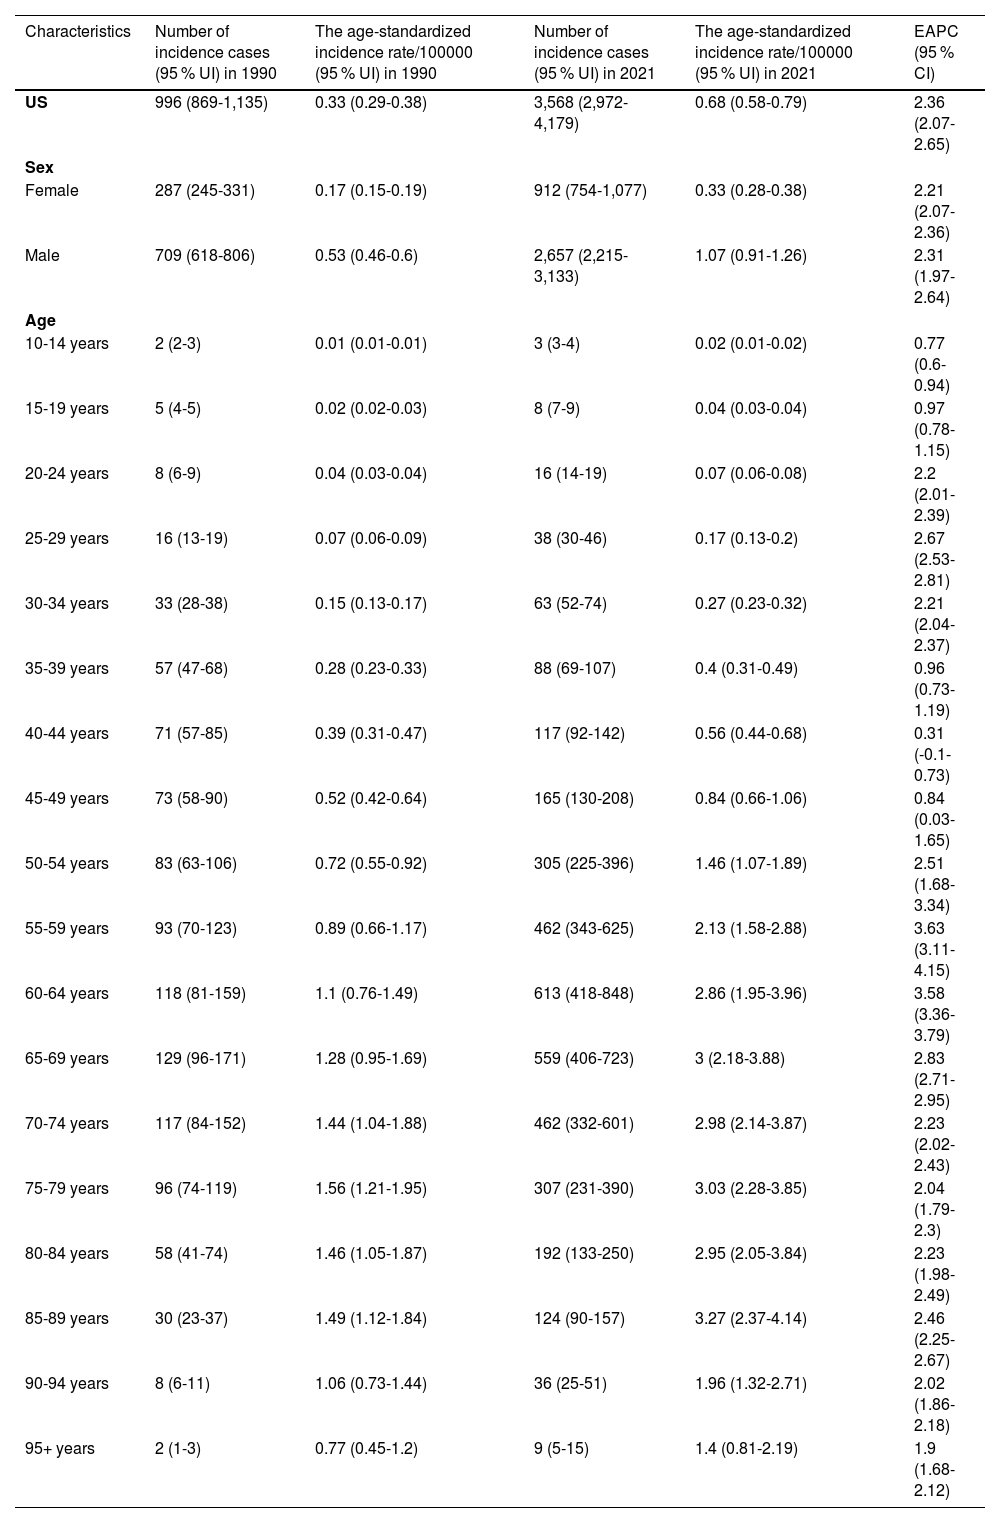
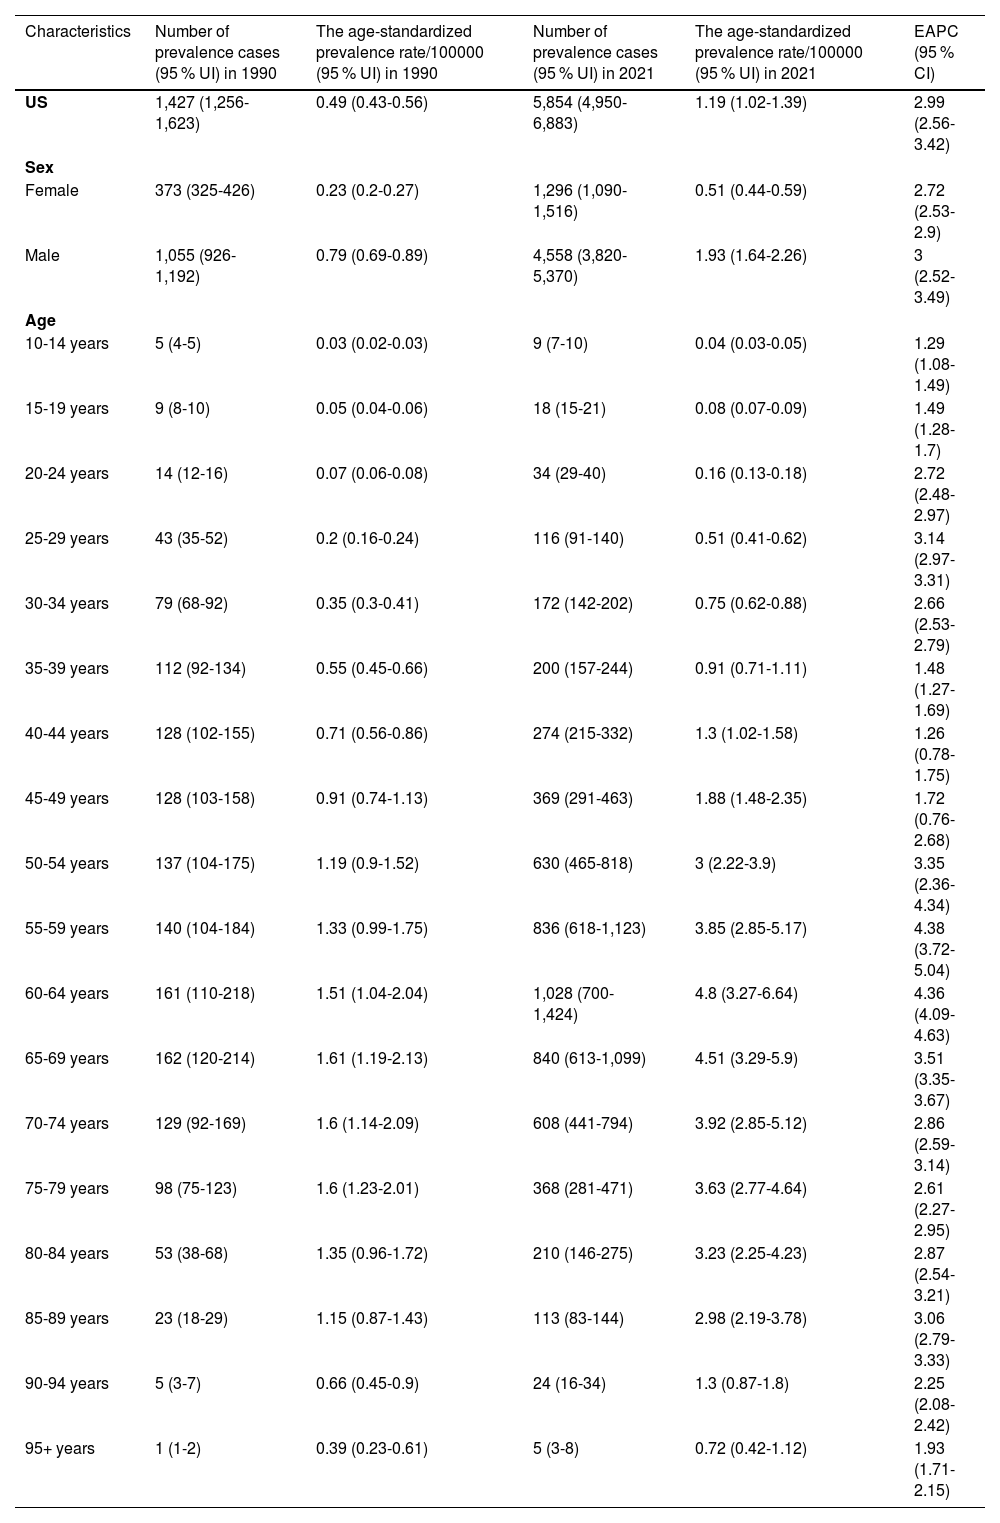
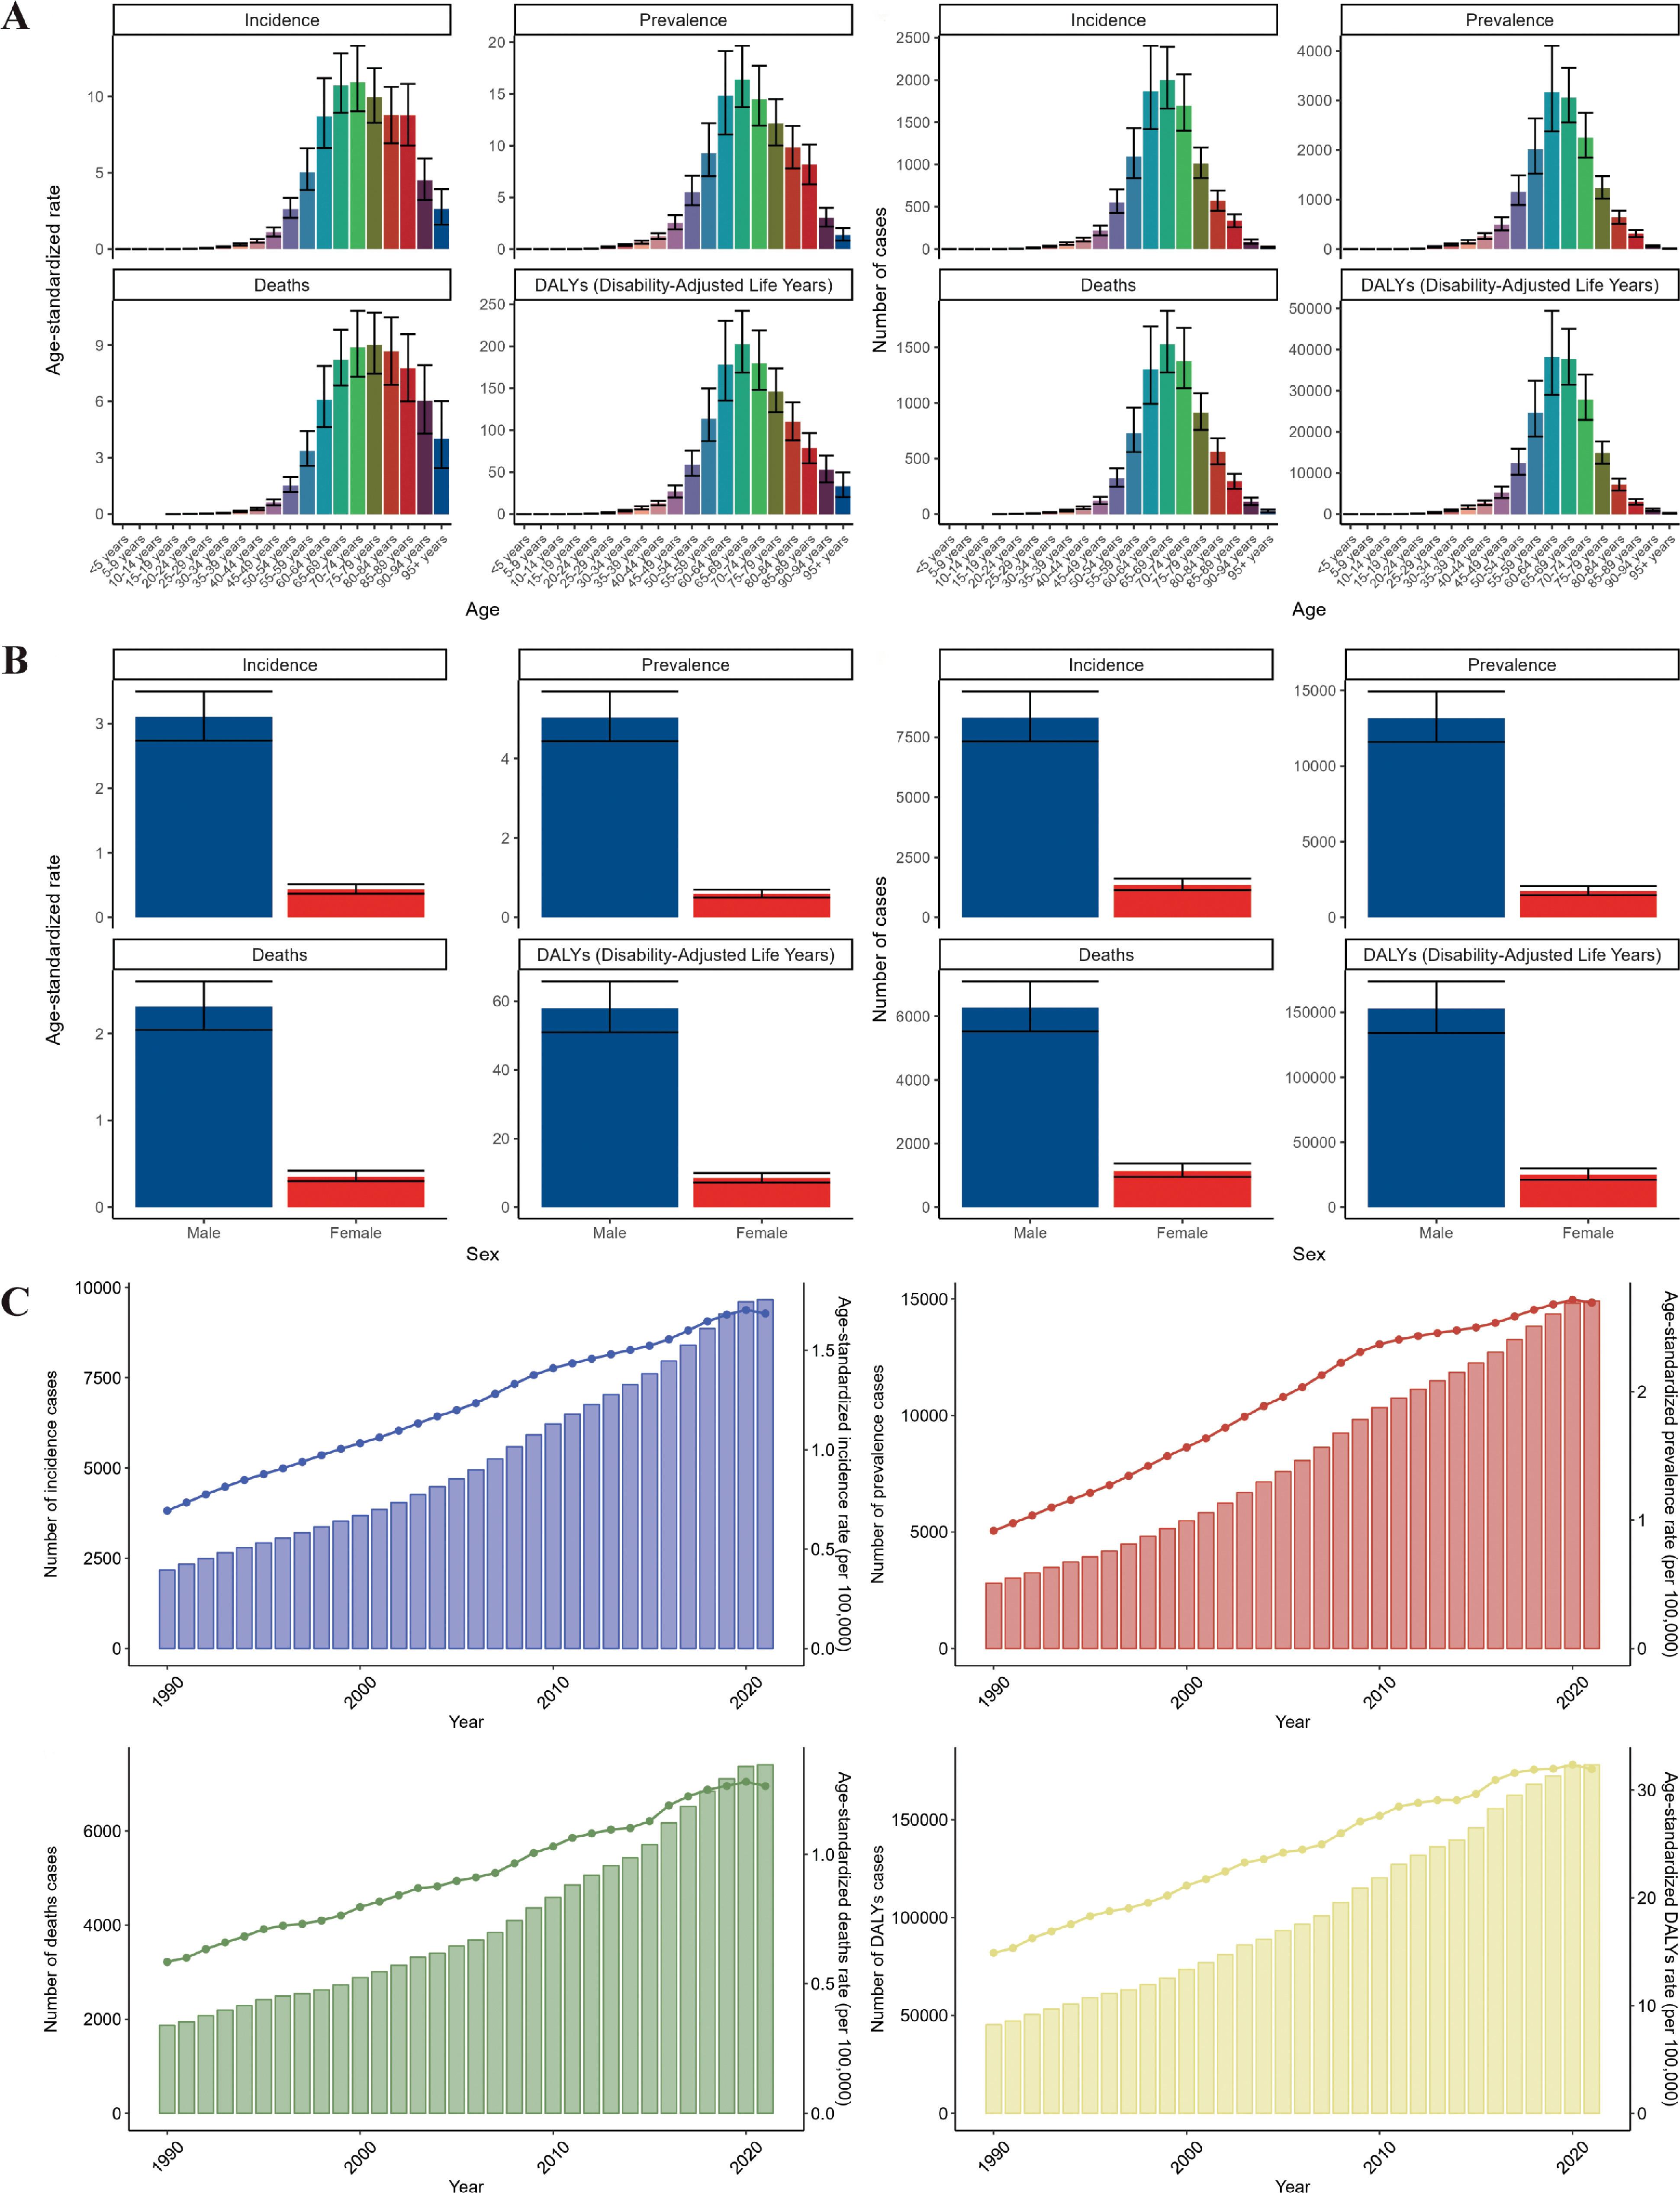
3Results3.1Disease burden and trends of HBV-associated LC in the United States, 2021In 2021, the number of HBV-associated LC-related deaths in the US was 2,643 (95 % UI: 2,186-3,107). There were 1,906 (95 % UI: 1577-2,249) cases in men and 737 (95 % UI: 599-872) cases in women. The ASDR was 0.49 (0.41-0.57)/100,000, which was three times higher in males (0.75 (95 % UI: 0.63-0.88)/100,000) than in females (0.25 (95 % UI: 0.21-0.29)/100,000) (Table 1). The number of DALYs was 70,555 (95 % UI: 59,078-83,218), with the number of DALYs for males (51,970 (95 % UI: 43,244-61,662)) being much larger than the number for females (18,585 (95 % UI: 15,579-21,728)). The corresponding ASR of DALYs increased from 8.22 (95 % UI: 7.22-9.35)/100,000 in 1990 to 14.25 (95 % UI: 12.22-16.66)/100,000 (Table 2). The number of incidence and prevalence cases was 3,568 (95 % UI: 2,972-4,179) and 5,854 (95 % UI: 4,950-6,883), respectively, with corresponding ASIR and ASPR of 0.68 (95 % UI: 0.58-0.79)/100,000 and 1.19 (95 % UI: 1.02-1.39)/100,000, respectively (Tables 3 and 4). The burden of disease for HBV-associated LC increased with age, being highest in the 60-64 age group, and then decreasing with increasing age (Fig. 1A). The associated disease burden was almost three times higher in men than in women (Fig. 1B).
Number of deaths and age-standardized deaths rates due to HBV-associated liver cancer in 1990 and 2021, and trends in US from 1990 to 2021.
| Characteristics | Number of deaths cases (95 % UI) in 1990 | The age-standardized deaths rate/100000 (95 % UI) in 1990 | Number of deaths cases (95 % UI) in 2021 | The age-standardized deaths rate/100000 (95 % UI) in 2021 | EAPC (95 % CI) |
|---|---|---|---|---|---|
| US | 814 (704-934) | 0.27 (0.23-0.31) | 2643 (2186-3107) | 0.49 (0.41-0.57) | 2.05 (1.83-2.27) |
| Sex | |||||
| Female | 254 (216-296) | 0.14 (0.12-0.17) | 737 (599-872) | 0.25 (0.21-0.29) | 1.92 (1.79-2.05) |
| Male | 560 (485-641) | 0.42 (0.36-0.48) | 1906 (1577-2249) | 0.75 (0.63-0.88) | 1.98 (1.73-2.23) |
| Age | |||||
| 10-14 years | 2 (2-2) | 0.01 (0.01-0.01) | 2 (2-3) | 0.01 (0.01-0.01) | 0.25 (0.04-0.45) |
| 15-19 years | 3 (3-4) | 0.02 (0.01-0.02) | 4 (4-5) | 0.02 (0.02-0.02) | 0.13 (-0.07-0.33) |
| 20-24 years | 5 (5-6) | 0.03 (0.02-0.03) | 9 (8-11) | 0.04 (0.04-0.05) | 1.39 (1.2-1.57) |
| 25-29 years | 10 (8-12) | 0.05 (0.04-0.06) | 20 (16-24) | 0.09 (0.07-0.11) | 1.91 (1.74-2.07) |
| 30-34 years | 21 (18-24) | 0.09 (0.08-0.11) | 32 (27-38) | 0.14 (0.12-0.16) | 1.51 (1.21-1.81) |
| 35-39 years | 34 (28-41) | 0.17 (0.14-0.2) | 43 (34-53) | 0.2 (0.15-0.24) | 0.32 (0-0.63) |
| 40-44 years | 45 (36-54) | 0.25 (0.2-0.3) | 61 (48-75) | 0.29 (0.23-0.36) | -0.27 (-0.65-0.11) |
| 45-49 years | 49 (40-61) | 0.35 (0.28-0.44) | 93 (74-117) | 0.47 (0.37-0.6) | 0.32 (-0.39-1.04) |
| 50-54 years | 58 (44-74) | 0.51 (0.39-0.65) | 180 (134-235) | 0.86 (0.64-1.12) | 2 (1.27-2.73) |
| 55-59 years | 72 (54-95) | 0.69 (0.51-0.91) | 310 (230-414) | 1.43 (1.06-1.91) | 3.25 (2.78-3.72) |
| 60-64 years | 95 (64-127) | 0.89 (0.6-1.19) | 432 (294-591) | 2.02 (1.37-2.76) | 3.22 (2.99-3.44) |
| 65-69 years | 111 (83-147) | 1.1 (0.82-1.46) | 430 (316-562) | 2.31 (1.7-3.02) | 2.52 (2.38-2.65) |
| 70-74 years | 106 (76-137) | 1.31 (0.95-1.7) | 378 (274-493) | 2.44 (1.77-3.18) | 1.99 (1.81-2.18) |
| 75-79 years | 95 (73-119) | 1.54 (1.19-1.93) | 280 (211-355) | 2.76 (2.08-3.5) | 1.9 (1.67-2.12) |
| 80-84 years | 62 (44-80) | 1.58 (1.12-2.03) | 191 (132-251) | 2.94 (2.04-3.86) | 2.06 (1.83-2.29) |
| 85-89 years | 31 (24-39) | 1.54 (1.16-1.91) | 113 (81-143) | 2.96 (2.14-3.77) | 2.1 (1.9-2.29) |
| 90-94 years | 11 (8-15) | 1.47 (1.03-2.02) | 49 (34-69) | 2.64 (1.8-3.68) | 1.91 (1.73-2.09) |
| 95+ years | 3 (2-5) | 1.21 (0.71-1.88) | 14 (8-23) | 2.15 (1.25-3.38) | 1.81 (1.54-2.07) |
Number of DALYs and age-standardized DALYs rates due to HBV-associated liver cancer in 1990 and 2021, and trends in US from 1990 to 2021.
| Characteristics | Number of DALYs cases (95 % UI) in 1990 | The age-standardized DALYs rate/100000 (95 % UI) in 1990 | Number of DALYs cases (95 % UI) in 2021 | The age-standardized DALYs rate/100000 (95 % UI) in 2021 | EAPC (95 % CI) |
|---|---|---|---|---|---|
| US | 23,798 (20,906-27,015) | 8.22 (7.22-9.35) | 70,555 (59,078-83,218) | 14.25 (12.22-16.66) | 1.86 (1.62-2.09) |
| Sex | |||||
| Female | 6,827 (5,977-7,790) | 4.31 (3.77-4.94) | 18,585 (15,579-21,728) | 7.26 (6.22-8.35) | 1.86 (1.74-1.97) |
| Male | 16,972 (14,875-19,151) | 12.67 (11.13-14.39) | 51,970 (43,244-61,662) | 21.81 (18.49-25.66) | 1.8 (1.52-2.08) |
| Age | |||||
| 10-14 years | 142 (123-161) | 0.81 (0.7-0.91) | 190 (163-220) | 0.9 (0.77-1.05) | 0.24 (0.04-0.45) |
| 15-19 years | 225 (192-258) | 1.24 (1.06-1.42) | 316 (267-368) | 1.44 (1.22-1.68) | 0.13 (-0.08-0.33) |
| 20-24 years | 365 (315-417) | 1.86 (1.61-2.13) | 629 (532-727) | 2.88 (2.43-3.33) | 1.39 (1.21-1.57) |
| 25-29 years | 653 (535-784) | 3 (2.46-3.61) | 1,246 (989-1,509) | 5.54 (4.39-6.7) | 1.92 (1.76-2.08) |
| 30-34 years | 1,214 (1,041-1,409) | 5.43 (4.66-6.31) | 1,884 (1,573-2,216) | 8.2 (6.84-9.64) | 1.52 (1.23-1.82) |
| 35-39 years | 1,825 (1,513-2,195) | 8.96 (7.42-10.77) | 2,307 (1,816-2,830) | 10.45 (8.22-12.82) | 0.32 (0.01-0.64) |
| 40-44 years | 2,179 (1,750-2,612) | 12.06 (9.69-14.45) | 2,967 (2,312-3,629) | 14.12 (11-17.27) | -0.27 (-0.64-0.11) |
| 45-49 years | 2,140 (1,728-2,647) | 15.28 (12.34-18.91) | 4,053 (3,195-5,102) | 20.58 (16.23-25.91) | 0.32 (-0.39-1.03) |
| 50-54 years | 2,238 (1,714-2,856) | 19.5 (14.94-24.88) | 6,944 (5,172-9,096) | 33.13 (24.67-43.39) | 2 (1.27-2.73) |
| 55-59 years | 2,433 (1,807-3,224) | 23.14 (17.18-30.66) | 10,480 (7,813-14,057) | 48.28 (36-64.76) | 3.26 (2.79-3.73) |
| 60-64 years | 2,755 (1,877-3,699) | 25.85 (17.61-34.7) | 12,634 (8,590-17,249) | 58.95 (40.08-80.49) | 3.23 (3.01-3.46) |
| 65-69 years | 2,726 (2,025-3,607) | 27.04 (20.09-35.78) | 10,600 (7,801-13,845) | 56.91 (41.88-74.33) | 2.54 (2.41-2.67) |
| 70-74 years | 2,141 (1,541-2,778) | 26.5 (19.07-34.38) | 7,650 (5,546-9,973) | 49.34 (35.77-64.32) | 2.01 (1.83-2.19) |
| 75-79 years | 1,532 (1,182-1,918) | 24.97 (19.27-31.26) | 4,535 (3,406-5,750) | 44.69 (33.56-56.66) | 1.9 (1.68-2.12) |
| 80-84 years | 790 (561-1,013) | 20.06 (14.25-25.71) | 2,428 (1,675-3,174) | 37.37 (25.79-48.85) | 2.05 (1.82-2.28) |
| 85-89 years | 317 (240-394) | 15.55 (11.76-19.35) | 1,140 (824-1,455) | 29.98 (21.69-38.28) | 2.09 (1.89-2.29) |
| 90-94 years | 99 (69-135) | 12.91 (9.01-17.67) | 431 (295-601) | 23.13 (15.82-32.24) | 1.91 (1.73-2.09) |
| 95+ years | 25 (15-39) | 9.92 (5.8-15.53) | 119 (69-188) | 17.73 (10.29-28.04) | 1.79 (1.52-2.06) |
Number of incidence and age-standardized incidence rates due to HBV-associated liver cancer in 1990 and 2021, and trends in US from 1990 to 2021.
| Characteristics | Number of incidence cases (95 % UI) in 1990 | The age-standardized incidence rate/100000 (95 % UI) in 1990 | Number of incidence cases (95 % UI) in 2021 | The age-standardized incidence rate/100000 (95 % UI) in 2021 | EAPC (95 % CI) |
|---|---|---|---|---|---|
| US | 996 (869-1,135) | 0.33 (0.29-0.38) | 3,568 (2,972-4,179) | 0.68 (0.58-0.79) | 2.36 (2.07-2.65) |
| Sex | |||||
| Female | 287 (245-331) | 0.17 (0.15-0.19) | 912 (754-1,077) | 0.33 (0.28-0.38) | 2.21 (2.07-2.36) |
| Male | 709 (618-806) | 0.53 (0.46-0.6) | 2,657 (2,215-3,133) | 1.07 (0.91-1.26) | 2.31 (1.97-2.64) |
| Age | |||||
| 10-14 years | 2 (2-3) | 0.01 (0.01-0.01) | 3 (3-4) | 0.02 (0.01-0.02) | 0.77 (0.6-0.94) |
| 15-19 years | 5 (4-5) | 0.02 (0.02-0.03) | 8 (7-9) | 0.04 (0.03-0.04) | 0.97 (0.78-1.15) |
| 20-24 years | 8 (6-9) | 0.04 (0.03-0.04) | 16 (14-19) | 0.07 (0.06-0.08) | 2.2 (2.01-2.39) |
| 25-29 years | 16 (13-19) | 0.07 (0.06-0.09) | 38 (30-46) | 0.17 (0.13-0.2) | 2.67 (2.53-2.81) |
| 30-34 years | 33 (28-38) | 0.15 (0.13-0.17) | 63 (52-74) | 0.27 (0.23-0.32) | 2.21 (2.04-2.37) |
| 35-39 years | 57 (47-68) | 0.28 (0.23-0.33) | 88 (69-107) | 0.4 (0.31-0.49) | 0.96 (0.73-1.19) |
| 40-44 years | 71 (57-85) | 0.39 (0.31-0.47) | 117 (92-142) | 0.56 (0.44-0.68) | 0.31 (-0.1-0.73) |
| 45-49 years | 73 (58-90) | 0.52 (0.42-0.64) | 165 (130-208) | 0.84 (0.66-1.06) | 0.84 (0.03-1.65) |
| 50-54 years | 83 (63-106) | 0.72 (0.55-0.92) | 305 (225-396) | 1.46 (1.07-1.89) | 2.51 (1.68-3.34) |
| 55-59 years | 93 (70-123) | 0.89 (0.66-1.17) | 462 (343-625) | 2.13 (1.58-2.88) | 3.63 (3.11-4.15) |
| 60-64 years | 118 (81-159) | 1.1 (0.76-1.49) | 613 (418-848) | 2.86 (1.95-3.96) | 3.58 (3.36-3.79) |
| 65-69 years | 129 (96-171) | 1.28 (0.95-1.69) | 559 (406-723) | 3 (2.18-3.88) | 2.83 (2.71-2.95) |
| 70-74 years | 117 (84-152) | 1.44 (1.04-1.88) | 462 (332-601) | 2.98 (2.14-3.87) | 2.23 (2.02-2.43) |
| 75-79 years | 96 (74-119) | 1.56 (1.21-1.95) | 307 (231-390) | 3.03 (2.28-3.85) | 2.04 (1.79-2.3) |
| 80-84 years | 58 (41-74) | 1.46 (1.05-1.87) | 192 (133-250) | 2.95 (2.05-3.84) | 2.23 (1.98-2.49) |
| 85-89 years | 30 (23-37) | 1.49 (1.12-1.84) | 124 (90-157) | 3.27 (2.37-4.14) | 2.46 (2.25-2.67) |
| 90-94 years | 8 (6-11) | 1.06 (0.73-1.44) | 36 (25-51) | 1.96 (1.32-2.71) | 2.02 (1.86-2.18) |
| 95+ years | 2 (1-3) | 0.77 (0.45-1.2) | 9 (5-15) | 1.4 (0.81-2.19) | 1.9 (1.68-2.12) |
Number of prevalence and age-standardized prevalence rates due to HBV-associated liver cancer in 1990 and 2021, and trends in US from 1990 to 2021.
| Characteristics | Number of prevalence cases (95 % UI) in 1990 | The age-standardized prevalence rate/100000 (95 % UI) in 1990 | Number of prevalence cases (95 % UI) in 2021 | The age-standardized prevalence rate/100000 (95 % UI) in 2021 | EAPC (95 % CI) |
|---|---|---|---|---|---|
| US | 1,427 (1,256-1,623) | 0.49 (0.43-0.56) | 5,854 (4,950-6,883) | 1.19 (1.02-1.39) | 2.99 (2.56-3.42) |
| Sex | |||||
| Female | 373 (325-426) | 0.23 (0.2-0.27) | 1,296 (1,090-1,516) | 0.51 (0.44-0.59) | 2.72 (2.53-2.9) |
| Male | 1,055 (926-1,192) | 0.79 (0.69-0.89) | 4,558 (3,820-5,370) | 1.93 (1.64-2.26) | 3 (2.52-3.49) |
| Age | |||||
| 10-14 years | 5 (4-5) | 0.03 (0.02-0.03) | 9 (7-10) | 0.04 (0.03-0.05) | 1.29 (1.08-1.49) |
| 15-19 years | 9 (8-10) | 0.05 (0.04-0.06) | 18 (15-21) | 0.08 (0.07-0.09) | 1.49 (1.28-1.7) |
| 20-24 years | 14 (12-16) | 0.07 (0.06-0.08) | 34 (29-40) | 0.16 (0.13-0.18) | 2.72 (2.48-2.97) |
| 25-29 years | 43 (35-52) | 0.2 (0.16-0.24) | 116 (91-140) | 0.51 (0.41-0.62) | 3.14 (2.97-3.31) |
| 30-34 years | 79 (68-92) | 0.35 (0.3-0.41) | 172 (142-202) | 0.75 (0.62-0.88) | 2.66 (2.53-2.79) |
| 35-39 years | 112 (92-134) | 0.55 (0.45-0.66) | 200 (157-244) | 0.91 (0.71-1.11) | 1.48 (1.27-1.69) |
| 40-44 years | 128 (102-155) | 0.71 (0.56-0.86) | 274 (215-332) | 1.3 (1.02-1.58) | 1.26 (0.78-1.75) |
| 45-49 years | 128 (103-158) | 0.91 (0.74-1.13) | 369 (291-463) | 1.88 (1.48-2.35) | 1.72 (0.76-2.68) |
| 50-54 years | 137 (104-175) | 1.19 (0.9-1.52) | 630 (465-818) | 3 (2.22-3.9) | 3.35 (2.36-4.34) |
| 55-59 years | 140 (104-184) | 1.33 (0.99-1.75) | 836 (618-1,123) | 3.85 (2.85-5.17) | 4.38 (3.72-5.04) |
| 60-64 years | 161 (110-218) | 1.51 (1.04-2.04) | 1,028 (700-1,424) | 4.8 (3.27-6.64) | 4.36 (4.09-4.63) |
| 65-69 years | 162 (120-214) | 1.61 (1.19-2.13) | 840 (613-1,099) | 4.51 (3.29-5.9) | 3.51 (3.35-3.67) |
| 70-74 years | 129 (92-169) | 1.6 (1.14-2.09) | 608 (441-794) | 3.92 (2.85-5.12) | 2.86 (2.59-3.14) |
| 75-79 years | 98 (75-123) | 1.6 (1.23-2.01) | 368 (281-471) | 3.63 (2.77-4.64) | 2.61 (2.27-2.95) |
| 80-84 years | 53 (38-68) | 1.35 (0.96-1.72) | 210 (146-275) | 3.23 (2.25-4.23) | 2.87 (2.54-3.21) |
| 85-89 years | 23 (18-29) | 1.15 (0.87-1.43) | 113 (83-144) | 2.98 (2.19-3.78) | 3.06 (2.79-3.33) |
| 90-94 years | 5 (3-7) | 0.66 (0.45-0.9) | 24 (16-34) | 1.3 (0.87-1.8) | 2.25 (2.08-2.42) |
| 95+ years | 1 (1-2) | 0.39 (0.23-0.61) | 5 (3-8) | 0.72 (0.42-1.12) | 1.93 (1.71-2.15) |
 Distribution of HBV-associated LC disease burden by age and sex in the United States in 2021. (C) Trends in the burden of disease for HBV-associated LC in the United States, 1990-2021.")
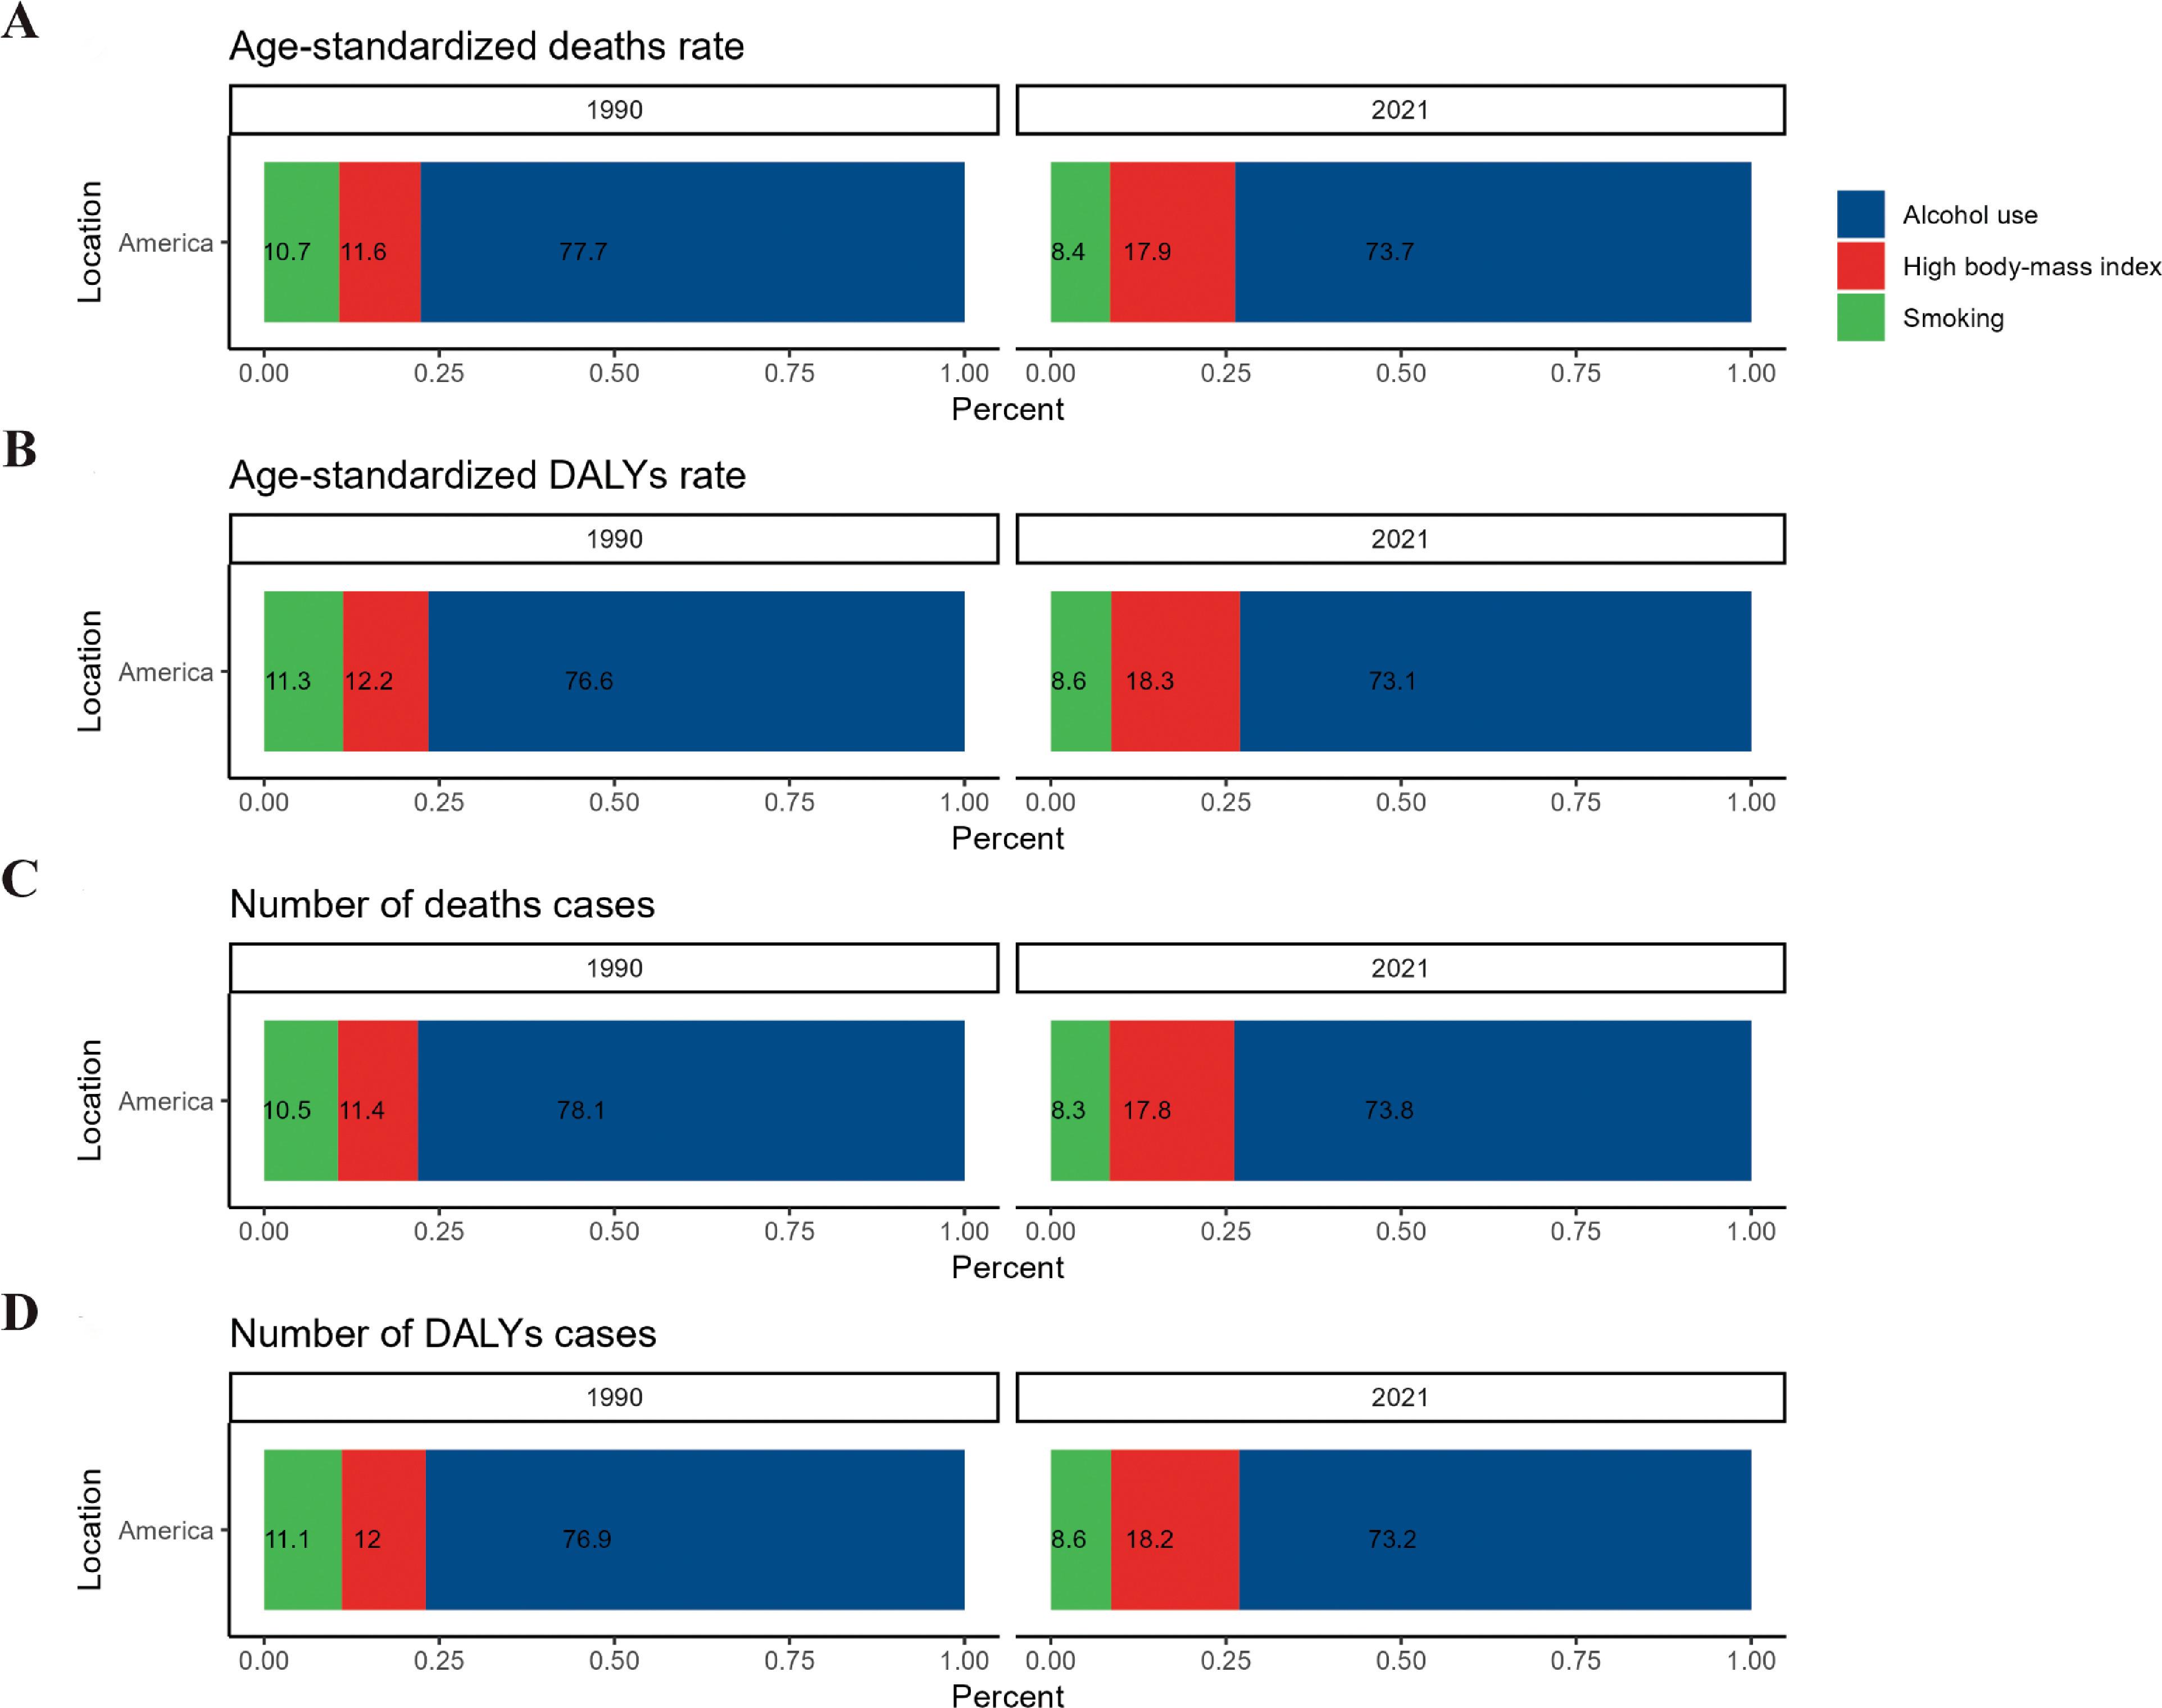
The deaths, DALYs, incidence and prevalence cases of HBV-associated LC nearly tripled from 1990 to 2021 (Tables 1–4 and Fig. 1C). ASDR, ASR of DALY, ASIR, and ASPR of HBV-associated LC likewise showed a significant increase. The largest increase was seen in the 60–64-year-old age group (Fig. 2A). Overall, the trend of increasing disease burden was most pronounced in the 50-79-year-old age group. The upward trend was more pronounced in males than in females (Fig. 2B). According to our ES (Fig. 3A) and BAPC (Fig. 3B) prediction models, deaths, DALYs, incidence, and prevalence cases of HBV-associated LC still continue to rise, while the corresponding ASR remained stable. We further analyzed the risk factors for HBV-associated LC and showed that drug use, high body mass index, and smoking were all significantly associated with the disease, but drug use had the strongest association (Fig. 4A-D).
 Trends in the Burden of Disease for HBV-associated LC by age and sex in the United States, 1990-2021.")
 Trends in HBV-associated LC disease burden in the United States through 2046 as projected by the ES projection model. (B) Trends in HBV-associated LC disease burden in the United States through 2046 as projected by the BAPC projection model.")
 Risk factors for HBV-associated LC in the United States.")
The results of this study indicate that the number of HCV-associated LC deaths in the US in 2021 was 9,844 (95 % UI: 8600-10,993), a nearly four-fold increase from 2,390 (95 % UI: 2,142-2,618) in 1990. Of these, 5514 (95 % UI: 4788-6214) were males and 4330 (95 % UI: 3716-4794) were females. The ASDR was 1.64 (95 % UI: 1.44-1.83)/100,000, a 121.6 % increase compared 0.74 (95 % UI: 0.66-0.81)/100,000 in 1990 (Table S1). Deaths from HCV-associated LC were highest in the 65-69-year-old age group, and the ASDR was greatest in the 90-94-year-old age group (Fig. 5A). The number of DALYs was 213,410 (95 % UI: 189,526-238,714). For males, DALYs were 125,474 (95 % UI: 109,444-143,148), and for females it was 87,936 (95 % UI: 77,833-96,883). The ASR of DALYs was 37.33 (95 % UI: 33.14-41.64)/100,000, which was 2.18 times higher than that of 1990. ASR of DALYs was 28.72 (95 % UI: 25.58-31.55)/100,000 for males and 46.92 (95 % UI: 40.98-53.21)/100,000 for females (Table S2). The number of incidence and prevalence cases were 12,043 (95 % UI: 10,582-13,412) and 16,980 (95 % UI: 15,041-18,963), respectively. Prevalence cases in 2021 were 5.4 times higher than those in 1990, and the ASIR and ASPR were 2.05 (95 % CI: 1.81-2.28)/100,000 and 2.99 (95 % UI: 2.65-3.33)/100,000, respectively (Tables S3-4). Overall, the burden of HCV-associated LC was greater in men than in women (Fig. 5B).
 Distribution of HCV-associated LC disease burden by age and sex in the United States in 2021. (C) Trends in the burden of disease for HCV-associated LC in the United States, 1990-2021.")
As can be seen in Fig. 5C, HCV-associated LC deaths, DALYs, incidence, and prevalence cases, and corresponding ASRs, all significantly increased between 1990 and 2021, with the most pronounced trend of increasing disease burden in the 60-69-year-old age group, and the most significant upward trend in ASRs in those older than 50 years (Fig. 6A). Similar to the results for HBV-associated LC, the trend of increasing disease burden was significantly higher in men than in women (Fig. 6B). Over the next 25 years, the disease burden of HCV-associated LC will increase significantly based on both ES and BAPC prediction models (Fig. 7A-B). One of the most important risk factors is drug use (Fig. 8A-D).
 Trends in the Burden of Disease for HCV-associated LC by age and sex in the United States, 1990-2021.")
 Trends in HCV-associated LC disease burden in the United States through 2046 as projected by the ES projection model. (B) Trends in HCV-associated LC disease burden in the United States through 2046 as projected by the BAPC projection model.")
 Risk factors for HCV-associated LC in the United States.")
In 2021, the number of deaths due to alcohol-associated LC in the US was 7,406 (95 % UI: 6,496-8,419), with males (6,269 (95 % UI: 5,519-7,084)) outnumbering females (1,137 (95 % UI: 953-1,369)) by a factor of 5.51. The number of alcohol-associated LC related deaths increased with age, peaking in the 65-69-year-old age group after which it gradually declined (Fig. S1A-B). The ASDR was 2.31 (95 % UI: 2.04-2.6)/100,000 in men and only 0.35 (95 % UI: 0.3-0.42)/100,000 in women (Table S5). DALYs, incidence, and prevalence cases were 178,037 (95 % UI: 155,924-202,456), 9,659 (95 % CI: 8,497-10,976), and 14,908 (95 % UI: 13,041-16,942), respectively. The corresponding ASR of DALYs, ASIR, and ASR were 31.94 (95 % CI: 27.99-36.4)/100,000, 1.69 (95 % UI: 1.48-1.91)/100,000, and 2.7 (95 % UI: 2.37-3.06)/100,000 (Tables S6-8), respectively.
From 1990 to 2021, the disease burden of alcohol-associated LC has been increasing. The associated deaths, DALYs, incidence, and prevalence cases in 2021 were 3.95, 3.94, 4.44, and 5.33 times higher than that of 1990, respectively (Figure S1C).
The increase in disease burden was most pronounced in the 60-69-year-old age group (Figure S2A). By gender, the increase in disease burden of alcohol-associated LC was less pronounced in females (Figure S2B). According to our ES prediction model, the trend of increasing deaths, DALYs, incidence, and prevalence cases of alcohol-associated LC will significantly slow down or even stabilize in the future, whereas the ARDS, ASR of DALYs, ASIR, and ASPR will decrease (Figure S3A). The ES model (Figure S3A) showed a downward trend in the burden of alcohol-associated LC, while the BAPC prediction model (Figure S3B) showed that the burden of alcohol-associated LC will continue to increase over the next 25 years, which may be due to the consideration of age in the BAPC model. These differing results indicate uncertainty in predicting future disease burden, and further exploration of other disease prediction models will be imperative for providing accurate references for future disease prevention and control. As expected, the risk factor most closely associated with alcohol-associated LC was alcohol intake (Figure S4A-D).
3.4Disease burden and trends of MASLD-associated LC in the United States, 2021In 2021, MASLD-associated LC-related deaths, DALYs, incidence, and prevalence cases in the US were 2,799 (95 % UI: 2,341-3,270), 59,666 (95 % UI: 50,446-70,049), 3,381 (95 % UI: 2,855-3,958), and 4,695 (95 % UI: 3,960-5,519), respectively. ASDR, ASR of DALYs, ASIR, and ASPR were 0.47 (95 % CI: 0.4-0.55)/100,000, 10.59 (95 % UI: 9.08-12.28)/100,000, 0.58 (95 % UI: 0.49-0.68)/100,000, 0.84 (95 % UI: 0.72-0.98)/100,000, respectively (Tables S9-12). The highest number of deaths and DALYs were in the 70-74-year-old age group and 60-69-year-old age group, respectively (Figure S5A). The burden of disease was greater in males than in females (Figure S5B).
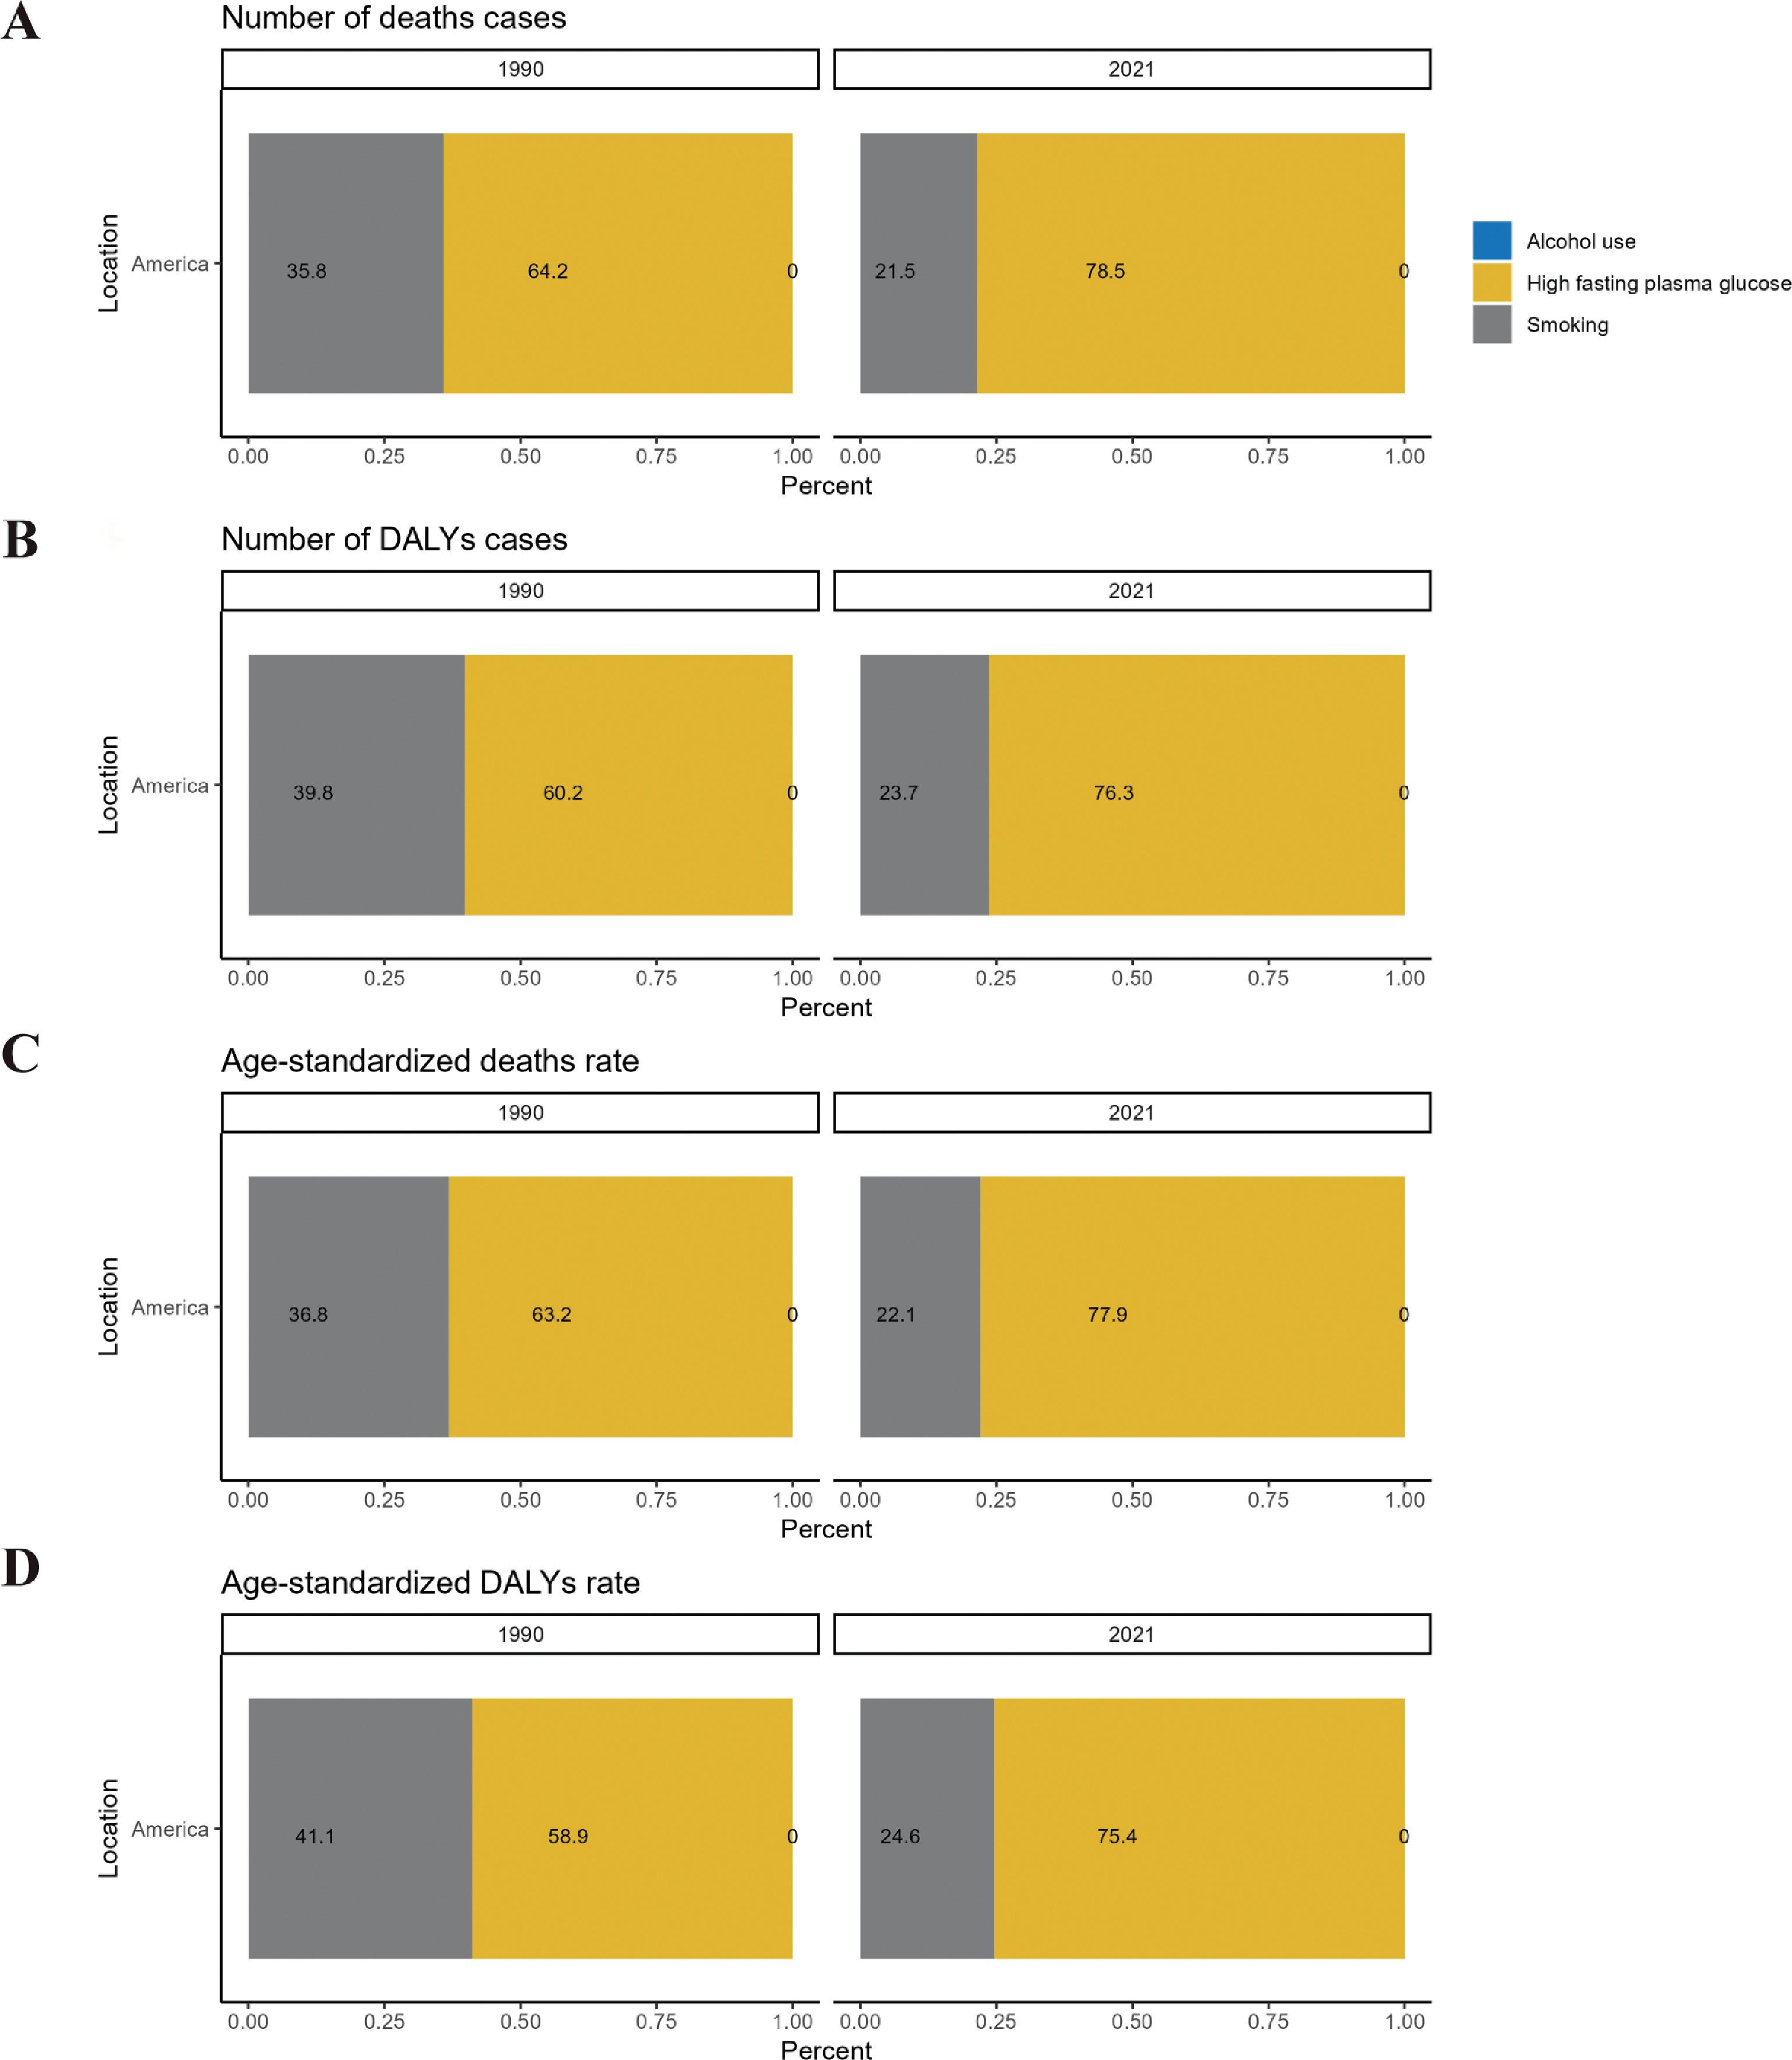
The burden of disease associated with MASLD-associated LC has been increasing in the US since 1990 (Figure S5C), with the most pronounced increase amongst the 60-69-year-old age group (Figure S6A) and in men compared to women (Figure S6B). ES (Figure S7A) and BAPC (Figure S7B) prediction models show that the disease burden from MASLD-associated LC is still increasing. Among the many risk factors, the one most closely associated with MASLD-associated LC is high fasting plasma glucose (Figure S8A-D).
4DiscussionIn this study, we analyzed the trends, population distribution characteristics, and associated risk factors of LC due to different etiologies in the US from 1990 to 2021. We also predicted the future trends of various LC etiologies using ES and BAPC prediction modeling.
Our results showed that the disease burden of LC of four different etiologies has increased significantly over the past few decades. MASLD-associated LC had the largest factor increase in deaths, with a 324 % increase and corresponding 135 % increase in ASDR from 1990. Overall, the disease burden of LC due to different etiologies increased with age, mostly peaking in the 60-69-year-old age group then declining. Across the four different causes of LC, the burden of disease was greater in men than women, and this gender difference was most pronounced in HBV-associated LC and alcohol-associated LC. The results of our predictive modeling indicate that the deaths, DALYs, incidence, and prevalence cases of LC due to these four etiologies are still expected to continue to increase over the next 25 years, with the corresponding ASRs remaining stable or showing a slowly increasing trend. HCV-associated LC and alcohol-associated LC are the two leading causes of LC disease burden in the US.
Compared to our study, Tan, Danpanichkul et al [18]. used GBD 2021 data to conduct a detailed analysis of the overall disease burden of LC globally, but did not specifically analyze trends in the burden of LC-related diseases in individual countries. Their results show a decline in ASIR and ASDR of LC globally, but a concerning increase in the Americas and Southeast Asia. Given that the US is an important country in the Americas, our study focused on a detailed analysis of the past and future disease burden trends and the main causes of LC in the US, so as to provide references for the prevention and control of LC in the US specifically. The reliability of our data is enhanced by the fact that the burden of LC in the US is in line with the overall trend in the Americas, as evidenced by Tan, Danpanichkul et al [18].’s publication. The rapidly increasing disease burden of MASLD-associated LC both globally and in the US suggests that MASLD may become a significant public health concern. The ASIR and ASDR of HBV and HCV-associated LC are on the decline globally, while they are on the rise in the US, indicating that the US faces unique challenges in the prevention and control of these LCs. In addition, we note that their study shows that HBV remains the leading cause of LC cases and deaths globally, while HCV remains the leading cause in the US.
HCV is a major driver of LC. GBD 2019 data suggests that there are about 113 million HCV-infected individuals globally [19]. An estimated 20 % of LC cases are associated with HCV. While the most common cause of LC worldwide today is HBV infection (41 % of all causes) [19], our study found that HCV infection was the predominant cause of LC in the U.S. Al Ta'ani et al. analyzed the epidemiology of LC in the U.S. using GBD 2019 data and also found that HCV has been the leading cause of LC from 1990 to the present day [20], further bolstered by our studying using GBD 2021 data. The burden of disease from HCV-associated LC is expected to remain the highest in the next 25 years. At present, there is no prophylactic vaccine for HCV, but direct-acting antivirals (DAAs) provide a cure for 95 % of patients. While DAAs could theoretically mitigate HCV-associated LC disease burden, our data does not show a trend toward disease remission. This finding may be related to the US experiencing an opioid/heroin epidemic, as injectable drug use is a major source of HCV infection [21]. Since 2002, the prescription of opioid analgesics in the US has increased dramatically, and the transition from oral opioids to injectable opioids and heroin has increased significantly, with heavy sharing and non-sterile use of syringes leading to further transmission of HCV [22]. Meanwhile, with the continuous improvement of HCV testing technology, simple, convenient, and inexpensive anti-HCV and HCV-RNA screening have improved the accessibility of testing, with good specificity and sensitivity further increasing the detection rate of HCV [23]. In addition, although DAAs with high sustained virologic response rates (SVRs) have shown promising therapeutic efficacy against HCV, high costs have left a large proportion of HCV patients in the US untreated [24] and lengthy treatment regimens are often challenging for patient compliance. Treatment initiation rates were just 21-30 % among HCV patients [25,26]. Taken together, these factors may explain why the disease burden of HCV-associated LC in the US has remained high.
Alcohol-related liver disease (ARLD) is one of the common causes of LC [27]. According to our data, in the US, the disease burden of alcohol-associated LC is second only to HCV-associated LC, and our predictive modeling suggests that the number of alcohol-associated LC deaths and DALYs cases will remain stable or increase in the coming decades. A study by Zobair M. Younossi and his team found that the US has the highest number of alcohol-associated LC cases [19], with ASRs much greater in men than women, which is consistent with our findings. Globally, per capita alcohol consumption increased from 5.5 liters in 2005 to 6.4 liters in 2016, and is projected to increase further to 7.6 liters by 2030. Alcohol is associated with approximately one in five hepatocellular carcinoma-related deaths worldwide, as of 2019. The ASDR for alcohol-associated LC has increased in recent years [28]. As such, there is an urgent need to take measures to curb heavy drinking and reduce the burden of alcohol-related LC, with a particular focus on the male population, who are the mainstay of alcohol consumption [29]. On a policy level, the US may consider increasing the price of alcohol and/or imposing targeted taxes to reduce the burden of alcohol-associated LC.
Amongst the four etiologies studied, we found MASLD-associated LC to be the fastest growing LC in the US, as supported by prior research [30]. The American diet mainly consists of “energy-dense” foods, which are highly processed and high in fat and calories. At present, one in three children from the US has overweight or obesity [31]. With the dramatic increase in the number of obese people, the incidence of MASLD-associated LC has increased rapidly. Our predictive modeling suggests that the burden of disease for MASLD-associated LC will continue to rise in the coming decades. Future interventions should focus on obesity prevention and management, with a particular focus on addressing blood glucose, given that fasting hyperglycemia is most important risk factor for the development of MASLD-associated LC.
Our study also observed an increase in the number of LC cases of all etiologies with increasing age, reaching a peak and then declining. The aging of the population is now a global trend [32], and the US is no exception. According to the Centers for Disease Control and Prevention, 54.1 million U.S. adults, or 16 % of the population, were age 65 or older in 2019. It is estimated that the number of people aged 65 and older is projected to reach 80.8 million by 2040 and 94.7 million by 2060, or 25 percent of the U.S. population [33]. Cancer risk increases with age, and with the dramatic increase in the elderly population in the US, the burden of LC disease has increased. Interestingly, our study observed an overall decrease in LC disease burden with increasing age in patients older than 80 years. This is similar to the findings of a study by Shantell C. Nolen, which found that the incidence of cancer in older adults declined at age 80 and approached zero around age 100. Cancer mortality or cancer as a cause of death declines with age. The mortality rate is about 25-46 % at ≤80 years of age and 21 % at 90-99 years of age [34]. These trends may be due to the fact that tumors in the elderly are slower growing and less invasive, or that the elderly may die from other causes before the tumor spreads. Therefore, differences in the burden of disease in different age groups should be fully taken into account when formulating prevention and treatment measures, with those in the 50-80-year-old age group having a high burden of disease and need for intervention.
This study has some limitations. First, our study only analyzed the etiology of LC in the US as a whole and did not analyze the prevalence of the disease in specific regions, provinces, or among migrants of different nationalities. Second, we only analyzed viral, alcohol-related, and MASLD-associated LC, and did not analyze data on LC from other causes (e.g., aflatoxin exposure). In addition, epidemiologic data can be inconsistent, as the diagnostic and surveillance systems are constantly changing. Finally, we used the GBD database to analyze trends in LC disease burden but were unable to distinguish intrahepatic cholangiocarcinoma from hepatocellular carcinoma.
5ConclusionsIn summary, the burden of disease associated with LC in the US continues to rise across different etiologic factors, with the burden of HCV-associated LC and incidence of MASLD-associated LC being the highest. LC disease burden varied across age and gender. Our study serves as an important reference for the development of LC-related prevention and control strategies in the US.
Author contributionsPKN, HZ, DYW designed the overall research, DYW collected data and verified the accuracy of the data; DYW, HZ and MHT prepared manuscript and images; DYW, SHT, SNK, SHS, KL and YWZ analyzed and interpreted data; all authors contributed to revise manuscript. All authors read and approved the final manuscript.
FundingThis work was partly supported by the Clinical Research Project of Xiangya Hospital (No: 2016L06) and the Changsha Natural Science Foundation of Hunan Provincial of China (No: kq2208376).
Data availabilityThis study follows the Guidelines for Accurate and Transparent Health Estimates Reporting (GATHER). To download the data used in these analyses, please visit the Global Health Data Exchange (GHDx). https://ghdx.healthdata.org/gbd-2021.
We thank the collaborators of the Global Burden of Diseases 2021 database, Injuries and Risk Factors Study 2021 for their outstanding contributions. We sincerely thank the IHME Institution for providing the GBD data. Financial support from the Clinical Research Project of Xiangya Hospital


