


The increasing incidence of hepatocellular carcinoma (HCC) in China is an urgent issue, necessitating early diagnosis and treatment. This study aimed to develop personalized predictive models by combining machine learning (ML) technology with a demographic, medical history, and noninvasive biomarker data. These models can enhance the decision-making capabilities of physicians for HCC in hepatitis B virus (HBV)-related cirrhosis patients with low serum alpha-fetoprotein (AFP) levels.
Patients and MethodsA total of 6,980 patients treated between January 2012 and December 2018 were included. Pre-treatment laboratory tests and clinical data were obtained. The significant risk factors for HCC were identified, and the relative risk of each variable affecting its diagnosis was calculated using ML and univariate regression analysis. The data set was then randomly partitioned into validation (20 %) and training sets (80 %) to develop the ML models.
ResultsTwelve independent risk factors for HCC were identified using Gaussian naïve Bayes, extreme gradient boosting (XGBoost), random forest, and least absolute shrinkage and selection operation regression models. Multivariate analysis revealed that male sex, age >60 years, alkaline phosphate >150 U/L, AFP >25 ng/mL, carcinoembryonic antigen >5 ng/mL, and fibrinogen >4 g/L were the risk factors, whereas hypertension, calcium <2.25 mmol/L, potassium ≤3.5 mmol/L, direct bilirubin >6.8 μmol/L, hemoglobin <110 g/L, and glutamic-pyruvic transaminase >40 U/L were the protective factors in HCC patients. Based on these factors, a nomogram was constructed, showing an area under the curve (AUC) of 0.746 (sensitivity = 0.710, specificity=0.646), which was significantly higher than AFP AUC of 0.658 (sensitivity = 0.462, specificity=0.766). Compared with several ML algorithms, the XGBoost model had an AUC of 0.832 (sensitivity = 0.745, specificity=0.766) and an independent validation AUC of 0.829 (sensitivity = 0.766, specificity = 0.737), making it the top-performing model in both sets. The external validation results have proven the accuracy of the XGBoost model.
ConclusionsThe proposed XGBoost demonstrated a promising ability for individualized prediction of HCC in HBV-related cirrhosis patients with low-level AFP.
Liver cancer is the third leading cause of cancer-related death and the sixth most commonly diagnosed cancer worldwide, accounting for >0.91 million new cases and 0.83 million deaths annually [1]. In China, liver cancer is the main cause of death [2]. China also has the largest population living with hepatitis B virus (HBV), accounting for one-third of the world's infected population [3]. Patients with HBV infection have a higher risk of liver cancer, of which 40 % progress to cirrhosis and hepatocellular carcinoma (HCC). Furthermore, HBV-infected patients with advanced cirrhosis or fibrosis have a higher chance of developing HCC. More than 250 million individuals worldwide are infected with hepatitis B virus (HBV). Persistent HBV replication is a risk factor for CHB progression to cirrhosis and hepatocellular carcinoma (HCC). Between 20 and 30 million people have chronic hepatitis B (CHB) infection [4–6].
Early detection, diagnosis, and treatment are the keys to effectively controlling HBV-related HCC. Serum tumor marker detection and liver imaging examination are the main methods for liver cancer diagnosis. However, commonly used serum tumor markers such as alpha-fetoprotein (AFP) have a high false-negative rate and suboptimal sensitivity in the diagnosis of liver cancer or liver cancer with small tumor volume [7–9]. Liver cancer imaging examinations have certain limitations, such as exposure to radiation in computed tomography and intolerance to iodine contrast agents. Additionally, magnetic resonance imaging is not suitable for patients with pacemakers or those who have ferromagnetic substances in their bodies. In liver cirrhosis patients, traditional imaging techniques struggle to detect small hepatocellular carcinoma (HCC) lesions. Liver puncture biopsy, although invasive, is also associated with high risks. Furthermore, molecular biology diagnostic technology, while effective, is not cost-effective and not widely used for diagnosing liver cancer
Machine learning (ML) has demonstrated the potential to enhance clinical decision-making and accurately predict early fibrosis and liver cancer, making it a reliable and noninvasive preoperative method for classifying HCC patients with low-level AFP and HBV-related cirrhosis [10]. Previous studies have employed various deep learning and ML algorithms to detect HCC [11–17]. For instance, Hashem et al. constructed several HCC classification models based on ML algorithms using simple factors such as age, AFP, alkaline phosphate (ALP), albumin (ALB), and total bilirubin (TB) [18]. Liu et al. developed an artificial neural network (ANN)-based scoring system for progression-free survival in liver cancer (using ML algorithms) from a sample of 2890 patients with HBV-related HCC [19].
Traditional models generally consider linear or logistic relationships between the risk factors; in contrast, ML approaches consider all possible interactions between the variables as potentially important, which can result in a significant predictive superiority over traditional regression models [20]. Machine learning solutions, such as gradient boosting machines, empower computers to learn from large-scale, diverse datasets and have shown superior performance compared to regression modeling in various clinical scenarios.
Developing a noninvasive prediction model for patients with cirrhosis or suspected hepatocellular carcinoma (HCC) holds immense importance due to the risks associated with liver biopsy. Thus, our objective in this study was to identify the risk factors and establish an ML-based diagnostic model for HCC in patients with HBV-related cirrhosis that is both noninvasive and cost-effective. This innovative predictive model for HCC exhibited strong performance and serves as a convenient reference for decision-making. Additionally, it effectively aids in identifying high-risk groups for cirrhosis, enabling physicians to initiate interventions at an early stage of disease progression and reduce mortality rates within the Chinese population.
2Patients and Methods2.1Study populationThe clinical data, including demographic data, etiological data, and laboratory test results, of patients with primary liver cirrhosis hospitalized at the Second Affiliated Hospital of Nanchang University between January 2012 and December 2018 were obtained. The study was in compliance with the Declaration of Helsinki (revised in 2013) and received approval from the ethics board of The Second Affiliated Hospital of Nanchang University (No. [2017] 029). All patients provided informed consent prior to participating in the study.
Serum AFP is a widely used and significant indicator for diagnosing liver cancer and monitoring treatment effectiveness. A serum AFP level ≥400 µg/L strongly indicates liver cancer, provided that pregnancy, chronic or active liver disease, gonad embryo-derived tumors, and digestive tract tumors have been ruled out (according to the 2022 Guidelines for the Diagnosis and Treatment of Primary Liver Cancer). As there is no specific criterion for a low-level AFP, this study defined AFP levels <400 µg/L as low-level AFP.
The inclusion criteria were patients with (1) HBV-related cirrhosis (the admission diagnosis met the diagnostic criteria of the Guidelines of Hepatitis B cirrhosis) and (2) who had complete and accurate personal information and clinical data[21]. The exclusion criteria were patients with (1) liver damage caused by hepatitis C virus (HCV) or other hepatitis virus infection, alcoholic liver disease, nonalcoholic fatty liver disease, autoimmune liver disease, drug-induced liver damage, genetic metabolic diseases, hepatic schistosomiasis, or other reasons; (2) other organ complications, such as gastrointestinal, lung, kidney, or other diagnosed malignant tumors, including metastatic liver cancer; and (3) AFP >400 ng/mL.
Following a comprehensive evaluation of the inclusion and exclusion criteria, we integrated data from a cohort comprising 6980 individuals diagnosed with HBV-related cirrhosis. Of these, 2276 patients (32.6 %) were assigned to the HCC group, as their discharge diagnosis indicated the presence of HBV-related HCC, meeting the diagnostic criteria for primary liver cancer as stipulated by the Medical Administration of the National Health and Family Planning Commission. The remaining 4704 patients were assigned to the non-HCC group, as they did not exhibit HBV-related HCC. The flowchart of the participants is illustrated in Fig. 1.
2.2Clinical and laboratory data
Demographic data included age, sex, alcohol, smoking, kidney disease, atrial fibrillation, pulmonary infection, coronary heart disease (CHD), diabetes mellitus, and hypertension. Laboratory test data included hepatitis Be antigen, hepatitis B core antibody, high blood pressure (HBP), hemoglobin (Hb), calcium (Ca2+), potassium (K+), indirect bilirubin, direct bilirubin (DB), TB, albumin/globulin (ALB/GLB) ratio, GLB, ALB, total protein, blood glucose, gamma-glutamyl transferase, ALP, aspartate aminotransferase, glutamic-pyruvic transaminase (GPT), HCV, carbohydrate antigen 199, carcino-embryonic antigen (CEA), AFP, prothrombin time, thrombin time, activated partial thromboplastin time, platelet count, monocyte count, lymphocyte count (LY), mean corpuscular hemoglobin, fibrinogen (Fbg), neutrophil count, leukocyte count, albumin-bilirubin, platelet to lymphocyte ratio, monocyte to lymphocyte ratio, and neutrophil to lymphocyte ratio. These were the clinical data of HBV-related cirrhosis patients at first admission.
2.3ML techniquesML, a statistics-based model, is used by computers to complete tasks without any specific instructions. The following describes the ML approach applied in this study.
Extreme gradient boosting (XGBoost) is an enhanced algorithm developed based on the gradient boosting decision tree (GDBT) algorithm [22]. While the traditional GDBT model uses only the first derivative in the optimization, XGBoost conducts the second-order Taylor expansion of the cost function and includes a regularization item into the cost function for better performance [23].
Logistic regression (LR) is a dichotomy model in ML [24]. LR is utilized to detail the relationship between the independent variable and the dependent variable The model can have one or several independent variables. Univariate LR pertains to a scenario with a single independent variable, while the term multivariate LR is used when there are multiple independent variables.
As a combined classifier algorithm based on the classification and regression tree decision tree, the random forest (RF) algorithm can construct multiple tree classification models [25]. Through voting with the decision tree in the RF algorithm, the sample category to be tested can be determined based on the principle that minorities are submissive to majorities, and the category with a higher number of votes in all trees is the final result. Adaptive boosting (AdaBoost) is a common boosting algorithm that uses “reweighting” in each round of the training process, whereby each training sample is given a new weight based on the sample distribution [26]. The significance of good individual learners is enhanced by lowering the classification error of individual learners each time, and the ultimate integrated learner is obtained [27].
Multilayer perceptron (MLP) is a neural network algorithm [28]. We set the nodes in the algorithm, and in the training model, the input features and prediction results are shown as the nodes, with coefficient w being used to connect the nodes. MLP learning is a process of adjusting the weight and training the model step by step to achieve the desired effect.
2.4Feature selection and statistical analysisRegarding baseline characteristics, the Student t-test or Mann–Whitney test was adopted to compare the quantitative data, while the Fisher exact test or the chi-squared test was used to compare the qualitative data. Use the Spearman coefficient to analyze the correlation between variables and remove variables with higher correlation (cutoffs>0.5). The most important risk factors affecting HCC development were screened using XGBoost, Gaussian naive Bayes (GNB), and least absolute shrinkage and selection operation (LASSO) regression. These models have their own advantages when it comes to feature selection. GNB assumes conditional independence between features and is suitable for cases where the relationships between features are relatively simple, allowing it to ignore irrelevant features during feature selection. XGBoost and RF are both nonlinear models that can identify nonlinear relationships and interactions between features, eliminating redundant features. On the other hand, LASSO regression has regularization properties and can handle multicollinearity issues. Therefore, using multiple different models, we aimed to determine the most suitable set of variables and improve the stability and interpretability of the final model. XGBoost, RF and GNB algorithms sort the importance scores of variables and save the top 20 important variables, respectively. The intersection of the screened features was selected in combination with the Wayne diagram. Moreover, we computed 95 % confidence intervals (CIs) and odds ratios (ORs) for each independent risk factor using univariate and multivariate logistic regression (LR) models. The receiver operating characteristic (ROC) curve was employed to assess the predictive ability of the multivariate LR models, and the Delong test was used to analyze differences in the area under the curve (AUC). All statistical analyses were conducted using R version 3.6.3 (The R Foundation for Statistical Computing) and Python version 3.7 (The Python Software Foundation)[29]. For all tests, a two-sided P-value <0.05 was considered statistically significant.
2.5Derivation and validation of the modelsIn this study, a conventional LR model and four popular ML classification algorithms—RF, XGBoost, AdaBoost, and MLP—were used to create classifier models. First, we randomly split the model data into two parts: 20 % for testing and 80 % for training. The training data set was used to select the optimal model. We utilized a blend of grid search and five-fold cross-validation to depict the AUC values of each respective model. The ML model with the best AUC value was chosen as the optimal model. The test data set was then used to evaluate the performance of the best model in an external and independent validation process. To assess the effectiveness of the models, we fully displayed and utilized standard coefficients, which included true positive (TP), true negative (TN), accuracy (Acc), sensitivity (Sen), specificity (Spec), F1 score, and the AUC ROC curve. These coefficients were employed as metrics to evaluate the performance of the models. All models were constructed using the Scikit-learn package (0.22.1) and the xgboost package (1.2.1) based on Python (3.7).
2.6Ethical statementThe authors are accountable for all aspects of the work and ensure that questions related to the accuracy or integrity of any part of the work are appropriately investigated and resolved. The study followed the Declaration of Helsinki (as revised in 2013). The study was approved by the ethics board of the Second Affiliated Hospital of Nanchang University (No. [2017] 029), and informed consent was obtained from all patients.
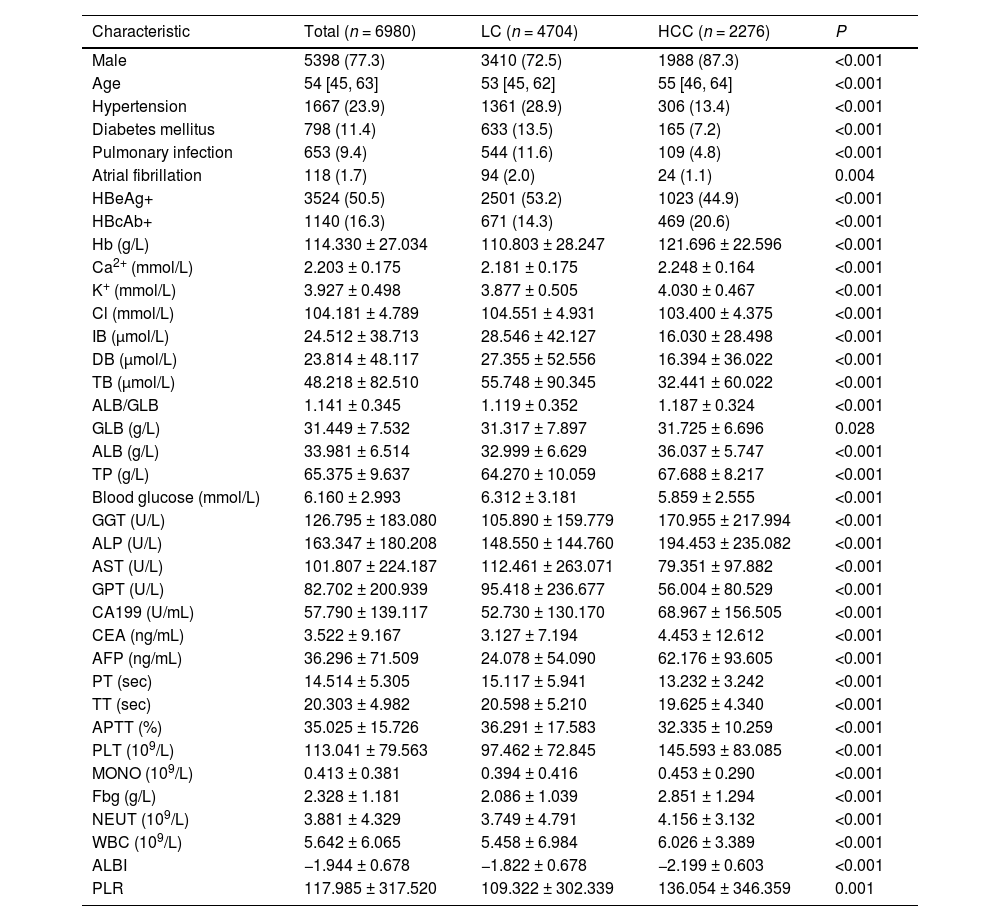
3Results3.1Baseline characteristicsOverall, 17,447 patients were included in the study; of these, we excluded 8483 HBV-negative patients and 1984 patients with high serum AFP levels (>400 ng/mL). Finally, 6980 patients were included for further analysis, of which 4704 had liver cirrhosis and 2276 had HCC. There were 3410 males (72.5 %) in the cirrhosis group, and the median age was 53 (interquartile range [IQR] 45–62) years, while there were 1988 males (87.3 %) in the liver cancer group, and the median age was 55 (IQR 46–64) years. Compared to patients with liver cirrhosis, those with HCC had a higher likelihood of being male (72.5% vs. 87.4 %; P < 0.01) and were two years older (median age 53 vs. 55; P < 0.01). As shown in Table 1, there were 38 baseline characteristics (P < 0.05), which were significantly different. Variables without significant differences among the baseline characteristics included CHD, smoking, and LY, among others.
Baseline characteristics of patients with HBV-related cirrhosis and HCC.
| Characteristic | Total (n = 6980) | LC (n = 4704) | HCC (n = 2276) | P |
|---|---|---|---|---|
| Male | 5398 (77.3) | 3410 (72.5) | 1988 (87.3) | <0.001 |
| Age | 54 [45, 63] | 53 [45, 62] | 55 [46, 64] | <0.001 |
| Hypertension | 1667 (23.9) | 1361 (28.9) | 306 (13.4) | <0.001 |
| Diabetes mellitus | 798 (11.4) | 633 (13.5) | 165 (7.2) | <0.001 |
| Pulmonary infection | 653 (9.4) | 544 (11.6) | 109 (4.8) | <0.001 |
| Atrial fibrillation | 118 (1.7) | 94 (2.0) | 24 (1.1) | 0.004 |
| HBeAg+ | 3524 (50.5) | 2501 (53.2) | 1023 (44.9) | <0.001 |
| HBcAb+ | 1140 (16.3) | 671 (14.3) | 469 (20.6) | <0.001 |
| Hb (g/L) | 114.330 ± 27.034 | 110.803 ± 28.247 | 121.696 ± 22.596 | <0.001 |
| Ca2+ (mmol/L) | 2.203 ± 0.175 | 2.181 ± 0.175 | 2.248 ± 0.164 | <0.001 |
| K+ (mmol/L) | 3.927 ± 0.498 | 3.877 ± 0.505 | 4.030 ± 0.467 | <0.001 |
| Cl (mmol/L) | 104.181 ± 4.789 | 104.551 ± 4.931 | 103.400 ± 4.375 | <0.001 |
| IB (μmol/L) | 24.512 ± 38.713 | 28.546 ± 42.127 | 16.030 ± 28.498 | <0.001 |
| DB (μmol/L) | 23.814 ± 48.117 | 27.355 ± 52.556 | 16.394 ± 36.022 | <0.001 |
| TB (μmol/L) | 48.218 ± 82.510 | 55.748 ± 90.345 | 32.441 ± 60.022 | <0.001 |
| ALB/GLB | 1.141 ± 0.345 | 1.119 ± 0.352 | 1.187 ± 0.324 | <0.001 |
| GLB (g/L) | 31.449 ± 7.532 | 31.317 ± 7.897 | 31.725 ± 6.696 | 0.028 |
| ALB (g/L) | 33.981 ± 6.514 | 32.999 ± 6.629 | 36.037 ± 5.747 | <0.001 |
| TP (g/L) | 65.375 ± 9.637 | 64.270 ± 10.059 | 67.688 ± 8.217 | <0.001 |
| Blood glucose (mmol/L) | 6.160 ± 2.993 | 6.312 ± 3.181 | 5.859 ± 2.555 | <0.001 |
| GGT (U/L) | 126.795 ± 183.080 | 105.890 ± 159.779 | 170.955 ± 217.994 | <0.001 |
| ALP (U/L) | 163.347 ± 180.208 | 148.550 ± 144.760 | 194.453 ± 235.082 | <0.001 |
| AST (U/L) | 101.807 ± 224.187 | 112.461 ± 263.071 | 79.351 ± 97.882 | <0.001 |
| GPT (U/L) | 82.702 ± 200.939 | 95.418 ± 236.677 | 56.004 ± 80.529 | <0.001 |
| CA199 (U/mL) | 57.790 ± 139.117 | 52.730 ± 130.170 | 68.967 ± 156.505 | <0.001 |
| CEA (ng/mL) | 3.522 ± 9.167 | 3.127 ± 7.194 | 4.453 ± 12.612 | <0.001 |
| AFP (ng/mL) | 36.296 ± 71.509 | 24.078 ± 54.090 | 62.176 ± 93.605 | <0.001 |
| PT (sec) | 14.514 ± 5.305 | 15.117 ± 5.941 | 13.232 ± 3.242 | <0.001 |
| TT (sec) | 20.303 ± 4.982 | 20.598 ± 5.210 | 19.625 ± 4.340 | <0.001 |
| APTT (%) | 35.025 ± 15.726 | 36.291 ± 17.583 | 32.335 ± 10.259 | <0.001 |
| PLT (109/L) | 113.041 ± 79.563 | 97.462 ± 72.845 | 145.593 ± 83.085 | <0.001 |
| MONO (109/L) | 0.413 ± 0.381 | 0.394 ± 0.416 | 0.453 ± 0.290 | <0.001 |
| Fbg (g/L) | 2.328 ± 1.181 | 2.086 ± 1.039 | 2.851 ± 1.294 | <0.001 |
| NEUT (109/L) | 3.881 ± 4.329 | 3.749 ± 4.791 | 4.156 ± 3.132 | <0.001 |
| WBC (109/L) | 5.642 ± 6.065 | 5.458 ± 6.984 | 6.026 ± 3.389 | <0.001 |
| ALBI | −1.944 ± 0.678 | −1.822 ± 0.678 | −2.199 ± 0.603 | <0.001 |
| PLR | 117.985 ± 317.520 | 109.322 ± 302.339 | 136.054 ± 346.359 | 0.001 |
Data were presented as mean ± standard deviation, median (interquartile range], or n (%). P < 0.05 denotes significant differences in clinicopathological features of patients in the training set vs. test set and the training set vs. the validation set.
Abbreviations: HBeAg, hepatitis Be antigen; HBcAb, hepatitis B core antibody; Hb, hemoglobin; Ca2+, calcium; K+, potassium; Cl, chlorine; IB, indirect bilirubin; DB, direct bilirubin; TB, total bilirubin; GLB, globulin; ALB, albumin; TP, total protein; GGT, gamma-glutamyl transferase; ALP, alkaline phosphatase; AST, aspartate aminotransferase; GPT, glutamic-pyruvic transaminase; CA199, carbohydrate antigen 199; CEA, carcinoembryonic antigen; PT, prothrombin time; AFP, alpha-fetoprotein; TT, thrombin time; APTT, activated partial thromboplastin time; PLT, platelet count; MONO, monocyte count; Fbg, fibrinogen; NEUT, neutrophil count; WBC, leukocyte count; ALBI, albumin-bilirubin; PPLR, platelet to lymphocyte ratio; LC, liver cirrhosis; HBV, hepatitis B virus; HCC, hepatocellular carcinoma.
To increase the model's usability and lower its error due to collinearity and correlation, the data variables were further screened. After filtering using collinearity and correlation analysis, 26 characteristics were used for the subsequent analysis (Fig. 2A). LASSO regression, XGBoost, RF, and GNB ML algorithms were used for further optimization (Fig. 2B and C). With a minimal criterion lambda of 0.058, it was demonstrated that excessive convergence would not happen when examining no >21 variables in detail (Fig. 2B). XGBoost, RF, and GNB ML algorithms screened 20 variables respectively (Fig. 2C). Finally, combined with the Wayne diagram (Fig. 2D), 12 variables (age, sex, hypertension, CEA, GPT, Fbg, ALP, Hb, Ca2+, K+, DB, and AFP) were screened for model construction.
 Pearson correlation analysis between all the variables. (B) LASSO identified 21 variables as predictive factors in all patients to construct the optimal model. (C) The variable importance plots for three ML algorithms (XGBoost, RF, and GNB; from left to right). (D) Venn diagram showing the 12 most critical variables shared by the 4 feature selection algorithms. XGBoost, extreme gradient boosting; RF, random forest; GNB, Gaussian naïve Bayes; LASSO, least absolute shrinkage and selection operation; ML, machine learning.")
Overview of the variables selected for model construction. (A) Pearson correlation analysis between all the variables. (B) LASSO identified 21 variables as predictive factors in all patients to construct the optimal model. (C) The variable importance plots for three ML algorithms (XGBoost, RF, and GNB; from left to right). (D) Venn diagram showing the 12 most critical variables shared by the 4 feature selection algorithms. XGBoost, extreme gradient boosting; RF, random forest; GNB, Gaussian naïve Bayes; LASSO, least absolute shrinkage and selection operation; ML, machine learning.
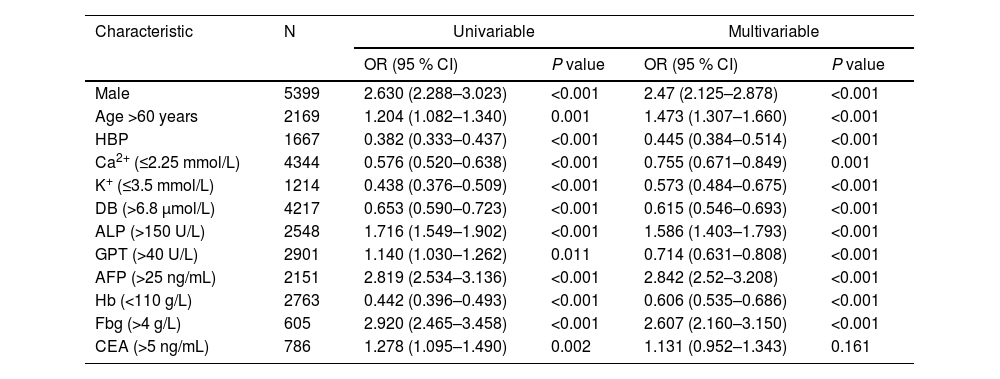
As reported in Table 2, the quantitative variables included in the model were transformed into grouping variables. The univariate analysis revealed that all the variables were statistically significant in the diagnosis of HBV-related liver cancer. All characteristics were included in the multivariate LR model, and the analysis revealed that male sex (OR 2.47; 95 % CI: 2.125–2.878; P < 0.001), age >60 years (OR 1.473; 95 % CI: 1.307–1.66; P < 0.001), ALP >150 U/L (OR 1.586; 95 % CI: 1.403–1.793; P < 0.001), AFP >25 ng/mL (OR 2.842; 95 % CI: 2.52–3.208; P < 0.001), and Fbg >4 g/L (OR 2.607; 95 % CI: 2.16–3.15; P < 0.001) were associated with a higher risk of HCC. However, Ca2+ ≤2.25 (OR 0.755; 95 % CI: 0.671–0.849; P < 0.001), K+ ≤3.5 mmol/L (OR 0.573; 95 % CI: 0.484–0.675; P < 0.001), DB >6.8 μmol/L (OR 0.615; 95 % CI: 0.546–0.693; P < 0.001), GPT >40 U/L (OR 0.714; 95 % CI: 0.631–0.808; P < 0.001), Hb <110 g/L (OR 0.606; 95 % CI: 0.535–0.686; P < 0.001), and hypertension (OR 0.445; 95 % CI, 0.384–0.514; P < 0.001) were associated with a lower risk of HCC. Next, the performance of the multivariate LR model was visualized using a nomogram (Fig. 3A). After conducting the Delong test (z = 12.096, P < 0.001), Our findings revealed that the multifactor LR model exhibited a significantly superior predictive effect compared to the single AFP model. The AUC of the prediction model was 0.746 (95 % CI: 0.734–0.758), with a 0.710 sensitivity and a 0.646 specificity. In contrast, the AUC of the AFP was 0.66 (95 % CI 0.645–0.672), with a 0.462 sensitivity and a 0.766 specificity. The calibration chart (Fig. 3B) demonstrated that both the real and ideal models were essentially consistent, suggesting the high accuracy of our model.
LR model analysis for risk of HCC.
| Characteristic | N | Univariable | Multivariable | ||
|---|---|---|---|---|---|
| OR (95 % CI) | P value | OR (95 % CI) | P value | ||
| Male | 5399 | 2.630 (2.288–3.023) | <0.001 | 2.47 (2.125–2.878) | <0.001 |
| Age >60 years | 2169 | 1.204 (1.082–1.340) | 0.001 | 1.473 (1.307–1.660) | <0.001 |
| HBP | 1667 | 0.382 (0.333–0.437) | <0.001 | 0.445 (0.384–0.514) | <0.001 |
| Ca2+ (≤2.25 mmol/L) | 4344 | 0.576 (0.520–0.638) | <0.001 | 0.755 (0.671–0.849) | 0.001 |
| K+ (≤3.5 mmol/L) | 1214 | 0.438 (0.376–0.509) | <0.001 | 0.573 (0.484–0.675) | <0.001 |
| DB (>6.8 μmol/L) | 4217 | 0.653 (0.590–0.723) | <0.001 | 0.615 (0.546–0.693) | <0.001 |
| ALP (>150 U/L) | 2548 | 1.716 (1.549–1.902) | <0.001 | 1.586 (1.403–1.793) | <0.001 |
| GPT (>40 U/L) | 2901 | 1.140 (1.030–1.262) | 0.011 | 0.714 (0.631–0.808) | <0.001 |
| AFP (>25 ng/mL) | 2151 | 2.819 (2.534–3.136) | <0.001 | 2.842 (2.52–3.208) | <0.001 |
| Hb (<110 g/L) | 2763 | 0.442 (0.396–0.493) | <0.001 | 0.606 (0.535–0.686) | <0.001 |
| Fbg (>4 g/L) | 605 | 2.920 (2.465–3.458) | <0.001 | 2.607 (2.160–3.150) | <0.001 |
| CEA (>5 ng/mL) | 786 | 1.278 (1.095–1.490) | 0.002 | 1.131 (0.952–1.343) | 0.161 |
LR, logistic regression; HCC, hepatocellular carcinoma; OR, odds ratio; CI, confidence interval; HBP, high blood pressure; Ca2+, calcium; K+, potassium; DB, direct bilirubin; ALP, alkaline phosphatase; GPT, glutamic-pyruvic transaminase; AFP, alpha-fetoprotein; Hb, hemoglobin; Fbg, fibrinogen; CEA, carcinoembryonic antigen.
 The nomogram of the LR model using the 12 significant variables. (B) Calibration curve of the logistic regression model shows that the actual model and the ideal model are practically identical, proving the high accuracy of the proposed model. Ca2+, calcium; K+, potassium; DB, direct bilirubin; ALP, alkaline phosphatase; GPT, glutamic-pyruvic transaminase; AFP, alpha-fetoprotein; HBP, high blood pressure; HB, hemoglobin; Fbg, fibrinogen; CEA, carcinoembryonic antigen; LR, logistic regression; HCC, hepatocellular carcinoma.")
Construction and clinical value evaluation of the diagnosis model for HCC. (A) The nomogram of the LR model using the 12 significant variables. (B) Calibration curve of the logistic regression model shows that the actual model and the ideal model are practically identical, proving the high accuracy of the proposed model. Ca2+, calcium; K+, potassium; DB, direct bilirubin; ALP, alkaline phosphatase; GPT, glutamic-pyruvic transaminase; AFP, alpha-fetoprotein; HBP, high blood pressure; HB, hemoglobin; Fbg, fibrinogen; CEA, carcinoembryonic antigen; LR, logistic regression; HCC, hepatocellular carcinoma.
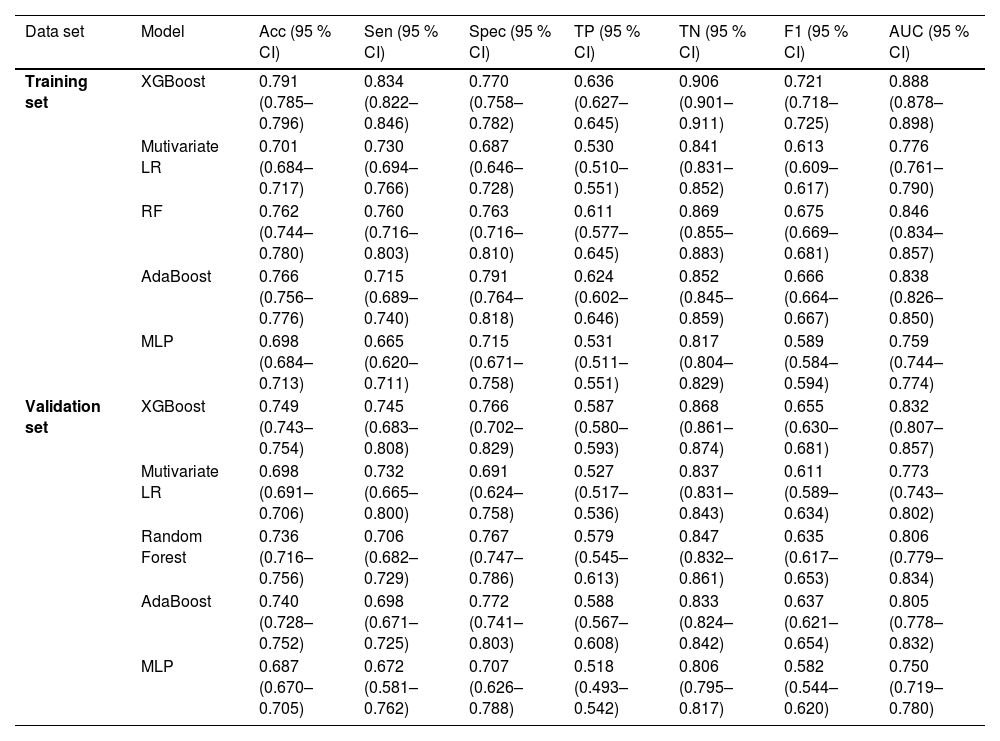
The above analysis showed that age, sex, hypertension, CEA, GPT, Fbg, ALP, Hb, Ca2+, K+, DB, and AFP were significantly related to HCC. Therefore, these 12 variables were used as independent factors to build the HCC risk predictive models based on ML algorithms—RF, XGBoost, AdaBoost, and multilayer neural networks. To avoid overfitting and select the optimal model, random sampling at a ratio of 8:2 was used for the training and test sets, and a 5-fold cross-validation was performed on the training set, after which the average of Acc, Sen, Spec, TP, TN, and F1 score was obtained from the five predictions.
For the validation test set, the Acc, Sec, Spec, TP, TN, F1 score, and AUC (95 % CI) of the XGBoost model were 0.749, 0.745, 0.766, 0.587, 0.868, 0.655, and 0.832 (0.807–0.857), respectively, which were better than the corresponding LR model values of 0.698, 0.732, 0.691, 0.527, 0.837, 0.611, and 0.773 (0.743–0.802), respectively, including those of the other ML models. Table 3 displays the performance of each model within the training and validation sets, and the comparison of ROC curves of the five proposed models in both sets is displayed in Fig. 4A and B.
Performance of the training set and validation set.
| Data set | Model | Acc (95 % CI) | Sen (95 % CI) | Spec (95 % CI) | TP (95 % CI) | TN (95 % CI) | F1 (95 % CI) | AUC (95 % CI) |
|---|---|---|---|---|---|---|---|---|
| Training set | XGBoost | 0.791 (0.785–0.796) | 0.834 (0.822–0.846) | 0.770 (0.758–0.782) | 0.636 (0.627–0.645) | 0.906 (0.901–0.911) | 0.721 (0.718–0.725) | 0.888 (0.878–0.898) |
| Mutivariate LR | 0.701 (0.684–0.717) | 0.730 (0.694–0.766) | 0.687 (0.646–0.728) | 0.530 (0.510–0.551) | 0.841 (0.831–0.852) | 0.613 (0.609–0.617) | 0.776 (0.761–0.790) | |
| RF | 0.762 (0.744–0.780) | 0.760 (0.716–0.803) | 0.763 (0.716–0.810) | 0.611 (0.577–0.645) | 0.869 (0.855–0.883) | 0.675 (0.669–0.681) | 0.846 (0.834–0.857) | |
| AdaBoost | 0.766 (0.756–0.776) | 0.715 (0.689–0.740) | 0.791 (0.764–0.818) | 0.624 (0.602–0.646) | 0.852 (0.845–0.859) | 0.666 (0.664–0.667) | 0.838 (0.826–0.850) | |
| MLP | 0.698 (0.684–0.713) | 0.665 (0.620–0.711) | 0.715 (0.671–0.758) | 0.531 (0.511–0.551) | 0.817 (0.804–0.829) | 0.589 (0.584–0.594) | 0.759 (0.744–0.774) | |
| Validation set | XGBoost | 0.749 (0.743–0.754) | 0.745 (0.683–0.808) | 0.766 (0.702–0.829) | 0.587 (0.580–0.593) | 0.868 (0.861–0.874) | 0.655 (0.630–0.681) | 0.832 (0.807–0.857) |
| Mutivariate LR | 0.698 (0.691–0.706) | 0.732 (0.665–0.800) | 0.691 (0.624–0.758) | 0.527 (0.517–0.536) | 0.837 (0.831–0.843) | 0.611 (0.589–0.634) | 0.773 (0.743–0.802) | |
| Random Forest | 0.736 (0.716–0.756) | 0.706 (0.682–0.729) | 0.767 (0.747–0.786) | 0.579 (0.545–0.613) | 0.847 (0.832–0.861) | 0.635 (0.617–0.653) | 0.806 (0.779–0.834) | |
| AdaBoost | 0.740 (0.728–0.752) | 0.698 (0.671–0.725) | 0.772 (0.741–0.803) | 0.588 (0.567–0.608) | 0.833 (0.824–0.842) | 0.637 (0.621–0.654) | 0.805 (0.778–0.832) | |
| MLP | 0.687 (0.670–0.705) | 0.672 (0.581–0.762) | 0.707 (0.626–0.788) | 0.518 (0.493–0.542) | 0.806 (0.795–0.817) | 0.582 (0.544–0.620) | 0.750 (0.719–0.780) |
CI, confidence interval; XGBoost, extreme gradient boosting; LR, logistic regression; RF, random forest; MLP, multilayer perceptron; AdaBoost, adaptive boosting; Acc, accuracy; Sen, sensitivity; Spec, specificity; ROC receiver operating characteristic; AUC, area under the curve.
 Comparison of the ROC curves of the five proposed models in the (A) training and (B) validation sets, which shows the superiority of the proposed model compared to the existing ones. (C) Calibration curve of the XGBoost model shows good performance in the test set. (D) Calibration plots and SHAP value of the XGBoost model in the test set show the most important factors for prediction. XGBoost, extreme gradient boosting; MLP, multilayer perceptron; HBP, high blood pressure; AdaBoost, adaptive boosting; ROC, receiver operating characteristics; AUC, area under the curve; Ca2+, calcium; K+, potassium; DB, direct bilirubin; ALP, alkaline phosphatase; GPT, glutamic-pyruvic transaminase; AFP, alpha-fetoprotein; HB, hemoglobin; Fbg, fibrinogen; CEA, carcinoembryonic antigen; SHAP, Shapley additive explanations.")
ROC curves of the five proposed models and XGBoost model performance. (A-B) Comparison of the ROC curves of the five proposed models in the (A) training and (B) validation sets, which shows the superiority of the proposed model compared to the existing ones. (C) Calibration curve of the XGBoost model shows good performance in the test set. (D) Calibration plots and SHAP value of the XGBoost model in the test set show the most important factors for prediction. XGBoost, extreme gradient boosting; MLP, multilayer perceptron; HBP, high blood pressure; AdaBoost, adaptive boosting; ROC, receiver operating characteristics; AUC, area under the curve; Ca2+, calcium; K+, potassium; DB, direct bilirubin; ALP, alkaline phosphatase; GPT, glutamic-pyruvic transaminase; AFP, alpha-fetoprotein; HB, hemoglobin; Fbg, fibrinogen; CEA, carcinoembryonic antigen; SHAP, Shapley additive explanations.
The calibration curve of the XGBoost model aligns well with the diagonal, signifying strong performance in the test set (Fig. 4C). The contribution of each feature (for example, Fbg, AFP, ALP, HBP, and sex) to the model output was determined using the Shapley additive explanations (SHAP) value, allowing us to pinpoint the factors of greatest relevance for prediction (Fig. 4D). According to the results above, we applied the XGBoost model as the final classification model in the test set, with an Acc, Sen, Spec, TP, TN, F1 score, and AUC (95 % CI) of 0.746, 0.766, 0.737, 0.588, 0.864, 0.665, and 0.829 (0.805–0.852), respectively. The confusion matrix of the prediction results in the test set is shown in Table 4. We conducted external validation using samples from the Second Affiliated Hospital of Nanchang University, spanning from 2017 to 2022, with a total of 2915 samples collected. In the external validation, the model's AUC value (95 % confidence interval) was 0.769 (0.744–0.793) (Fig. 5A), the Brier score in the calibration curve (95 % confidence interval) was 0.124 (0.117–0.131) (Fig. 5B), and DCA curve of the model's also showed good predictive performance (Fig. 5C). The model's accuracy, sensitivity, and specificity were 0.728, 0.542, and 0.841, respectively (Table 5). The confusion matrix of the prediction results in the external validation set is shown in Fig. 5D.
 ROC curves of the XGBoost model in external validation data. (B) Calibration curve of the XGBoost model shows good performance in the external validation data. (C) DCA curve of the XGBoost model shows good performance in the external validation data. (D) Confusion matrix of the prediction results in the external validation data.")
External validation data analysis results. (A) ROC curves of the XGBoost model in external validation data. (B) Calibration curve of the XGBoost model shows good performance in the external validation data. (C) DCA curve of the XGBoost model shows good performance in the external validation data. (D) Confusion matrix of the prediction results in the external validation data.
Performance of the external validation set.
| AUC (95 % CI) | cutoff | Acc | Sen | Spec | PPV | NPV | F1 | Kappa |
|---|---|---|---|---|---|---|---|---|
| 0.769(0.744–0.793) | 0.318 | 0.728 | 0.542 | 0.841 | 0.298 | 0.92 | 0.385 | 0.255 |
AUC, area under the curve; Acc, accuracy; Sen, sensitivity; Spec, specificity; PPV, Positive predictive value; NPV, Negative predictive value.
The most effective model in this study was developed into a publicly accessible, user-friendly web-based tool (https://www.xsmartanalysis.com/model/HCC/). The tool allows users to predict the likelihood of HCC by inputting relevant patient characteristics. For instance, when evaluating a 55-year-old male patient with the following values: Hb 59 g/L, ALP 169.3 U/L, Fbg 1.55 g/L, DB 21.3 umol/L, AFP 3.1 ng/mL, K 3.6 mmol/L, CEA 2.48 ng/mL, Ca 2.01 mmol/L, and GPT 42.67 U/L, the XGBoost model estimates an HCC probability of 11.64 %, which is below the HCC occurrence threshold. In the same patient, subsequent radiomics and pathological examination further confirmed the absence of HCC. Conversely, a 58-year-old male patient with HBV cirrhosis presented to the hospital with the following clinical indicators: HB 125 g/L, ALP 139.64 U/L, Fbg 2.08 g/L, DB 9.62 umol/L, AFP 14.7 ng/mL, K 3.84 mmol/L, CEA 1.83 ng/mL, Ca 2.23 mmol/L, GPT 116.77 U/L, and without hypertension. This patient exhibited an HCC-predicted probability of 51.2.9 % according to the XGBoost model, surpassing the HCC occurrence threshold (31.825 %) displayed in Fig. 6A. Post pathological examination, this patient was confirmed to have HCC (Fig. 6B and C). These cases demonstrated the model's ability to assist clinicians in the risk assessment of patients with HBV cirrhosis who have low-level AFP, enabling doctors to better understand the risk of liver cancer in patients and provide appropriate diagnosis and early treatment.
 Twelve relevant clinical indicators and model prediction results for a patient admitted with a diagnosis of HBV-related liver cirrhosis.(B) HE staining X400: Tumor cells exhibit a thick cord-like or pseudoglandular arrangement, with some cell nuclei deeply stained. Clear nuclear enlargement is observed, and some cell nuclei appear vacuolated. Clear nucleoli are visible, along with evidence of abnormal nuclear division. (C) IHC GPC-3 × 100 (+): Obvious brown granular reaction in the cytoplasm and membrane.")
Web-based predictive model for risk evaluation of HCC in HBV-related cirrhosis patients with low AFP levels and two pathology images of diagnosed liver cancer patients. (A) Twelve relevant clinical indicators and model prediction results for a patient admitted with a diagnosis of HBV-related liver cirrhosis.(B) HE staining X400: Tumor cells exhibit a thick cord-like or pseudoglandular arrangement, with some cell nuclei deeply stained. Clear nuclear enlargement is observed, and some cell nuclei appear vacuolated. Clear nucleoli are visible, along with evidence of abnormal nuclear division. (C) IHC GPC-3 × 100 (+): Obvious brown granular reaction in the cytoplasm and membrane.
AFP concentration is a powerful predictive biomarker of primary liver cancer; however, its use in diagnosing small tumors is limited owing to high rates of false-positive diagnosis. In their updated diagnosis and treatment guidelines, the European Society for Liver Research and the American Society for Liver Research no longer consider AFP as the screening and diagnosis standard of liver cancer due to its low sensitivity and specificity, particularly in cirrhotic individuals [30–32]. Therefore, attempts have been made to effectively predict HCC with low-level AFP. However, a unified standard has not yet been set, and there are certain differences across regions and hospitals. Hence, we aim to establish a diagnostic model based on conventional test indicators to improve the diagnostic efficiency of HCC with low-level AFP while also taking into account the economic interests of patients.
In this study, we aimed to develop an ML-based algorithm to diagnose HCC in HBV-related cirrhosis patients with low-level AFP. Several laboratory routine test indicators and tumor markers in patients with HBV-related liver cancer and cirrhosis were obtained. Data mining and comprehensive ML methods were used to screen variables statistically significant for HBV-related low-grade AFP primary liver cancer. The most important variables, consistent with those commonly seen in clinical practice, were age, sex, AFP, ALP, Fbg, and ALT, among others. Meanwhile, other commonly assessed but less used variables, including serum Ca2+, K+, Hb, and HBP, were also included as protective factors. Age and sex differences in liver cancer incidence are strongly supported by the current literature [33]. In this study, there were 1988 male patients with HBV-related liver cancer, accounting for 87.385 %, and the highest rate of HBV-related liver cancer was observed among those aged ≥60 years, accounting for 31.1 %. This supports the conclusion that age is a significant variable in the diagnosis model of liver cancer. However, the levels of Hb in the HCC group were found to be higher than those in the non-HCC group, serving as an independent risk factor for primary liver cancer, which differs from previous literature reports [34]. The higher Hb levels in the liver cancer group may be attributed to a state of well-oxygenated tissues relative to normal tissues. Most solid tumors harbor a considerable portion of cells in hypoxic conditions, leading to increased secretion of erythropoietin, resulting in elevated initial Hb levels. However, as the tumor progresses, enhanced host catabolism and decreased synthesis metabolism often lead to significant anemia in late-stage cancer patients. The levels of DB in the liver cancer group were significantly higher than those in the non-liver cancer group, partly due to hepatocellular damage and partly due to biliary obstruction caused by tumor compression or invasion of bile ducts near the porta hepatis. However, the sensitivity and specificity of diagnosing primary liver cancer complicating HBV-related cirrhosis are suboptimal, limiting the value of isolated testing. The proportion of hypertension and GP transaminase levels were higher in the non-HCC group compared to the HCC group, which differs from some literature reports [35]. This difference may be attributed to the potential presence of cirrhosis in both groups. The liver is a key hub for hormone metabolism, and the development of cirrhosis can lead to decreased liver function, thereby disrupting the body's ability to regulate blood pressure, which may lead to an increase in the prevalence of hypertension. In addition, some reports pointed out that statins can effectively reduce the risk of liver cancer. After analyzing data from nearly 1.8 million people in three European and American groups, Carolin Victoria Schneider and others from the Aachen University Hospital in Germany found that among the general population, regular use of statins can reduce the risk of new liver disease by 28 % and the risk of liver cancer by 74 % compared to those who do not use statins [1]. Meanwhile, in some large sample studies and meta-analyses, hypertension and GP transaminase were not included as risk factors for liver cancer [2\3\4]. In addition, we excluded liver cancer patients with AFP greater than 400 from the initial patient enrollment, which may also contribute to this difference. We hope to expand the follow-up scope to include non-hospitalized patients and increase the comparison with a group of patients without cirrhosis in the future in order to better illustrate the differences between groups and reduce bias in subsequent studies.
The increased serum ALP in liver cancer may be due to the dissolution of accumulated bile acid-induced membrane disruption. Liver cancer can also physically compress the bile duct, thereby obstructing bile secretion[36]. Fbg has also been proven to be a regulatory factor necessary to induce the proliferation and development of cancer cells. A study suggested that evaluating the components of coagulation and fibrinolysis in plasma could help predict tumor development, monitor tumor progression, and evaluate prognosis [37]. Our model showed promising potential in effectively predicting the development of HCC using clinical and laboratory data from HBV-related cirrhosis diagnosis, which was easily obtained in regular clinical practice.
Computer-based diagnosis and prognostic prediction using deep learning systems and ML algorithms are widely used as they can provide more individualized predictions. In this study, 1340 participants were enrolled, and three ML models (XGBoost, RF, and LR) were used to construct the diagnostic models [38]. In the training cohort, the LR algorithm showed the best diagnostic performance for diagnosing HCC (AUC 0.842; 95 % CI: 0.784–0.899), as well as in the independent validation (AUC 0.860; 95 % CI: 0.824–0.897) [38]. In addition, we used the XGBoost model to predict liver cancer in patients with HBV-related cirrhosis and low-level AFP, which demonstrated good prediction efficacy, using only noninvasive laboratory data, with an AUC of 0.829 (95 % CI: 0.804–0.852) in the test set and 0.832 (95 % CI: 0.807–0.857) in the validation set. Our model showed a satisfactory calibration curve and excellent agreement between the predicted and observed probability in the external test set, which was comparable with other HCC risk prediction models. Prior attempts to increase the accuracy of HCC prognostic and diagnostic prediction have mostly relied on tissue-based, genomics, or imaging-assisted quantification of research biomarkers [38–42]. However, a more accurate yet complex prognosis and diagnosis model does not always represent a superior clinical tool. Simplicity and interpretability are more effective for promoting and applying a model. Equally important, our study determined the SHAP value (impact on model output) of each factor in the XGBoost model, thus rendering our model more practical and reliable in clinical diagnosis and treatment Fig. 6.
One of the strengths of our study was its ability to include a comprehensive set of clinical data and a large sample size. With the inclusion of multimodel variable screening and training of the XGBoost algorithm, the model prediction ability for HBV-related HCC was significantly improved. The model could better solve the problem of low diagnostic accuracy caused by single blood serum characteristics and multiple other confounding characteristics to reduce the false-negative rate. In addition, the model was adapted into a web-based tool (https://www.xsmartanalysis.com/model/HCC/), which might be helpful for the early detection of primary liver cancer in patients with low-level AFP and chronic HBV-related cirrhosis.
4.1LimitationHowever, it is important to acknowledge the limitations of this study. Firstly, it is crucial to note that this study was conducted retrospectively in a single-center setting, thereby introducing the possibility of selection bias. Therefore, future studies with multicenter data and larger sample sizes are warranted to develop more stable models. Second, this was a cross-sectional study, and it did not include prognostic variables. Third, this study only examined a single type of primary liver cancer, although it did cover certain uncommon subtypes, such as mixed liver cancer and intrahepatic cholangiocarcinoma). AFP expression is closely related to HCC, which is not only an important diagnostic factor but also an important prognostic factor in HCC [43]. Fourth, some potential clinical risk indicators, such as abnormal prothrombin, were not included in the study. This is because only a relatively small proportion of patients in the Second Affiliated Hospital of Nanchang University underwent this laboratory test. However, in the follow-up study, we aim to include more laboratory test indicators and other multimodal indicators. Further studies should also identify the prognostic risk factors and incorporate prognostic and other outcomes of HCC to maximize the universality and therapeutic utility of the models [44–51]. Fifth, this study aims to provide rapid prediction of liver cancer diagnosis for HBV cirrhosis patients awaiting admission or recently admitted to assist clinicians in timely diagnostic hints. However, some HBV patients with less obvious symptoms or other reasons for not being admitted were not included. Additionally, we did not investigate the motives for admission or conduct separate analyses for patients admitted for other reasons, potentially leading to biased results. We will conduct a follow-up to broaden the scope of the study sample and classify the reasons for admission. Patients admitted for other reasons should be analyzed and discussed separately.
5ConclusionsIn this study, the significant risk factors of patients with HBV-related cirrhosis for HCC were identified using statistical models. Using statistical tools, we developed an XGBoost model that outperformed the traditional LR models in assessing the risk of HCC in patients with HBV-related cirrhosis, with an AUC of 0.829 (95 % CI: 0.804–0.852) in the test set and 0.832 (95 % CI: 0.807–0.857) in the validation set. We also developed a web-based tool that could help clinicians estimate HCC status and provide guidance to optimize personalized treatment, thereby improving individualized treatment for each patient by integrating genetic information and radiomics data.
Author contributionsConception and design: B. Zhang; Administrative support: H. Hu and F. Zhou; Provision of study materials or patients: X.L. Yang; Data collection and assembly: Y. Xu; Data analysis and interpretation: X. Ouyang and Y.P. Yi; Manuscript writing: All authors; Final approval of manuscript: All authors.
FundingThis work was supported by grants from the Key R&D Program of Jiangxi Province (Nos. 20202BBEL53005, 20202BBGL73040, 20202BBGL73074), Jiangxi Provincial Health Commission Scientific and Technological Plan Project (No.202210494), Program of the Second Affiliated Hospital of Nanchang University (2023efyB02), the Applied Research and Cultivation program of Jiangxi Provincial Department of Science and Technology (Grant No. 20212BAG70012) and the 03-Special Project of Jiangxi Science and Technology Department (No. 20212ABC03A37).
Availability of data and materialsAll data generated or analyzed during this study are included in this published article.
We acknowledge the Extreme Smart Analysis platform (https://www.xsmartanalysis.com/) for assistance in analysis.
Xu et al. Models for HCC patients with low AFP level.


