


Non-invasive tests (NITs) identifying high-risk MASLD in primary care is suggested but, these strategies cost-effectiveness remain uncertain in the United Kingdom (UK).
Materials and MethodsA cost-utility/budget impact model was developed for cost-effectiveness evaluation of two screening strategies (1) FIB-4 followed by Enhanced Liver Fibrosis (ELF) (FIB-4/ELF); (2) FIB-4 followed by Transient Elastography (FIB-4/TE) compared to standard of care (SoC). A cohort of primary care MASLD patients with an advanced fibrosis prevalence of 4.20 % was simulated. A decision tree classified patients as true positives, false positives, true negatives, or false negatives based on NIT diagnostic accuracy, followed by a 3-year Markov model to estimate costs and quality-adjusted life years (QALYs). The model included 11 health states: MASLD, fibrosis stages (F0–F3), cirrhosis, decompensated cirrhosis, liver transplant, and death. Costs came from the National Tariff, National Schedule of Costs and Personal Social Services Research Unit.
ResultsSoC had a false diagnosis rate of 36.26 %, while FIB-4 with ELF or TE reduced false positive rates to 23.20 % and 20.91 %, respectively. Compared to 112,807 unnecessary hepatology referrals under SoC, FIB-4/ELF or FIB-4/TE reduced unnecessary referrals by 38,031 (33.71 %) and 45,767 (40.57 %), respectively. Both strategies demonstrated cost-effectiveness relative to SoC with total cost per patient of GBP 983.37 for FIB-4/TE, GBP 993.15 for FIB-4/ELF compared to SoC, GBP 1,014.15.
ConclusionsSequential NIT screening strategies, combining FIB-4 with ELF or TE, are cost-saving, reduce unnecessary hepatology referrals, and offer an efficient (improve outcomes and reduce healthcare costs) approach for managing high-risk MASLD in UK primary care.
Liver disease is the second leading cause of working life years lost in Europe, with significant health and economic impacts [1]. Cirrhosis and hepatocellular carcinoma (HCC) contribute substantially to this burden, particularly in men, with 70 % of end-stage liver disease (ESLD) cases first diagnosed during emergency visits and 30 % resulting in death [2,3].
Nonalcoholic fatty liver disease (NAFLD), now redefined as metabolic dysfunction-associated steatotic liver disease (MASLD), represents a growing global health challenge [4–9]. Its high prevalence, asymptomatic progression, and potential to advance to advanced fibrosis or cirrhosis that make it critical to identify individuals who at risk for adverse outcomes early, especially in the primary care settings where many of these individuals are managed. However, awareness of MASLD in the primary care remains relatively low, contributing to underdiagnosis and delayed intervention [10,11].
These strategies for “risk-stratification” using non-invasive tests (NITs) have been universally recommended by recent guidelines from the American Association for the Study of Liver Diseases (AASLD), the European Association for the Study of the Liver (EASL), the American Association for Clinical Endocrinology (AACE) and America Diabetes Association [12–15] These strategies recommend fibrosis-4 index (FIB-4) as a simple and inexpensive first-line assessment in the primary care setting [16,17]. With its good negative predictive value, FIB-4 effectively excludes advanced fibrosis or cirrhosis, allowing primary care providers to manage low-risk individuals without specialist referral [4]. For individuals with a non-low FIB-4 score (≥1.30), second-line NITs such as vibration-controlled elastography (VCTE) or the Enhanced Liver Fibrosis (ELF) test have been suggested. Both approaches have been shown to be cost-effective in the United States, but the availability and costs of the tests vary across different countries [18]. While MASLD risk-stratification algorithms have been evaluated in the United States, their cost-effectiveness in the United Kingdom (UK) remains unclear [19]. The current UK standard of care (SoC) includes physical assessments, liver function tests, evaluations for viral, immune, and metabolic liver diseases, and ultrasound imaging. The SoC approach for management of MASLD can lead to unnecessary referrals for patients with mild disease, increasing the burden on specialists as well as costs that can strain healthcare resources [20]. This study aims to assess the cost-utility of various risk stratification strategies for MASLD and compare these strategies to the current SoC for identifying high-risk patients in UK primary care settings.
2Materials and Methods2.1Overall study designA combined cost-utility and budget impact model was developed to evaluate screening strategies for identifying high-risk MASLD patients in UK primary care settings. The model integrates a decision tree and a Markov model to provide a comprehensive analysis (Fig. 1).

A hypothetical cohort of MASLD patients presenting in a primary care setting was simulated. The decision tree classifies patients as true positives (TP), false positives (FP), true negatives (TN), or false negatives (FN) based on the diagnostic accuracy of non-invasive tests (NITs). Sensitivity and specificity estimate for these NITs were derived from literature (S Table 1).
Following the decision tree analysis, a series of Markov models projected disease progression over a 3-year horizon for each TP, FP, TN, and FN classification. The Markov model incorporated eleven health states based on METAVIR fibrosis staging for MASLD patients: MASLD and Metabolic dysfunction-associated steatohepatitis (MASH) and with no fibrosis (F0), fibrosis stages 1 (F1), 2 (F2), 3 (F3), compensated cirrhosis (CC), decompensated cirrhosis (DCC), hepatocellular carcinoma (HCC), first-year post-liver transplantation (1yPLT), post-liver transplantation after 1 year (PLT), and death (absorbing health state) (Fig. 1). Fibrosis regression was permitted from F1 to F0; F2 to F1 and F0; F3 to F2, F1, and F0; and CC to F3. Patients undergoing liver transplantation entered a tunnel state for their first-year post-transplant (1yPLT).
These models estimated long-term direct medical care costs, including staging, diagnosis, and long-term care costs, with utilities reflecting the distribution of health states over the projected period for each strategy.
2.2Screening strategiesTwo screening strategies for identifying high-risk MASLD were evaluated and compared to the current standard of care (SoC) to identify patients at high risk of advanced fibrosis (Fig. 2). The goal of each strategy was to stratify patients into low-risk or high-risk groups, with low-risk individuals managed in primary care and high-risk individuals referred to a specialist. The evaluated strategies included:
1. FIB-4 Followed by Enhanced Liver Fibrosis (ELF) Test (FIB-4/ELF):
○ Low-risk: FIB-4 < 1.30, managed in primary care.
○ Intermediate-risk: FIB-4 scores between 1.30 and 2.67 were further evaluated using the ELF test. ELF score ≥ 9.8 was referred to a specialist.
○ High-risk: Patients with FIB-4 ≥ 2.67, referred to a specialist.
2. FIB-4 Followed by Transient Elastography (TE) (FIB-4/TE):
○ Low-risk: FIB-4 < 1.30, managed in primary care.
○ Intermediate-risk: FIB-4 scores between 1.30 and 2.67 were further evaluated using TE. TE liver stiffness measurements ≥ 8.0 kPa were referred to a specialist.
○ High-risk: Patients with FIB-4 ≥ 2.67 referred to a specialist.
 Standard of care, (B) FIB-4 Followed by ELF, and (C) FIB-4 Followed by TE.")
The standard ary care physician, three routine blood tests, and one ultrasound scan to stratify patients into low- and high-risk groups for advanced fibrosis.
2.3Modeled patient populationsA cohort of MASLD patients with fibrosis stages ranging from F0 to F4, typically observed in UK primary care, was modeled. In the absence of direct data on the distribution of fibrosis stages in the UK, estimates were derived using a modeled distribution of health states from Estes et al. [21] This distribution was informed by UK surveillance data and national estimates of obesity and diabetes prevalence and is considered representative of the broader MASLD population. The resulting distribution of fibrosis stages was as follows: F0: 85.29 %, F1: 6.62 %, F2: 3.89 %, F3: 2.52 %, cirrhosis (CC): 1.68 %, yielding a prevalence of advanced fibrosis (F3–CC) of 4.20 %. A hypothetical cohort of MASLD patients was constructed based on this distribution and used as the basis for the economic evaluation.
2.4Decision tree modelThe decision tree model classified patients according to the sensitivity and specificity of each non-invasive test (NIT) for the three screening strategies (S Table 1). The model categorizes patients into four groups: true positives (TP), false positives (FP), true negatives (TN), and false negatives (FN), based on the diagnostic accuracy of the screening tests. Patients identified as TN or FP, representing those without advanced fibrosis, were assumed to have a similar distribution across fibrosis stages F0–F2. Conversely, patients classified as FN or TP, representing those with advanced fibrosis, were distributed between fibrosis stage F3 and CC.
2.5Markov modelTransition probabilities for the progression and regression of MASLD were derived by averaging estimates from multiple published sources, with additional data from the Global NASH/MASH Registry [6,22–25] Adjustments were made for the UK population by incorporating relative risks for type 2 diabetes (T2D) and obesity, reflecting their prevalence in the UK [26,27] (S Table 2). Progression rates were calibrated to align with the incident cases of DCC, HCC, and liver transplantation (LT) in the UK, as reported by the Global Burden of Disease (GBD) and liver transplantation data from the Global Observatory on Donation and Transplantation (GODT) [28,29]. Calibration involved applying progression rates to the prevalent cases in the UK, ensuring consistency between modeled estimates and observed epidemiological trends.
For the true positive diagnosis group, treatment effects of pioglitazone were modelled as follows: progression rates from F1, F2, or F3 to F3, cirrhosis (CC), or HCC were reduced by a relative risk of 0.80, while regression rates from F2 or F3 to F1 or F0 were increased by a relative risk of 1.25 [30].
Estimating mortality rates for MASLD in the UK posed challenges due to limited data from general population cohorts; most available mortality data were derived from biopsied cohorts which most likely overestimate these rates. To address this limitation, general population annual mortality rates from the GBD (1.29 % for the US and 1.27 % for the UK in 2020) and MASLD-specific mortality data from nationally representative population (1.76 %) were used [26,31]. Based on these, we estimated a UK-specific MASLD mortality rate of 1.73 %, assuming a similar relative difference in mortality between MASLD patients and the general population in both countries. While this approach introduces some uncertainty due to the absence of UK-specific MASLD mortality data, it provides a reasonable estimate given the available evidence.
The model was run over a 3-year time horizon, consistent with the NICE Guidelines [38–41], which recommend retesting for advanced liver fibrosis in MASLD patients with negative ELF test results within this timeframe. Limiting the extrapolation period to 3 years avoided the need for assumptions about the sensitivity and specificity of non-invasive tests when retesting patients previously misclassified as false positives or false negatives for advanced fibrosis.
2.6Resource utilization and costsCosts for each screening strategy were categorized into diagnostic, staging, and long-term care expenses. Diagnostic costs were based on unit costs for resources used in the diagnostic pathway, including blood test, FIB-4, ELF, Fibroscan. Staging costs were derived from resource utilization in the first year after diagnosis.
For patients with negative diagnostic outcomes (true or false), resource utilization was assumed to consist of a single general practitioner consultation [32]. In cases of false positive diagnoses, follow-up care included one hepatology consultation and additional investigations: 50 % of patients received a liver ultrasound, 5 % had abdomen or liver CT scans, 5 % underwent abdomen or liver MRI scans, and 15 % received a liver biopsy. These assumptions were informed by prior analyses, including those by Srivastava et al. [20,33]. In cases of false positive diagnoses, follow-up care included one hepatology consultation and additional investigations: 50 % of patients received a liver ultrasound, 5 % had abdomen or liver CT scans, 5 % underwent abdomen or liver MRI scans, and 15 % received a liver biopsy.
For patients with true positive diagnoses, follow-up care was assumed to mirror that of a false positive diagnosis, with the addition of two hepatology consultations. Long-term care costs for each health state were sourced from the literature, considering the ongoing management of MASLD and its complications [34]. After the post-diagnostic follow-up period, patients entered the long-term Markov model, which extrapolated clinical outcomes over a 3-year time horizon. Unit costs and resource utilization details are available in Supplementary Table 3. Future costs and health effects, modelled in years 2 and 3, were discounted at an annual rate of 3.5 % per annum in line with the NICE health technology evaluations manual [35–38].
2.7Health utilitiesHealth utilities are estimates of patients' preferences for different health states and serve as critical measures for the quality adjustment of outcomes. In this study, we utilized EQ-5D utility scores from our MASLD registries [39]. Utility scores for patients with decompensated liver disease were derived from SF-6D scores from participants in registries and peer-reviewed literature [40]. Given that the health utility data were primarily derived from clinical trial settings, a 5 % discount was applied to the utility scores to better reflect the health utility of MASH patients in real-world clinical practice. MASH-associated health utilities by health state are provided in the supplementary material.
2.8Eligible patient populationThe number of patients with MASLD eligible for a non-invasive test (NIT) for advanced fibrosis was estimated based on the total MASLD population in England. This estimate was derived by applying a crude prevalence rate of 25 % to the 56,536,000 individuals living in England. The number of individuals with a MASLD diagnosis was based on UK-specific data from Alexander et al. (2018), which reported 23,529 diagnosed cases among 9085,325 individuals with at least one year of registration in The Health Improvement Network (THIN) database [41]. Of the 36,603 diagnosed MASLD patients, it was assumed that one-third (12,201) would receive an NIT for advanced fibrosis annually. For undiagnosed MASLD patients, the proportion with elevated ALT levels was obtained from McPherson et al. (2013), a UK-specific study [42]. Among these individuals, it was assumed that 10 % would have their ALT elevation incidentally detected each year, leading to an estimated 324,240 undiagnosed MASLD patients annually being eligible for an NIT for advanced fibrosis.
2.9Ethical statementEthics approval and consent to participate- Not applicable.
3Results3.1Diagnostic accuracy of screening pathwaysThe diagnostic accuracy of the evaluated pathways varied significantly. The standard of care (SoC) had a false diagnosis rate of 36.26 %, while combining FIB-4 with ELF or TE further improved diagnostic accuracy, achieving false positive rates of 23.20 % and 20.91 %, respectively. The corresponding true diagnosis rates were 63.74 % for SoC, 76.80 % for FIB-4/ELF, and 79.09 % for FIB-4/TE (Table 1 and Fig. 2).
Diagnostic accuracy of each screening strategy in MASLD management in UK.
| TN | FN | FP | TP | FDR | TDR | |
|---|---|---|---|---|---|---|
| Standard of care | 0.6227 | 0.0273 | 0.3353 | 0.0147 | 0.3626 | 0.6374 |
| FIB-4/ELF | 0.7357 | 0.0097 | 0.2223 | 0.0323 | 0.2320 | 0.7680 |
| FIB-4/TE | 0.7587 | 0.0099 | 0.1993 | 0.0321 | 0.2091 | 0.7909 |
ELF, enhanced liver function test; FDR, false detection rate; FIB-4, fibrosis score; FN, false negative; FP, false positive; SoC, standard of care; TDR, true detection rate; TE, transient elastography; TP, true positive.
The decision tree model estimated that using FIB-4/ELF or TE to assess the annual cohort of 336,441 eligible patients for advanced fibrosis would lead to significant reductions in unnecessary hepatology referrals compared to SoC pathways. Specifically, FIB-4/ELF and FIB-4/TE would reduce unnecessary referrals by 38,031 (33.71 %) and 45,767 (40.57 %), respectively, compared to 112,807 referrals under standard of care (Fig. 3).
3.3Economic evaluation and cost-effectiveness of screening pathways for advanced fibrosis in MASLD referrals to hepatology consultations.")
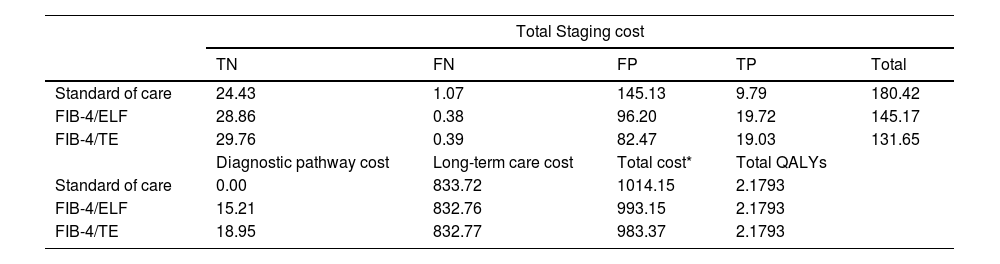
Health economic modelling demonstrated that sequential NIT strategies resulted in cost savings compared to the SoC. The total per-patient costs (including diagnostic, staging and long-term care cost) were GBP 1014.15 for SoC, GBP 993.15 for FIB-4/ELF, and GBP 983.37 for FIB-4/TE (Table 2).
Cost breakdown and quality-adjusted life years (QALYs) for each screening strategy in MASLD management in UK.
| Total Staging cost | |||||
|---|---|---|---|---|---|
| TN | FN | FP | TP | Total | |
| Standard of care | 24.43 | 1.07 | 145.13 | 9.79 | 180.42 |
| FIB-4/ELF | 28.86 | 0.38 | 96.20 | 19.72 | 145.17 |
| FIB-4/TE | 29.76 | 0.39 | 82.47 | 19.03 | 131.65 |
| Diagnostic pathway cost | Long-term care cost | Total cost* | Total QALYs | ||
| Standard of care | 0.00 | 833.72 | 1014.15 | 2.1793 | |
| FIB-4/ELF | 15.21 | 832.76 | 993.15 | 2.1793 | |
| FIB-4/TE | 18.95 | 832.77 | 983.37 | 2.1793 | |
ELF, enhanced liver function test; FIB-4, fibrosis-4 score; FN, false negative; FP, false positive; GBP, Great British Pounds; SoC, standard of care; TE, transelastography; TN, true negative; TP, true positive; QALYs, quality of adjusted life years.
All cost values are displayed in GBP.
While FIB-4/ELF and FIB-4/TE incurred higher initial diagnostic costs than SoC, the overall cost savings were largely driven by reduced staging costs. Staging costs were GBP 145.17 for FIB-4/ELF and GBP 131.65 for FIB-4/TE, compared to GBP 180.42 for SoC. These higher staging costs in SoC were mainly due to significantly higher false positive rates, with false positive staging costs accounting for 80.44 % of the total staging costs. In contrast, false positives accounted for 66.27 % of staging costs for FIB-4/ELF and 62.65 % for FIB-4/TE. Reducing false positives not only minimized unnecessary referrals but also significantly alleviated the financial burden, as each hepatology referral incurs a cost of GBP 185 from the national payer perspective. Total QALY estimates were comparable across pathways due to the short time horizon and the low prevalence of advanced fibrosis in the primary care setting.
4DiscussionThis in-depth study evaluated the cost-effectiveness of strategies to identify patients at high risk for adverse outcomes associated with MASLD in primary care settings in the UK. Our findings suggest that, among patients with MASLD, sequential non-invasive tests (NITs), specifically FIB-4 followed by ELF or FIB-4 followed by TE, are both cost-effective strategies compared to the current standard of care (SoC). These results align with prior studies that reported the diagnostic and economic benefits of using these NITs for risk stratification of individuals in MASLD [43–46]. Furthermore, this analysis extends the existing literature by demonstrating that sequential testing with FIB-4/ELF or FIB-4/TE can reduce the number of unnecessary referrals to hepatologists, an issue of growing concern due to the shortage of hepatology specialists and limited access to care [47,48]. The cost-effectiveness of the FIB-4/ELF and FIB-4/TE pathways is primarily driven by a reduction in unnecessary hepatology referrals. The use of two sequential NITs significantly reduces the number of false positive referrals relative to SoC, leading to a more efficient allocation of healthcare resources, alleviating pressure on specialist services, and improving the accuracy of identifying patients who truly require specialist care. Importantly, this can also reduce the emotional burden on patients who would otherwise face unnecessary tests and interventions [49]. As noted earlier, the availability of hepatology consultations in the UK is constrained due to limited hepatology referral capacity, and the high referral volumes associated with SoC could make it difficult to manage within the healthcare system [32,50]. Based on the modeling analysis, we suggest that the FIB-4 testing should be followed by an ELF test or by TE to substantially reduce the rate of false positive referrals, in turn reducing referral volumes to a potentially more manageable level.
While TE remains a valuable diagnostic tool, its implementation in primary care can be limited by availability issues and the need for specialized training. In contrast, ELF testing can be ordered through standard laboratory facilities, making it more feasible for primary care settings. Nevertheless, ELF costs can vary, which can affect the accessibility of this test in different settings [51]. The recent NICE diagnostics guidance on the use of TE in primary care settings [52] will likely influence future policy decisions. Among other things, the NICE guidance shows that the costs of TE are highly dependent on device lifespan and testing throughput, with the latter variability driven by the high fixed capital costs of the TE equipment, probes, and software, on top of ongoing costs of service contracts and staff training. Regardless, the findings from the present study may provide useful evidence to inform the use of these secondary NITs (ELF and TE) in primary care settings.
One of the key strengths of this study lies in its use of a UK-specific Markov model, which was validated through a combination of data sources, including the Global Burden of Disease (GBD) study. This approach ensured that the model is representative of the healthcare landscape in the UK, making the findings directly relevant to decision-makers in this context. By using multiple sources to validate the model, we have enhanced the robustness and generalizability of the results, ensuring they reflect the true healthcare burden and cost-effectiveness of different diagnostic strategies in the UK. Furthermore, the model incorporated UK-specific data on healthcare costs and referral patterns, which strengthened the relevance and applicability of the conclusions for UK-based policy and practice.
Although this study offers valuable insights, there are some limitations. First, the use of multiple data sources for test accuracy may introduce availability bias, though this was minimized by relying on peer-reviewed, published data and reliable large datasets. We also assumed that all high-risk MASLD patients would undergo testing over a three-year period, which could overestimate some costs; however, this assumption is consistent with current guidelines recommending re-testing every 2 to 3 years [12–15]. The study focused on direct costs associated with MASLD severity and did not account for the impact of co-existing comorbid conditions such as sarcopenia, which may contribute to the overall healthcare burden. The three-year time horizon also limited our ability to capture long-term effects of these comorbidities. Finally, while recent changes in the definitions of NAFLD, MAFLD, and MASLD may not substantially affect our findings, they may influence the prospective cost savings of these risk-stratification strategies, warranting consideration in future research.
5ConclusionsA care pathway combining FIB-4/ELF or FIB-4/TE for risk stratification of MASLD patients in the UK is cost-saving and efficient compared to standard care or FIB-4 alone. While TE faces challenges in primary care settings, ELF testing offers a practical alternative that can be integrated into routine practice. By reducing unnecessary referrals, these sequential NIT strategies improve both patient care and healthcare efficiency. As MASLD prevalence continues to rise, the implementation of these strategies will help ensure timely care for high-risk patients, reduce the strain on hepatology services, and guide decision-makers in the UK in developing policies that address the growing burden of liver disease.
Author contributionsZ.M.Y., J.M.P., and R.F.P. were responsible for study design, data interpretation, manuscript writing, and editing; J.M.P., R.F.P., and M.S. were responsible for statistical analysis; L.H. was responsible for data interpretation, manuscript writing and editing, and critical review; F.N. was responsible for study administration and supervision. All authors reviewed the manuscript. Z.M.Y. takes full responsibility for the whole of the work.
FundingThis study was partially supported by the Center for Outcomes Research in Liver Diseases, Washington DC, the Beatty Liver and Obesity Research Fund, Inova Health System, Falls Church, VA. Also, research funding was received from Siemens Healthineers Diagnostics.


