Abstracts of the 2022 Annual Meeting of the ALEH
Más datosScreening patients with liver cirrhosis for the detection of hepatocarcinoma is a daily challenge. Abdominal Doppler ultrasound has moderate sensitivity, as observed so far in published studies. The characterization of the liver visualization obtained can play an important role in determining its diagnostic capacity. This study aimed to evaluate the degree of liver visualization according to the US-LiRads system in patients with liver cirrhosis.
Materials and MethodsProspective descriptive study of patients in the Hepatology service of the Holy Heart Sanatory from October 2018 to May 2022. One hundred-one patients with liver cirrhosis were evaluated by ultrasound during the usual follow-up of the service, collecting and characterizing laboratory data, body mass index (BMI), cause of cirrhosis and ultrasound (Ascites). Liver visualization was characterized according to the US-LiRads system. It classifies into Visualization A (no or minimal limitations), Visualization B (moderate limitations), and Visualization C (severe limitations. A statistical analysis was carried out to determine if these factors influence the degree of visualization, comparing the continuous variables with the Student's t test and the categorical ones with the chi-square test. A p value less than 0.05 was considered statistically significant.
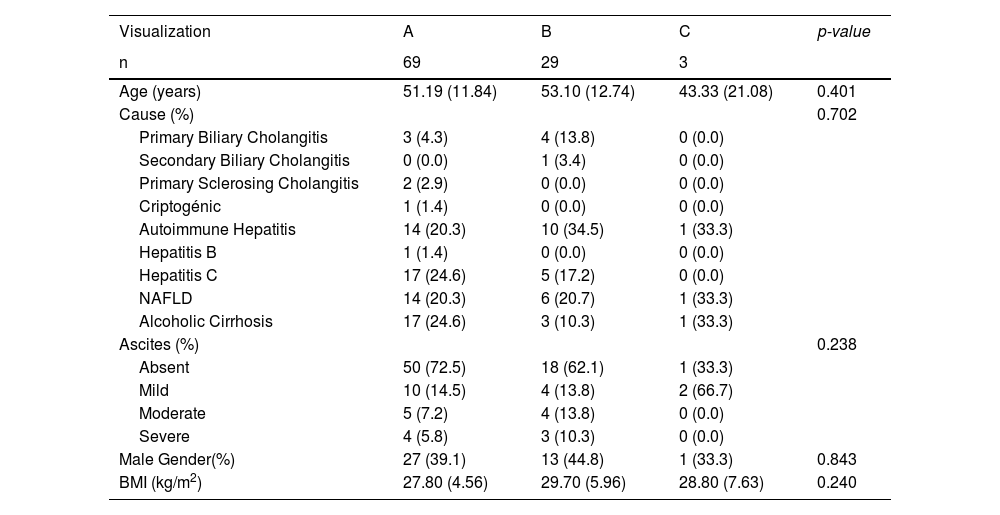
Results101 patients evaluated, we have documented that 68.3% present Visualization A, 28.7% Visualization B and the remaining 3% Visualization C (figure 1). We were unable to detect an association between age, cause of cirrhosis, sex, BMI, or presence of ascites with the degree of visualization (Table 1).
ConclusionsWe can assert that liver Doppler ultrasound continues to be an acceptable method of screening since most patients present acceptable liver visualization. It was not observed that the patient's own factors affect liver Visualization. It would be necessary to carry out future studies to determine how less liver visualization affects screening.
Table 1. Characterization of the liver visualization and Associations


