To correlate the left ventricular parameters obtained with 64-slice Volumetric Computed Tomography (VCT) with those obtained with the reference standard, cardiovascular magnetic resonance (CMR) imaging.
MethodsVCT and a 3.0T MRI scanner were used. Results from both studies were independently evaluated by two cardiologists. A linear correlation and a paired Student's t test were used to analyze the data with a P<0.05 being considered significant.
ResultsThirty consecutive patients were evaluated with VCT and CMR. The left ventricular indices for CMR and VCT were, respectively, mass 86.4±25.8 vs. 82.7±27.6g (P=0.31); ESV 45.5±27.8 vs. 48.7±40.4ml (P=.405); EDV 101.3±32.7 vs. 105.1±44.0ml (P=0.475); SV 55.9±16.1 vs. 56.8±15.6ml (P=0.713); LVEF 57.5±13.2% vs. 56.9±12.4% (P=0.630). No differences in intraobserver variability for both methods were found, CT r=0.96, r2=0.92 P<0.0001 and MR r=0.96 r2=0.93 P<0.0001. There was no significant statistical difference in the presence of artifacts.
ConclusionThere is a close correlation between CMRI and VCT in the evaluation of LV function. VCT is as useful as 3T CMR, and could be incorporated as another resource for evaluating LV function.
Correlacionar los parámetros del ventrículo izquierdo obtenidos con la tomografía computarizada volumétrica (TCV) de 64 cortes con el estándar de referencia, la resonancia magnética cardiaca (RMC).
MétodosSe usó una TCV de 64 cortes y una RMC de 3.0 Teslas. Ambos estudios fueron interpretados de manera independiente por dos cardiólogos. Los datos se analizaron con la prueba t de Student y una correlación lineal, resultando significativo valores de P<0.05.
ResultadosTreinta pacientes consecutivos fueron evaluados con TCV y RMC. Los índices del ventrículo izquierdo mediante RMC y TCV fueron, respectivamente, masa 86.4±25.8 vs. 82.7±27.6g (P=0.31); volumen telesistólico 45.5±27.8 vs. 48.7±40.4ml (P=0.405); volumen telediastólico 101.3±32.7 vs. 105.1±44.0ml (P=0.475); volumen latido 55.9±16.1 vs. 56.8±15.6ml (P=0.713); fracción de eyección de ventrículo izquierdo 57.5±13.2% vs. 56.9±12.4% (P=0.630). No hubo diferencias entre la variabilidad intraobservador para ambos métodos, CT r=0.96 r2= 0.92 P<0.0001 y MR r=0.96 r2r=0.93, P<0.0001. No se encontraron diferencias significativas en la presencia de artefactos.
ConclusiónHay correlación estrecha entre RMC y TCV en la evaluación de la función ventricular. La TCV es tan útil como la RMC y pudiera incorporarse como otro recurso para valorar la función ventricular.
The evaluation of left ventricular function and mass has both prognostic and therapeutic implications; therefore, pharmacological, interventional or surgical interventions of left ventricular dysfunction require an adequate tool for staging and follow-up.1,2
Cardiovascular magnetic resonance (CMR) at 1.5T has been proven reliable for the evaluation of left ventricular (LV) function and is still used in many centers for cardiac assessment. It is currently accepted as the standard of reference for the evaluation of LV volumes, ejection fraction, and mass.2,3 The use of CMR at 3T has increased over the last few years. 3-T CMR provides a higher magnetic field, which translates into an increased contrast to noise ratio and signal to noise ratio, resulting in a clearer image of anatomical structures. It also allows faster image acquisition and a shorter repetition time. However, technical difficulties, such as compromise in B0 and B1 homogeneity, increased artifact resulting in signal loss, and increased specific absorption rate, which may approach the upper limit, have arisen from this technique.4–6
Multi-Slice Cardiovascular Computed Tomography using 16 slices or higher is another tool that has proved to be effective in the evaluation of coronary artery disease. This method allows concurrent evaluation of coronary anatomy and ventricular function, showing accurate values when compared to the reference standard, CMR.7–10
The objectives of this study are to evaluate the correlation between LV parameters, global and regional wall motion abnormalities, and the presence of artifacts using 3-T CMR and 64-slice Volumetric Computed Tomography (VCT), in patients with known or suspected coronary artery disease.
Materials and methodsSubjectsThirty patients (23 men, aged 54.3±8 years) who presented with known or suspected coronary artery disease between April 2006 and July 2007 and who were referred for computed tomography coronary angiography and CMR underwent examination on a 3T MR scanner and cardiac VCT. Patient preparation and screening for contraindications were essential to ensure patient safety and optimal quality studies. Exclusion criteria for CT examination were renal insufficiency (serum creatinine>1.5mgs/dl), atrial fibrillation or another irregular rhythm. Patients with an unstable condition or an intervention between the different examinations were excluded. All patients provided written informed consent for contrast administration and the hospital ethics and research committee approved the study protocol.
Magnetic resonance imagingImage acquisitionA 3-T MRI system using a cardiac 8 channel coil, with 23 to 50mT/m, slew rate of 80–150T/m/s was used (Signa Excite HD, GE Medical Systems, Milwaukee,WI). Cine-MRI was performed in short axis (SAX) (6–8 slices, steady-state free precession sequences) with additional horizontal long axis (HLA) and vertical long axis (VLA) slices, using a 10-mm thickness, no spacing, Flip Angle 40, Field of View (FOV) 38–44cm, Partial FOV of 0.75, phase 320, frequency 224, 1 NEX, 24 vps. Offline analysis of Global functional parameters were obtained with commercially available software (MASS analysis v6.1, Medis, NL) and as needed, corrected by using manual definition of the LV borders, applying the same method for the CT studies. Also, measurements were obtained twice for both methods to analyze interobserver variability of LV parameters.
Myocardial delayed imagingMyocardial Delayed Enhanced (MDE) images were obtained in short axis (6–8 slices), HLA, and VLA 10min after 0.2mmolkg−1 Gd-DTPA at a 3mls−1 rate was administered. An inversion recovery-fast-gradient-echo (IR-FGRE) sequence was used with a slice thickness of 10mm, no spacing, flip angle 20°, whole gradient, Partial FOV 44cm, NEX 2, Phase 128, Frequency 128, 24 vps, with an inversion time of 175–250ms, adjusted to obtain proper myocardial saturation. Myocardial necrosis was defined as the region of the myocardial wall in which the persistence of the contrast agent was observed in two contiguous slices in the area of at least one coronary territory. A transmurality score was obtained (thickness of the contrast enhanced wall divided by the thickness of the whole myocardial wall×100%) and classified according to its extension from such images and classified as follows: 1–25%, 26–50%, 51–75% and >75%, for the assessment of abnormal regions and to determine whether a segmental wall motion abnormality (WMA) was due to an artifact, an infarct or both.
Cardiac tomography acquisitionA 64-slice VCT (GE Medical Systems, Milwaukee, WI) was used for ECG-gated cardiac data acquisition. After a right antecubital 18 Fr vein access was obtained, intravenous beta blocker was administered in all patients with no oral beta blocker or contraindication (metroprolol 5–30mg IV) to reduce heart rate to <65beats/min. Sequential images were acquired at the level of the aorta and pulmonary artery using 20ml of a non-ionic contrast (Iopamidol, 370, Bracco Diagnostics, Inc, Monroe Township, NJ) at 5–7mls−1, followed by a saline bolus of 20ml for timing of the arrival of contrast; 3s were added to the time delay. The scanner parameters were cardiac segment or cardiac burst, retrospective ECG-gating with ECG modulation for dose reduction, gantry rotation of 350ms, gantry tilt 0, slice thickness of 0.625mm×0.625mm, speed 6.0, pitch 0.3:1, SFOV Large, Kv 100–120, ECG Modulated mA of 400–740.
Images were acquired during apnea after hyperventilation. A retrospective reconstruction of the cardiac cycle was performed using 10% space intervals to obtain a complete cardiac cycle. Offline analysis of the images was performed at a workstation (Advantage Windows v4.2, GE Medical Systems, Milwaukee, WI). These were 6–10 SAX, HLA, and VLA obtained in a manner similar to that of cardiac MRI, with a 10-mm slice thickness and a 0.5-mm interval.
Left ventricular function parametersGlobal parametersGlobal left ventricular ejection fraction (EF), end-diastolic volume (EDV), end-systolic volume (ESV), stroke volume (SV) and myocardial mass parameters were obtained and compared to those of VCT.
Assessment of wall motion abnormalityFor VCT and CMR, cine loops of short axis slices (basal, mid-ventricular, apical,) as well as the 2 and 4 chamber orientation and graded using a 17-segment LV model according to the American Heart Association/American College of Cardiology guidelines were evaluated by 2 independent, blinded, experienced cardiologists, who had no knowledge of clinical information.11 Images were scored as follows: normal=0, hypokinesis=1, akinesis=2 and dyskinesis=3. The WMA was also matched to its corresponding segment on the MDE images.
Evaluation of Image quality and Artifacts MRIMRI and CT artifacts were graded as the amount of LV myocardial wall not visualized in its entirety due to artifacts in each of the 17 segments as follows: 0=normal, 1=myocardium not visualized<25%, 2=myocardium not visualized>26–50%, 3=myocardium not visualized>51–75%, 4=myocardium not visualized>76–100%.
Statistical analysisData are expressed as mean values±standard deviation (SD). Comparisons between groups were assessed by a Two-sample t test and chi-square analysis for continuous and categorical variables. The correlation between continuous variables was assessed by Pearson's test, and Bland–Altman analysis was used to compare the quantitative data of CT with the reference standard CMR. The degree of agreement was expressed as the mean difference, limits of agreement (2 SD), and standard error of the mean differences. Kappa analyses of the global agreement between two observers in image quality and regional wall motion scores between VCT and CMR were performed and valued as follows: 0–0.2 low, 0.21–0.40 moderate, 0.41–0.60 substantial, 0.61–0.80 good, and ≥0.81 perfect agreement. The correlations between HR and the percent difference of EF, EDV, ESV (percent difference (%)=[(CT−CMR)/CMR]–100%), and summed scores between VCT and CMR, were additionally assessed by linear regression and correlation coefficient analyses. Data are expressed as means±standard deviation (SD). A P value <0.05 was considered statistically significant.
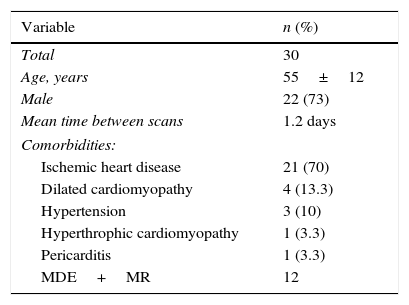
ResultsThirty patients with a mean age of 55±12 years were included; 22 were men (73%) and 8 were women (27%). The mean time between scans was 1.2 days. No intervention was performed nor major hemodynamically or significant clinical events occurred during such scans. Clinical indications for the scans were ischemic heart disease, 21 (70%), dilated cardiomyopathy, 4 (13.3%), hypertension, 3 (10%), hypertrophic cardiomyopathy, 1 (3.3%), and pericarditis, 1 (3.3%). (Table 1)
Patient demographics.
| Variable | n (%) |
|---|---|
| Total | 30 |
| Age, years | 55±12 |
| Male | 22 (73) |
| Mean time between scans | 1.2 days |
| Comorbidities: | |
| Ischemic heart disease | 21 (70) |
| Dilated cardiomyopathy | 4 (13.3) |
| Hypertension | 3 (10) |
| Hyperthrophic cardiomyopathy | 1 (3.3) |
| Pericarditis | 1 (3.3) |
| MDE+MR | 12 |
MDE+MR, myocardial delayed enhanced+magnetic resonance
Overall, a strong correlation between LV function values for both methods was obtained. An overestimation of mass for CT was noted, although this was not statistically significant. The results for left ventricular indices were (for MRI and CT, respectively) mass 86.4±25.8 vs CT 82.7±27.6g (P=0.31), ESV 45.5±27.8 vs. 48.7±40.4ml (P=0.405), EDV 101.3±32.7 vs 105.1±44.0ml (P=0.475), SV 55.9±16.1 vs 56.8±15.6ml (P=0.713); LVEF 57.5±13.2% vs 56.9±12.4% (P=0.630). (Table 2) No significant differences were found in intraobserver variability for either method CT r=0.96 r2=0.92, P<0.0001 and MR r=0.96 r2=0.93, P<0.0001 (Fig. 1).
Global left ventricular function assessed by cardiovascular magnetic resonance (CMR) and computed tomography.
| Parameter | CT (n=30) | CMR (n=30) | P |
|---|---|---|---|
| Mass, g | 86.4±25.8 | 82.7±27.6 | 0.311 |
| ESV, ml | 45.5±27.8 | 48.7±40.4 | 0.405 |
| EDV, ml | 101.3±32.7 | 105.1±44.0 | 0.475 |
| SV, ml | 55.9±16.1 | 56.8±15.6 | 0.713 |
| LVEF, % | 57.5±13.2 | 56.9±12.4 | 0.63 |
CMR, cardiovascular magnetic resonance; VCT, volumetric computed tomography; EDV, end diastolic volume; ESV, end systolic volume; LVEF, left ventricular ejection fraction; SV, stroke volume.
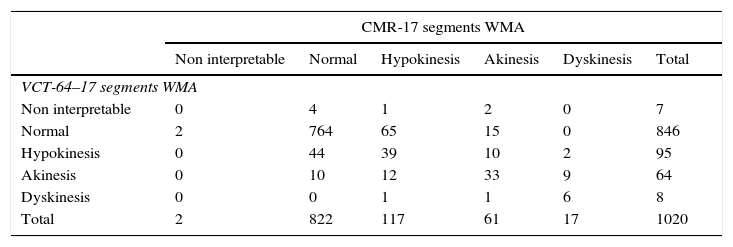
The rank correlation analysis included 1020 segments assessed by two experienced observers. Observers analyzed segmental wall motion abnormalities as previously described in the methods section. A strong correlation for both methods was found among observers, Spearman ρ=0.554; P<0.001 Kendall τ–c=0.211; P<0.001. (Table 3)
Correlation between volumetric computed tomography and cardiovascular magnetic resonance when evaluating wall motion abnormalities. Spearman ρ=0.554; p<0.001 Kendall τ–c=0.211; p<0.001.
| CMR-17 segments WMA | ||||||
|---|---|---|---|---|---|---|
| Non interpretable | Normal | Hypokinesis | Akinesis | Dyskinesis | Total | |
| VCT-64–17 segments WMA | ||||||
| Non interpretable | 0 | 4 | 1 | 2 | 0 | 7 |
| Normal | 2 | 764 | 65 | 15 | 0 | 846 |
| Hypokinesis | 0 | 44 | 39 | 10 | 2 | 95 |
| Akinesis | 0 | 10 | 12 | 33 | 9 | 64 |
| Dyskinesis | 0 | 0 | 1 | 1 | 6 | 8 |
| Total | 2 | 822 | 117 | 61 | 17 | 1020 |
CMR, cardiovascular magnetic resonance; VCT, volumetric computed tomography; WMA, wall motion abnormalities.
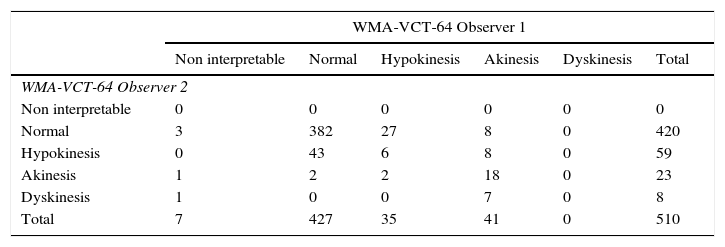
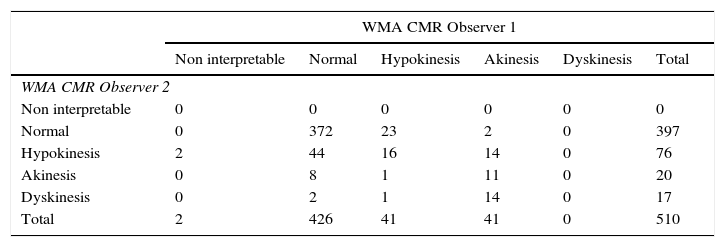
Interobserver variability assessing wall motion was low for both methods with a slight difference in documenting normal versus hypokinesis; CT had an observed concordance=0.796, an expected concordance=0.701 κ=0.3178; 95% CI=0.2302–0.4350; P<0.00001. (Table 4) When compared to VCT, CMR had fewer non-interpretable studies, but had a greater number of variability between observers; observed concordance=0.78, expected concordance=0.66, κ=0.3496; 95% CI=0.2702–0.4290 (Table 5). The incidence of artifacts was not statistically different among methods, where most artifacts involved less than 25–50% of subendocardial border visualization.
Interobserver variability of wall motion abnormalities with volumetric computed tomography.
| WMA-VCT-64 Observer 1 | ||||||
|---|---|---|---|---|---|---|
| Non interpretable | Normal | Hypokinesis | Akinesis | Dyskinesis | Total | |
| WMA-VCT-64 Observer 2 | ||||||
| Non interpretable | 0 | 0 | 0 | 0 | 0 | 0 |
| Normal | 3 | 382 | 27 | 8 | 0 | 420 |
| Hypokinesis | 0 | 43 | 6 | 8 | 0 | 59 |
| Akinesis | 1 | 2 | 2 | 18 | 0 | 23 |
| Dyskinesis | 1 | 0 | 0 | 7 | 0 | 8 |
| Total | 7 | 427 | 35 | 41 | 0 | 510 |
CT, volumetric computed tomography; WMA, wall motion abnormalities.
Interobserver variability of wall motion abnormalities with cardiovascular magnetic resonance.
| WMA CMR Observer 1 | ||||||
|---|---|---|---|---|---|---|
| Non interpretable | Normal | Hypokinesis | Akinesis | Dyskinesis | Total | |
| WMA CMR Observer 2 | ||||||
| Non interpretable | 0 | 0 | 0 | 0 | 0 | 0 |
| Normal | 0 | 372 | 23 | 2 | 0 | 397 |
| Hypokinesis | 2 | 44 | 16 | 14 | 0 | 76 |
| Akinesis | 0 | 8 | 1 | 11 | 0 | 20 |
| Dyskinesis | 0 | 2 | 1 | 14 | 0 | 17 |
| Total | 2 | 426 | 41 | 41 | 0 | 510 |
CMR, cardiovascular magnetic resonance; WMA, wall motion abnormalities.
The use of high field magnetic resonance imposes certain benefits over the conventional standard of reference, CMR at 1.5T; however, initial results have shown a higher incidence of artifacts with 3T. High-field CMR offers a better temporal and spatial resolution, which translates into a faster anatomical evaluation due to faster sequences. The resonance spins are increased, providing robust fat saturation. There is a better response on blood oxygen level dependency (BOLD) effect for fMRI, as well as a greater peak dispersion, making it ideal for spectroscopy studies.12 However, a little or no data are available on 3T for the evaluation of LV function and WMA, as compared to data analyzed by CT and other modalities.8–10
Clinical scenarios where CMR is used can be diverse, including research in normal volunteers, in which no pathology is present and normal hemodynamics and breathing patterns are observed. Imaging patients with pathology may pose some image acquisition problems when compared to normal subjects. Therefore, the limitations of this study include inherent variables due to pathologies, the presence of increased intravascular volumes due to contrast injection during the acquisition of CT datasets, where a non-significant increase in LV volumes was noted in those of CMR, and the use of beta blockers, which may affect stroke volume and exert a negative inotropic effect.
We found a close correlation in the evaluation of global LV function systolic indices; however, in our study 64-slice VCT showed a non-significant tendency to underestimate LV mass. Regional wall motion assessment had a highly significant correlation between both methods, although 75% of the segments analyzed were normal. Interestingly, wall motion of septal segments does not correlate as well as that of the rest of the LV segments. Interobserver variability for wall motion assessed by 64-VCT goes beyond that expected by chance. No significant difference was found in the presence of artifacts when assessing global and regional LV systolic function by 64-VCT.
ConclusionIn this study, 3-T CMR was comparable to 64-VCT in the assessment of LVEF, WMA, volumes, and LV mass without a significant incidence of artifacts. This makes 3-T CMR an excellent option to evaluate these parameters.
Responsabilidades éticasProtección de personas y animalesLos autores declaran que para esta investigación no se han realizado experimentos en seres humanos ni en animales.
Confidencialidad de los datosLos autores declaran que en este artículo no aparecen datos de pacientes.
Derecho a la privacidad y consentimiento informadoLos autores han obtenido el consentimiento informado de los pacientes y/o sujetos referidos en el artículo. Este documento obra en poder del autor de correspondencia.
FundingThis work was partially supported by Endowed Chair in Cardiology-Tec de Monterrey 0020CAT131.
Conflict of interestThe authors declare no conflict of interest.


