Introduction
In 1988, Reaven defined an entity called "syndrome X," characterised by the coexistence of different cardiovascular risk factors in the same person, such as obesity, glucose tolerance disturbances, dyslipidaemia, and high blood pressure.
In 1991 the strong relationship was described between these clinical disorders and resistance to the action of insulin (IR),2,3 which constitutes the physiopathological substrate of metabolic syndrome (MS), as it is now called. Despite this long history, there is still no uniformity in the diagnostic criteria of MS, since 3 large organisations (OMS,4 NCEP/ATPIII,5 and EGIR6) have defined it with their own criteria which, although having the same philosophy, are at variance with the cut off points used for the diagnosis and clinical interpretation.7,8
Epidemiological studies are beginning to appear which give variable data on the prevalence of MS, particularly depending on the origin of the population and the diagnostic method used. Thus, the prevalence can vary from 13% recorded in France9 to 33.4% recorded in Turkey,10 both by using NCEP criteria. It should be pointed out that, in Spain, the recent data provided by DESIRE11 study, with a prevalence which varies depending on which criteria is used, WHO (42.1%), EGIR (26.4%) or NCEP (22.6%). The results of the study in the Canary Islands12 also has to be mentioned, with a figure of 24.4% (according to NCEP).
But the real importance of diagnosing MS lies in the coexistence of different cardiovascular risk factors (CVRF), such as obesity, high blood pressure (HBP), lipid disorders or diabetes mellitus,13 and the fact that the presence of an MS per se brings about a higher morbidity-mortality and practically doubles the cardiovascular morbidity-mortality in the general population.14,15
For all these reasons, the principal objective of our study is to detect the prevalence of metabolic syndrome, its different components and insulin resistance in the adult population of Yecla, Spain. Secondly, we set out to evaluate the level of consistency between the principal definitions of MS themselves and with IR, to analyse the relationship of the different variables to predict IR, and subsequently to evaluate the diagnostic validity of different strategies to carry out this prediction.
Subjects and Methods
Design
Cross-sectional, descriptive population study carried out on adults over 30 years old, cared for in 2 Yecla Health Centres, (8901 men and 9158 women with individual health cards) with a total urban population of 32 468 inhabitants during the year 2001.
Study Population
Using the Murcia Primary Care Management health card database, a sample of 425 individuals were selected for the study of carbohydrate metabolism, using simple randomisation, group by gender and four age intervals (30-42, 43-54, 55-65, and >65 years). The sample size was considered for a prevalence of glucose intolerance of 10% and a precision of 3%.
The following exclusion criteria were established; gestation or puerperium, not of Spanish nationality, on continuous treatment (more than 6 months) with glucose lowering drugs (corticoids and/or thiazides in high doses), serious cardiovascular or systemic diseases (physically or psychologically handicapped to be able to participate in the study), death or population change.
The individuals who had any of the exclusion criteria were replaced by others, again selected randomly and classified by gender and age. Finally, the prevalence of metabolic syndrome was calculated in the 292 subjects who had supporting analytical data.
Measurements
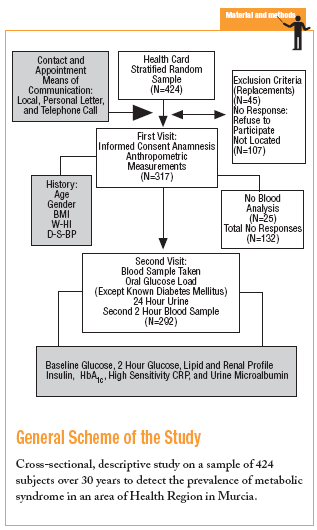
A double visit was carried out to collect the data, as shown in the general scheme of the study.
The variables were:
1. Sociodemographic: age, gender, personal history (HBP, lipid disorders, diabetes, and normal), family history of diabetes, smoking habits ("smoker"; more than 1 cigarette/day, and "non-smoker:" no cigarettes).
2. Anthropometric and physical examination: body mass index (BMI), waist circumference (WC) and waist-hips index (WHI) gathered according to that recommended by the Spanish Society for the Study of Obesity (SEEDO),16 systolic (SBP) and diastolic (DBP) blood pressure (in mm Hg and in accordance with the WHO17 recommendations).
3. Analytical: fasting plasma glucose and after an oral glucose load of 75 g (G2h) (hexokinase method, Hitachi 917 autoanalyser Roche Diagnostics#r with which the other biological determinations were carried out). Also quantified were, 24 h urine microalbumin, lipid profile (total cholesterol, high, and low density lipoprotein cholesterol [HDL-C and LDL-C] and triglycerides, renal profile (urea, creatinine, and uric acid), glycosylated haemoglobin (normal range, 3.5%5.8%, HPLC method, HA-8110 Menarini Diagnostics#r analyser), high sensitivity CRP by the immunoturbidimetric method on the Roche Modular P800 analyser and fasting insulin level.
The samples were processed in the reference laboratory, except the determination of the fasting insulin, which was carried out by radioimmunoassay (Virgen de la Arrixaca University Hospital).
For the glucose metabolism disorders the WHO-19994 diagnostic criteria were used: non-insulin dependent diabetes if the fasting glucose is é126 mg/dL or the G2hé200 mg/dL; impaired glucose tolerance: IGT if G2hé140 mg/dL and <200 mg/dL or IFT if the fasting glucose is é110 mg/dL and 125 mg/dL, and normal if the fasting glucose is <110 mg/dL and G2h<140 mg/dL; previous diagnosis of diabetes was also considered.
To determine insulin resistance the HOMA index was calculated using the formula described by Matthews et al18: insulin (µ/mL) [glucose (mmol/L)/22.5]. According to Ascaso et
al,19,20 IR is considered if the HOMA is é3.8.
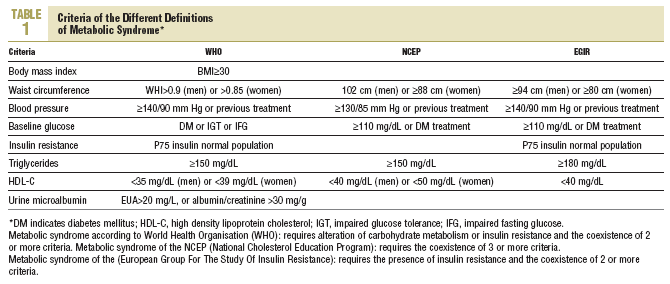
The diagnostic criteria of MS are based on those proposed by 3 large study groups: OMS,4 NCEP/ATP III,5 and EGIR6, and are set out in Table 1.
Data was collected during the months of February to June 2002 by 2 medical residents; the blood samples were taken first thing in the morning in the appropriate health centre by nursing professionals.
The anticipated biases were that of no response and information. To minimise the former, repeated calls were made, and non working days were made available and the final results were adjusted and standardised for age and gender according to the direct method,21 taking the Spanish population of July 2002 as a reference. To decrease the information bias, the measurements were made in the same period and with the same measurement tools for the physical examination; a pilot study with 25 cases was carried out before the study to check the concordance between the two medical residents who carried out the field work.
Statistical Analysis
A descriptive analysis of the variables was performed using frequency distribution tables for qualitative variables. The quantitative ones are summarised as their mean ± standard deviation (SD) and 95% confidence interval (CI).
The prevalence rates are given as crude and adjusted to the population of Segi and Spain (July 2002 according to the National Institute of Statistics).
In the bivariate analysis the *2 test was used for the relationship between qualitative variables and the Student t test and/or analysis of variance (ANOVA) for the quantitative ones.
Agreement between the different methods for diagnosing MS was analysed using the percentage of concordant cases and the kappa index (*), which was considered excellent for values >0.75 and only acceptable for values between 0.75 and 0.40. Values of P<.05 were considered as statistically significant.
The study of the relationship between the variables that could be used to predict the presence of IR (HOMAé3.8) was performed using multivariate stepwise logistic regression models. The statistics computer software SPSS#r (Version 11.0) was used.
Results
A total of 469 patients were contacted, of which 45 (9.6%) had one of the exclusion criteria; 317 (74.8%) came to the first interview and 292 (68.9%) gave a sample of blood. The no responses (not located, did not want to participate and individuals without analytical results) was 31.1%.
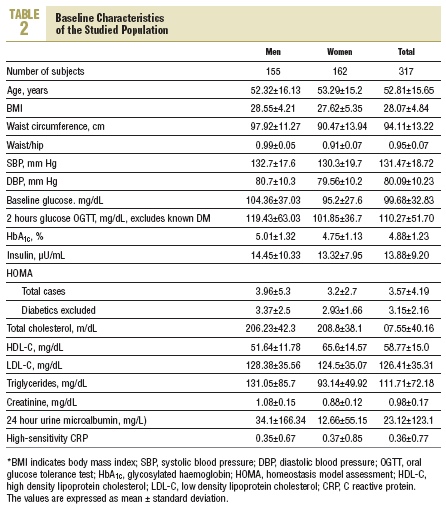
The mean age of the participants was 52.8±15.6 years and 51.1% were women. The baseline characteristics of the study population are shown in Table 2.
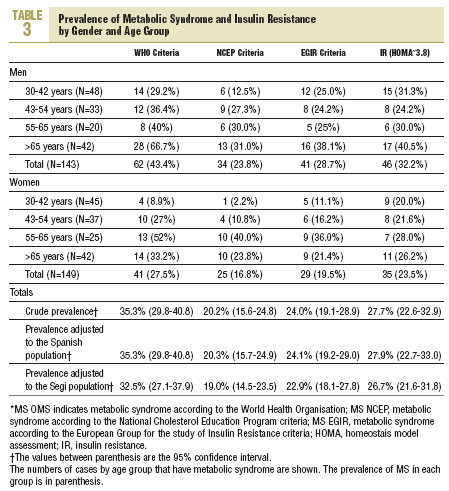
The crude prevalences of MS found were, according to the WHO criteria, 35.3% (95% CI, 29.8-40.8), according to NCEP 20.2% (95% CI, 15.6-24.8) and according to EGIR 24.0% (95% CI, 19.1-28.9). The prevalence of IR (HOMAé3.8) was 27.7% (95% CI, 22.6-32.8). The distribution by age group and gender and their adjustment to the Spanish population and that of Segi are shown in Table 3. In the diabetic population, 70.8, 89.6, or 43.8% had MS criteria depending on which definition, NCEP, WHO, or EGIR, respectively.
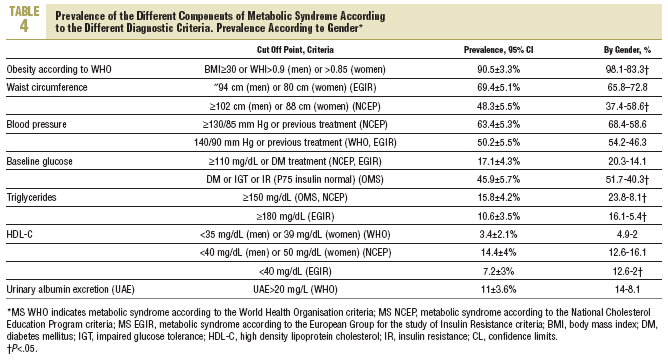
The presence or prevalence of the different components of MS in our population, depending on the different diagnostic criteria used and their distribution by gender are shown in Table 4.
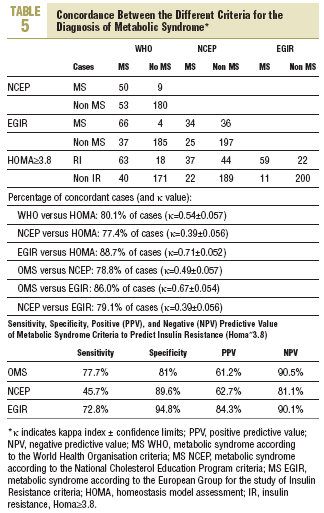
As regards the concordance between the different MS and IR diagnostic criteria (Table 5) we can see that the percentage of concordant cases varies between 77.4% and 88.7% depending on the criteria compared. The * is low (0.39) when we compare the NECP criteria (the most used in clinical practice) with those of EGIR or HOMA. The sensitivity, specificity, the positive predictive value (PPV) and the negative predictive value (NPV) of the MS diagnostic criteria for the diagnosis of IR calculated using a HOMAé3.8, are also shown in Table 5. It was verified that the 3 criteria have a high specificity (around 90%), but with a lower sensitivity (45.7% in the case of the NCEP).
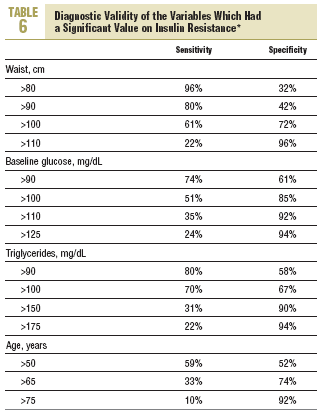
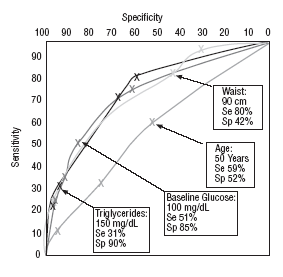
A relationship analysis was carried out on the variables which could predict the presence of one IR (HOMAé3.8) using multivariate regression models. The waist circumference (beta =0.27; P<.001), fasting glucose (beta =0.24; P<.001), triglycerides (beta =0.16; P<.01), and age (beta =0.13; P<.05) have shown to have a significant role. The diagnostic values of the different cut off points of these variables and their ROC curves are set out in Table 6 and in Figure.
FIGURA 1. ROC curve of the 4 variables significantly associated with IR and values of the cut off points of the proposed diagnostic strategy.
The diagnostic validity of the various strategies to predict insulin resistance was then checked. The application of the DESIRE11 criteria on our sample (capillary glucose >90 mg/dL waist é94 cm in men or é80 cm in women) showed a sensitivity of 63% and a specificity of 70%, while those of the "waist-high triglycerides" of Lemieux et al22 (waist >90 cm and triglycerides é175 mg/dL) had a low sensitivity (19%), with a specificity of 95%. In our population, the diagnostic strategy shown to have a higher value was found in subjects with a waist >90 cm, a fasting glucose >100 mg/dL or triglycerides >150 mg/dL (67% sensitivity, 68% specificity, PPV of 53%, and an NPV of 80%).
Discussion
Despite the participation achieved in the study (68.9% of the selected population), it was slightly higher than that of other studies carried out in our country, such as that in the Canary Islands12 and the Spanish Insulin Resistance Study (SIRS) by Lorenzo et al,23 and an acceptable response was not achieved in the women >65 years group, therefore an attempt was made to correct for this bias, which could underestimate the prevalence of MS, by adjusting the results to the 2002 Spanish population and the population of Segi.
The prevalence of the syndrome is high, more in men and increases with age, independent of the criteria used for its definition:
If the NECP criteria are used, it is 20.2%, similar to that obtained in the Canary Isles (24.4%),23 and that of NHANES 1999-2000 in the United States population (27%).24 Of the different components of MS, high triglycerides, high BP and hyperglycaemia occur more frequently in men, while increase in waist circumference and low HDL-C concentrations predominate in women, similar to that in the previously mentioned studies. The frequency of MS (NCEP) among diabetics (70.8%) is less than that detected by Lorenzo et al23 (64.6% in men, 92% in women) and in Finland25 (87,1%).
If the WHO criteria are used, in our population we classify 35.3% of our population to have MS, a higher prevalence than that of Ford et al8 (25.1%) and Meigs et al26 (26.6%) in the United States population, and similar to those of the DESIRE11 study (42.1%) and those of Finland25 (38.8% in men, 22.2% in women), for the same age group. The prevalence among diabetics (89.6%) is slightly higher than that obtained in the study by Botnia14 (80%).
The principal component of MS (WHO criteria) is obesity (90.5%), more frequent, especially in women, than in the previously mentioned studies (67.5% in that of Ford et al8 and 86% men and 38.2% in women in the study by Meigs et al26), consistent with the high prevalence of obesity of our population.27
As regards the level of concordance between definitions (WHO and NCEP), 78.8% of the participants in our study were similarly classified by both definitions (percentage <86.6 obtained by Ford et al8), while the level of concordance was moderate (* of 0.49), similar to that of other studies,26,28 with values between 0.45 and 0.56 depending on the population group analysed.
As regards the predictive capability of the different criteria of MS regarding the IR quantified by HOMA, we should point out that most clinical criteria of the NCEP have shown similar values of sensitivity (46%), specificity (90%) and PPV (63%) to those of Cheal et al.7 The level of disagreement between the different definitions of the syndrome suggest the need for a definition which may be universally accepted, with a good predictive capability of IR and cardiovascular complications. In the multivariate analysis, the 4 variables that showed a significant association with the presence of IR were waist circumference, fasting glucose, triglycerides and age; therefore these have to be taken into account in any MS detection and prevention programme.
Lastly, using the results from the study we designed a screening strategy which enables subjects who have IR to be identified, with a sensitivity of 67% and a specificity of 69%, without having to use the HOMA.
We should suspect this disease in those subjects (men or women) who, having a waist circumference >90 cm, may have a fasting glucose level >100 mg/dL or triglycerides >150 mg/dL.
To summarise, metabolic syndrome is very common in our population, with a considerable variability in the prevalence of its component parts. The tendency for its frequency to increase in the next few decades (associated to the continuing increase in obesity in our population) it could result in an increase in non-insulin dependent diabetes and cardiovascular morbidity and mortality in the area. To achieve changes in lifestyle aimed at reducing weight, waist circumference and an increase in physical activity, mainstays of the treatment of MS, as also described by other authors,29 should be priority objectives in health programmes of the area.


