Introduction
Eating behavioural disorders (EBD) are categorised within the group of behavioural disturbances, which vary as regards their expression, severity and symptomatology. Socio-cultural factors have been shown to be fundamental aetiopathogenic factors in the origin of EBD and in the development of associated psychiatric illnesses.1 Among those factors are mentioned; age,2 body image,3 gender,4 family socioeconomic level,5 diet habits and sports,6 and the relationships and dynamics between family groups or equals.7 Recent epidemiological studies in Spain estimate a high prevalence of EBD among women. The tool used to measure this is the Eating Attitudes Test (EAT) designed by Garner and Garfinkel in 1979, and validated in Spain by Castro et al in 1991.8 Although the original version of EAT contained 40 items, there is a shortened version, EAT-26, designed by Garner et al9 in 1982, whose authors maintain that the reduction in items "does not affect its validity as a predictive element, since its robustness is maintained in the correlation between EAT-40 and EAT-26 with r=0.98."9
The prevalence of anorexia nervosa in Spain is between 0.1% and 1.5%, and that of bulimia nervosa is between 0.5% and 1.5%2; the non-specific EBD are more common, with an estimated prevalence of 1.7%-3.8%.10 These figures have led to discussions on whether there is an epidemic of EBD and the need to face up to the challenge of prevention of the disease and plan health resources.11
To design prevention and health promotion campaigns and to plan care, the risk group and its social characteristics have to be recognised, and the need to establish to what extent it is similar or different from the population. To contribute to this, our objective has been to find out the social and cultural profile of Andalusian urban adolescents, to detect the similarities and/or differences they have compared to the population who obtain high scores in the EAT-26 and to analyse the EAT-26 as a predictive element of EBD.
Methods
Cross-sectional community study of a representative sample of the population.
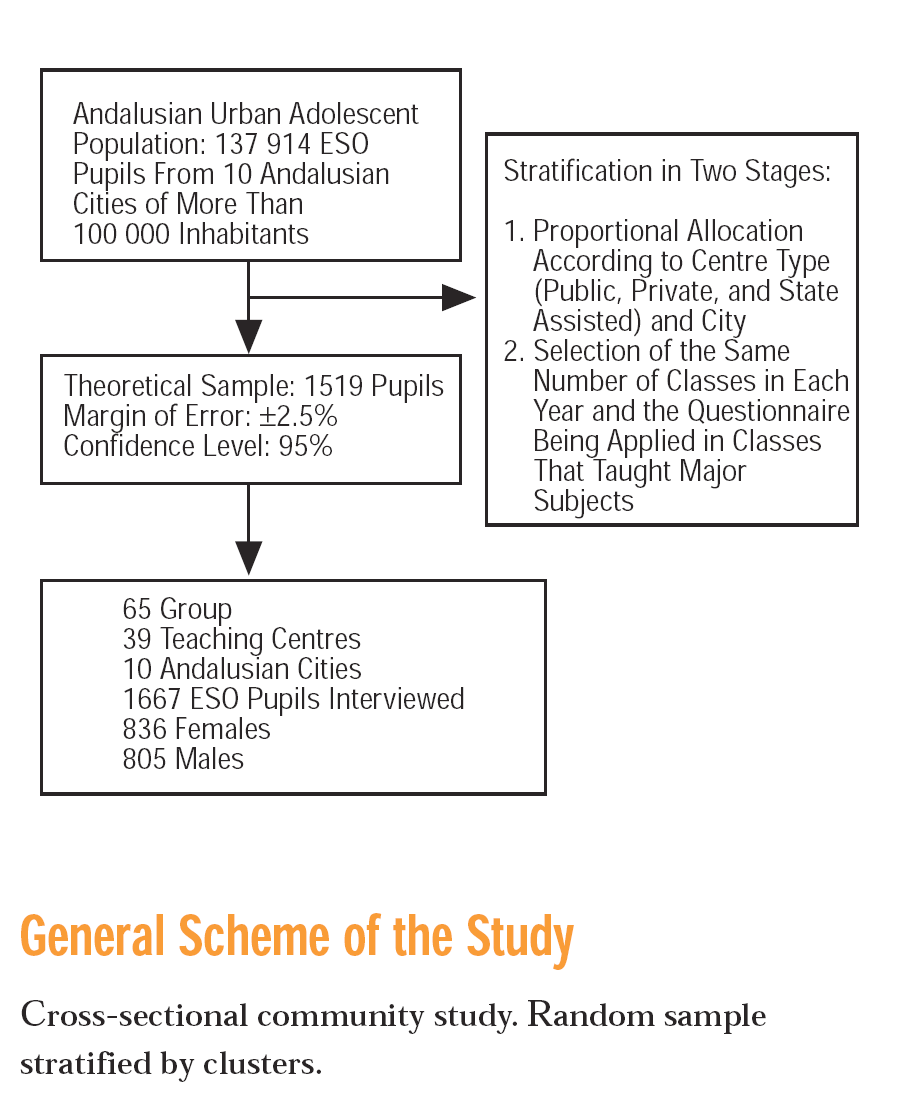
The study population was made up of adolescent schoolchildren between 12 and 16 years old from the first to fourth year of Obligatory Secondary Education (ESO) during the 2002-2003 academic year, residents of Andalusian cities of more than 100 000 inhabitants (Sevilla, Malaga, Granada, Cordoba, Cadiz, Huelva, Almeria, Jaen, Algeciras, and Jerez). The size of the population is 137 914 pupils of both sexes (list provided by the Education Department of the Andalusian Autonomous Government).
A sample of 1667 pupils was selected, 836 females and 805 males, with an error margin of ±2.5% and a 95% confidence level; there was no response in 26 cases.
Stratification by clusters was carried out in 2 phases:
Phase 1: proportional random sample from the list of education centres. They were arranged by city and type of centre (private state assisted, private, and public).
- Phase 2: stratification by courses, ensuring the same number of classes in each of the courses. The classes were selected at random taking into account that they taught the major subjects. The questionnaires were given out and self-administered during class hours by all the pupils present in the class.
Tool
A questionnaire designed by the research team12 was used, which consisted of: a) demographic variables; b) clinical variables (diagnoses of anorexia and/or bulimia mentioned by the person interviewed); and c) social variables: family structure, social status,13 friend relationships, friends with a diagnosis of anorexia and/or bulimia, academic performance, and sports activity. To find out about the diet, we constructed the "diet" interval variable from the frequency of the consumption of 23 normal food products and grouped them, taking into account the calorific value and the frequency of weekly consumption. Eating attitudes were analysed using the EAT-26, a scale validated in Spain.8 The authors proposed a score of ≥20 to describe a population at risk of presenting with EBD.
We established 2 study groups: sample and group 20.
The sample group was the study population group, and the group 20 was the group of adolescents who scored ≥20 in the EAT-26.
Statistical Analysis
The SPSS (version 10.0) statistics program was used. The statistics tests used to compare the groups were the χ2 test for the nominal variables and the Spearman rho rank order correlation to find the relationship between the interval variables. Values of P=.05 were considered significant.
Results
Descriptive Analysis of the Groups
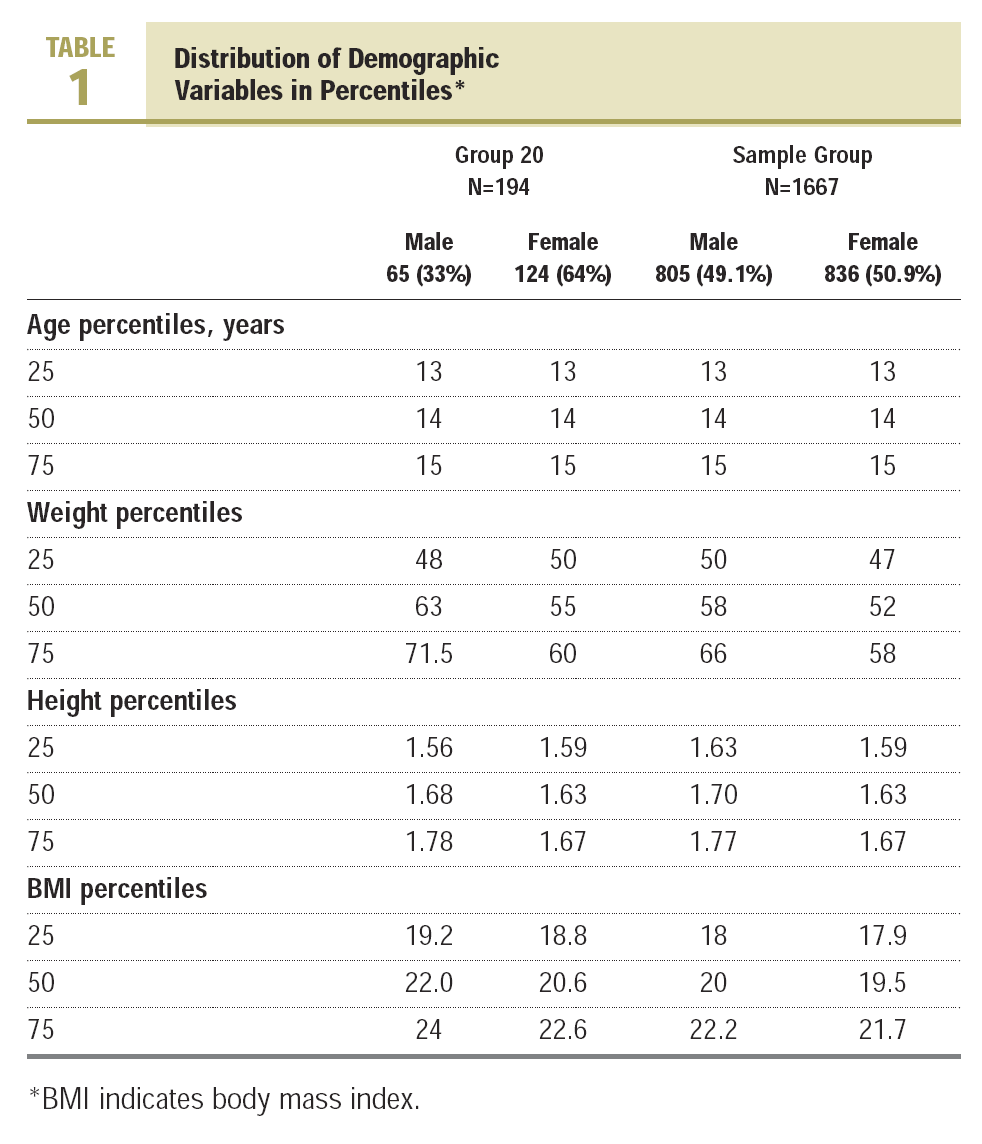
The sample was made up of 1667 adolescents, 836 females (50.9%) and 805 males (49.1%). Group 20 was composed of 124 females (64%) and 65 males (33%) (Table 1). Of the sample group, 28 adolescents mentioned being diagnosed with anorexia and/or bulimia, 14 said with anorexia, 8 with bulimia, and 6 a joint diagnosis of anorexia and bulimia. In the group 20, the number of diagnosed subjects was 14, of which 5 were anorexia, 4 bulimia, and 5 a joint diagnosis of anorexia and bulimia.
Family Structure
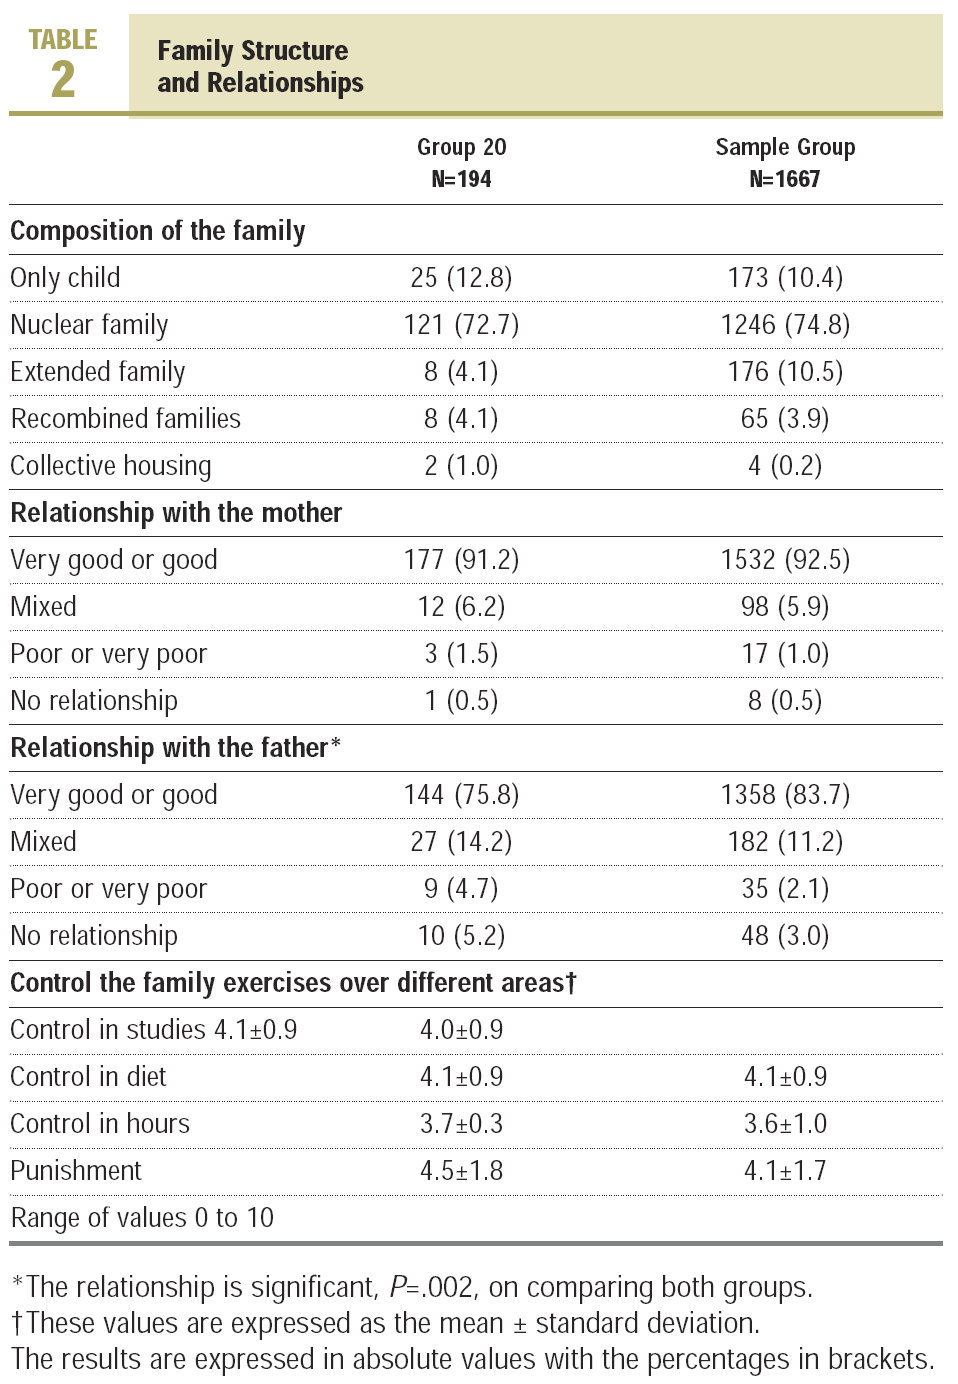
The family structures were very similar between both groups.
74.8% of the sample and 72.6% of the group 20 lived in families with more than one child and 10.4% of the sample and 12.8% of the group 20 were only children. The relationships with parents were good or very good, and in both groups better with the mother. On comparing the results with the sample, we obtained significant statistical differences in the relationships with the father in the group 20 and in disciplinary practices. There were no significant differences in the control the family exercised on the diet, but we observed differences as regards the disciplinary measures index. The group 20 lived in families where stricter disciplinary practices were observed (Table 2).
Social Status
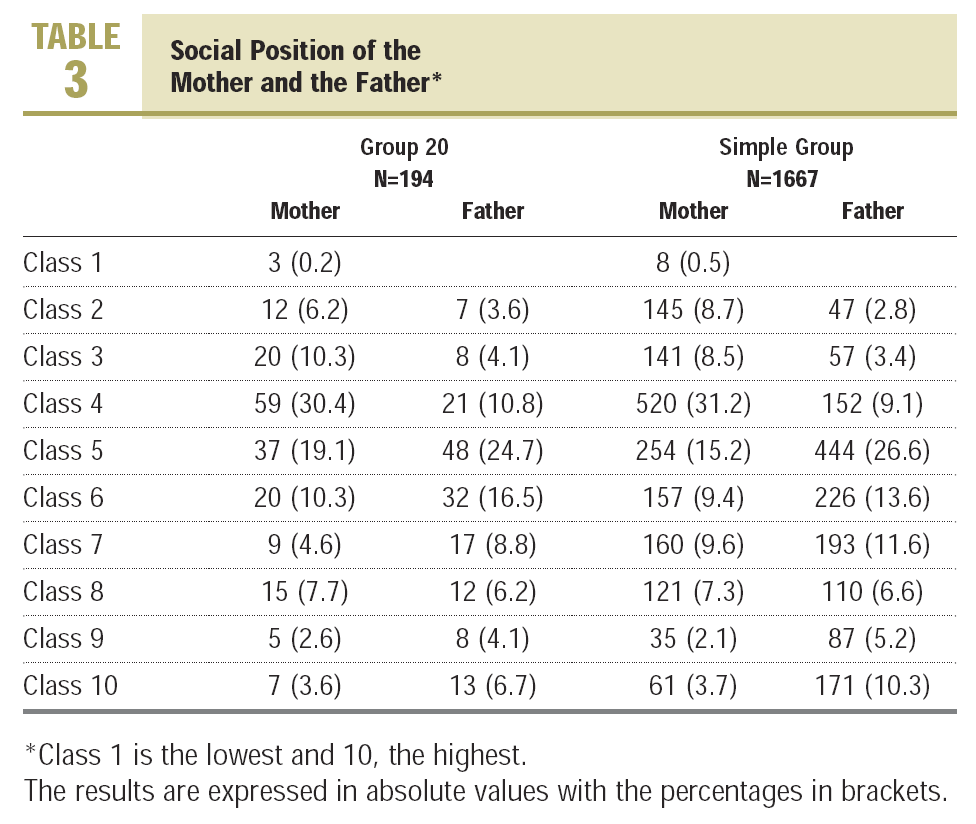
We observed that the mothers occupied a status somewhat inferior to the fathers and no significant differences were seen between the 2 groups (Table 3).
Friendships
The friendships with people of the same sex as well as of different sex were very fluid in both groups. The percentage with more than 7 friends was 84.7% in the group 20 and 82.7% in the sample. As regards the number of friends of different sex, the percentages decrease, but without reaching statistical significance. We found statistically significant differences in the group 20 compared to the sample in greater contact with people diagnosed with eating disorders. Of the group 20, 29% have or had friends with anorexia as against 18% of the sample group (P=.000). Of the group 20, 18.7% of have or had contact with someone who had bulimia compared to 11.7% of the sample group (P=.007).
Academic Performance
There were no significant differences between the group 20 and the sample in the number of hours dedicated to their studies or in academic performance evaluated using the average marks from the previous year.
Sports
The 4 most practiced sports in both groups were gymnastics (19.4% in the sample compared to 29.9% in the group 20), football (20.7% compared to 10.3%), running (8.2% compared to 6.2%), and cycling (5.2% compared to 5.7%).
The objectives for carrying out the sport differed significantly between the 2 groups (P=.000). The main reason for practising sport in the sample and the group 20 was for pleasure (56.4% compared to 28.9%), but in the group 20 the objective of losing weight (26.6% compared to 9.5%) and to improve certain parts of the body, higher percentages were obtained than in the sample (28.9% compared to 17.6%).
Eating Attitudes
The sample obtained a mean score of 9.04 with a standard deviation (SD) of ±8.6 and the group 20, mean 27.5±7.5.
Relationship Between Variables
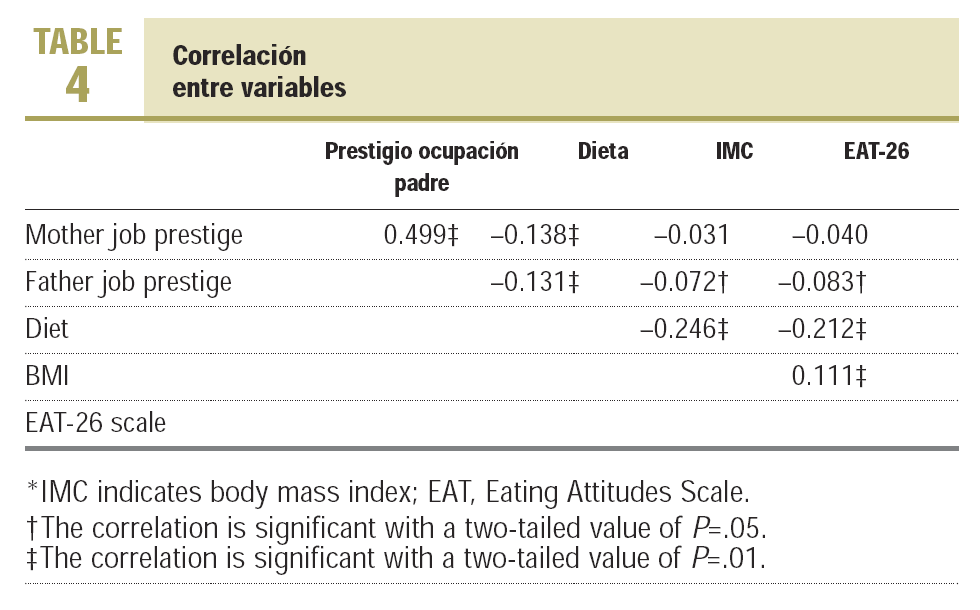
There is a negative relationship between the diet the pupil follows and the self-perceived body mass index (BMI) (0.246) and the score obtained in the EAT-26 (0.212).
The EAT scores were positively associated with the BMI (0.111) and negatively with social status of the father (0.083). This means that more low calorie diets are followed in family structures with a higher social status.
On repeating the calculations of the bivariate correlation coefficients with the group 20, no correlations were seen between the diet, the self-perceived BMI, and the EAT-26 (Table 4).
Discussion
In Andalusia, 11% of the urban adolescent population scored more than 20 in the EAT-26, which is similar to that obtained in other studies.14-17
The social status of the father and/or the mother and academic performance are no different from that of the total population, data that questions the association between risk of EBD and social class.18 We have found some distinguishing characteristics between the 2 study groups, in that the group 20 were more dissatisfied with their bodies, practised sport with the objective of improving certain parts of the body and more often followed a low calorie diet. These findings are in agreement with other authors, who associated body dissatisfaction with problematic behaviour and attitudes towards food.19 Likewise, we observed that the group 20 live in families with a stricter discipline, had more difficult relationships with the father and established relationships with people diagnosed with anorexia and/or bulimia more often. These results appear to show anorexia and bulimia as illnesses triggered by circumstances.20 In our opinion, people who score high on the scale, within their system of social relationships, and consider diet changes, should be considered as a response to certain social conditions, as demonstrated by some feminist investigators.21,22
On looking at the scores obtained in the EAT-26 scale, of the people who said they were diagnosed with anorexia and/or bulimia, we observed that only one third of them exceeded the cut off point. As regards the relationships between the EAT-26, BMI and diet, the results showed that, as the scale scores increased, the BMI and the possibility of following a low calorie diet increased. These findings question the predictive value of the scale23 and indicates the need to look in detail at the relationship of high EAT scores with anorexia and bulimia.24 They demonstrate the need to open more lines of investigation that look in depth at the relationships between eating disorders and the social context in which they are produced.
What Is Known About the Subject
*Socio-cultural factors are involved in the origin of eating behavioural disorders such as, age, body image, gender, family socioeconomic level, dietary habits and sports, and the relationships within the family group and with equals.
*In Spain, epidemiological studies show a high prevalence of eating behavioural disorders among women. The prevalence indexes are basically established from the Eating Attitudes Scale.
What This Study Contributes
*The social profile of people who score more than 20 on the Eating Attitudes Scale is as follows: female, average social class, dissatisfied with their body, who practice sport with the aim of improving it and follow a low calorie diet, live in a family with strict discipline, and have conflictive relationships with the father.
*There is a relationship between high EAT scores and high body mass index scores. Further studies are required to look into the association between high EAT scores and illnesses such as anorexia nervosa and/or bulimia nervosa.
*EAT is a tool that can indicate changes in dietary patterns, but it does not indicate an underlying psychological illness.
*Lines of investigation need to be opened to look more closely at the association between dietary changes and the social context in which they are produced and to include an analysis of the gender perspective.
Correspondence: E. Gil García.
Departamento de Ciencias de la Salud. Universidad de Jaén.
Campus de las Lagunillas, s/n, edificio B-3, despacho 239. 23071 Jaén. España.
E-mail: egil@ujaen.es
Manuscript received November 16, 2005. Manuscript accepted for publication September 4, 2006.
The results presented here form part of a project financed by the Ministry of Health and Consumer Affairs Health Research Fund during 2001-2003.
Carlos III Research Institute, file No. 01/1093146.077


