array:23 [ "pii" => "S2173507722004203" "issn" => "21735077" "doi" => "10.1016/j.cireng.2022.11.011" "estado" => "S300" "fechaPublicacion" => "2023-12-01" "aid" => "2824" "copyrightAnyo" => "2022" "documento" => "simple-article" "crossmark" => 1 "subdocumento" => "crp" "cita" => "Cir Esp. 2023;101:865-7" "abierto" => array:3 [ "ES" => false "ES2" => false "LATM" => false ] "gratuito" => false "lecturas" => array:1 [ "total" => 0 ] "Traduccion" => array:1 [ "es" => array:19 [ "pii" => "S0009739X22003426" "issn" => "0009739X" "doi" => "10.1016/j.ciresp.2022.10.011" "estado" => "S300" "fechaPublicacion" => "2023-12-01" "aid" => "2824" "copyright" => "AEC" "documento" => "simple-article" "crossmark" => 1 "subdocumento" => "crp" "cita" => "Cir Esp. 2023;101:865-7" "abierto" => array:3 [ "ES" => false "ES2" => false "LATM" => false ] "gratuito" => false "lecturas" => array:1 [ "total" => 0 ] "es" => array:11 [ "idiomaDefecto" => true "cabecera" => "<span class="elsevierStyleTextfn">Carta científica</span>" "titulo" => "Estudios de rendimiento diagnóstico: interpretación del análisis ROC y de los puntos de corte" "tienePdf" => "es" "tieneTextoCompleto" => "es" "paginas" => array:1 [ 0 => array:2 [ "paginaInicial" => "865" "paginaFinal" => "867" ] ] "titulosAlternativos" => array:1 [ "en" => array:1 [ "titulo" => "Diagnostic performance studies: Interpretation of ROC analysis and cut-offs" ] ] "contieneTextoCompleto" => array:1 [ "es" => true ] "contienePdf" => array:1 [ "es" => true ] "resumenGrafico" => array:2 [ "original" => 0 "multimedia" => array:7 [ "identificador" => "fig0005" "etiqueta" => "Figura 1" "tipo" => "MULTIMEDIAFIGURA" "mostrarFloat" => true "mostrarDisplay" => false "figura" => array:1 [ 0 => array:4 [ "imagen" => "gr1.jpeg" "Alto" => 1196 "Ancho" => 1675 "Tamanyo" => 226580 ] ] "descripcion" => array:1 [ "es" => "<p id="spar0005" class="elsevierStyleSimplePara elsevierViewall">Ejemplo de curvas ROC reales con distintos rendimientos diagnósticos. El eje de abscisas se expresa como (1-especificidad) y el eje de ordenadas como (Sensibilidad). La línea recta que divide el gráfico en 2 mitades iguales representa el valor AUC de 0,5. A: 0,97, discriminación excelente. B: 0,83, discriminación moderada. C: 0,65, discriminación pobre. D: 0,52, discriminación prácticamente nula (cercana al azar).</p>" ] ] ] "autores" => array:1 [ 0 => array:2 [ "autoresLista" => "Javier Arredondo Montero, Nerea Martín-Calvo" "autores" => array:2 [ 0 => array:2 [ "nombre" => "Javier" "apellidos" => "Arredondo Montero" ] 1 => array:2 [ "nombre" => "Nerea" "apellidos" => "Martín-Calvo" ] ] ] ] ] "idiomaDefecto" => "es" "Traduccion" => array:1 [ "en" => array:9 [ "pii" => "S2173507722004203" "doi" => "10.1016/j.cireng.2022.11.011" "estado" => "S300" "subdocumento" => "" "abierto" => array:3 [ "ES" => false "ES2" => false "LATM" => false ] "gratuito" => false "lecturas" => array:1 [ "total" => 0 ] "idiomaDefecto" => "en" "EPUB" => "https://multimedia.elsevier.es/PublicationsMultimediaV1/item/epub/S2173507722004203?idApp=UINPBA00004N" ] ] "EPUB" => "https://multimedia.elsevier.es/PublicationsMultimediaV1/item/epub/S0009739X22003426?idApp=UINPBA00004N" "url" => "/0009739X/0000010100000012/v1_202312011051/S0009739X22003426/v1_202312011051/es/main.assets" ] ] "itemSiguiente" => array:18 [ "pii" => "S2173507722004288" "issn" => "21735077" "doi" => "10.1016/j.cireng.2022.12.005" "estado" => "S300" "fechaPublicacion" => "2023-12-01" "aid" => "2841" "documento" => "article" "crossmark" => 1 "subdocumento" => "crp" "cita" => "Cir Esp. 2023;101:867-9" "abierto" => array:3 [ "ES" => false "ES2" => false "LATM" => false ] "gratuito" => false "lecturas" => array:1 [ "total" => 0 ] "en" => array:11 [ "idiomaDefecto" => true "cabecera" => "<span class="elsevierStyleTextfn">Scientific letter</span>" "titulo" => "Urachal adenocarcinoma" "tienePdf" => "en" "tieneTextoCompleto" => "en" "paginas" => array:1 [ 0 => array:2 [ "paginaInicial" => "867" "paginaFinal" => "869" ] ] "titulosAlternativos" => array:1 [ "es" => array:1 [ "titulo" => "Adenocarcinoma de uraco" ] ] "contieneTextoCompleto" => array:1 [ "en" => true ] "contienePdf" => array:1 [ "en" => true ] "resumenGrafico" => array:2 [ "original" => 0 "multimedia" => array:8 [ "identificador" => "fig0010" "etiqueta" => "Fig. 2" "tipo" => "MULTIMEDIAFIGURA" "mostrarFloat" => true "mostrarDisplay" => false "figura" => array:1 [ 0 => array:4 [ "imagen" => "gr2.jpeg" "Alto" => 1108 "Ancho" => 805 "Tamanyo" => 167841 ] ] "detalles" => array:1 [ 0 => array:3 [ "identificador" => "at0065" "detalle" => "Fig. " "rol" => "short" ] ] "descripcion" => array:1 [ "en" => "<p id="spar0010" class="elsevierStyleSimplePara elsevierViewall">Intraoperative image revealing the tumor lesion (yellow arrow) dependent in the urachus (black arrow), which invades both anterior rectus muscles, while the bladder is macroscopically free.</p>" ] ] ] "autores" => array:1 [ 0 => array:2 [ "autoresLista" => "Daniel Aparicio-López, Rafael Cerdán Pascual, Sonia Cantín Blázquez, Luis Antonio Ligorred Padilla" "autores" => array:4 [ 0 => array:2 [ "nombre" => "Daniel" "apellidos" => "Aparicio-López" ] 1 => array:2 [ "nombre" => "Rafael" "apellidos" => "Cerdán Pascual" ] 2 => array:2 [ "nombre" => "Sonia" "apellidos" => "Cantín Blázquez" ] 3 => array:2 [ "nombre" => "Luis Antonio" "apellidos" => "Ligorred Padilla" ] ] ] ] ] "idiomaDefecto" => "en" "Traduccion" => array:1 [ "es" => array:9 [ "pii" => "S0009739X22003591" "doi" => "10.1016/j.ciresp.2022.11.002" "estado" => "S300" "subdocumento" => "" "abierto" => array:3 [ "ES" => false "ES2" => false "LATM" => false ] "gratuito" => false "lecturas" => array:1 [ "total" => 0 ] "idiomaDefecto" => "es" "EPUB" => "https://multimedia.elsevier.es/PublicationsMultimediaV1/item/epub/S0009739X22003591?idApp=UINPBA00004N" ] ] "EPUB" => "https://multimedia.elsevier.es/PublicationsMultimediaV1/item/epub/S2173507722004288?idApp=UINPBA00004N" "url" => "/21735077/0000010100000012/v1_202312071922/S2173507722004288/v1_202312071922/en/main.assets" ] "itemAnterior" => array:19 [ "pii" => "S2173507723001126" "issn" => "21735077" "doi" => "10.1016/j.cireng.2023.05.003" "estado" => "S300" "fechaPublicacion" => "2023-12-01" "aid" => "2908" "copyright" => "AEC" "documento" => "article" "crossmark" => 1 "subdocumento" => "sco" "cita" => "Cir Esp. 2023;101:864" "abierto" => array:3 [ "ES" => false "ES2" => false "LATM" => false ] "gratuito" => false "lecturas" => array:1 [ "total" => 0 ] "en" => array:11 [ "idiomaDefecto" => true "cabecera" => "<span class="elsevierStyleTextfn">Image of the month</span>" "titulo" => "Inferior epigastric artery pseudoaneurysm rupture associated with drain removal causing a large intrapelvic hematoma: bleeding through the drain tract" "tienePdf" => "en" "tieneTextoCompleto" => "en" "paginas" => array:1 [ 0 => array:1 [ "paginaInicial" => "864" ] ] "titulosAlternativos" => array:1 [ "es" => array:1 [ "titulo" => "Hematoma intrapélvico voluminoso por rotura de pseudoaneurisma de arteria epigástrica inferior tras retirada de drenaje abdominal: sangrado a través del trayecto del drenaje" ] ] "contieneTextoCompleto" => array:1 [ "en" => true ] "contienePdf" => array:1 [ "en" => true ] "resumenGrafico" => array:2 [ "original" => 0 "multimedia" => array:6 [ "identificador" => "fig0010" "etiqueta" => "Fig. 2" "tipo" => "MULTIMEDIAFIGURA" "mostrarFloat" => true "mostrarDisplay" => false "figura" => array:1 [ 0 => array:4 [ "imagen" => "gr2.jpeg" "Alto" => 4318 "Ancho" => 2508 "Tamanyo" => 345161 ] ] ] ] "autores" => array:1 [ 0 => array:2 [ "autoresLista" => "Luis Gorospe, Elisa Antolinos-Macho, Ana Palomera-Rico, Silvia Sánchez-Picot" "autores" => array:4 [ 0 => array:2 [ "nombre" => "Luis" "apellidos" => "Gorospe" ] 1 => array:2 [ "nombre" => "Elisa" "apellidos" => "Antolinos-Macho" ] 2 => array:2 [ "nombre" => "Ana" "apellidos" => "Palomera-Rico" ] 3 => array:2 [ "nombre" => "Silvia" "apellidos" => "Sánchez-Picot" ] ] ] ] ] "idiomaDefecto" => "en" "Traduccion" => array:1 [ "en" => array:9 [ "pii" => "S0009739X23001288" "doi" => "10.1016/j.ciresp.2023.04.002" "estado" => "S300" "subdocumento" => "" "abierto" => array:3 [ "ES" => false "ES2" => false "LATM" => false ] "gratuito" => false "lecturas" => array:1 [ "total" => 0 ] "idiomaDefecto" => "en" "EPUB" => "https://multimedia.elsevier.es/PublicationsMultimediaV1/item/epub/S0009739X23001288?idApp=UINPBA00004N" ] ] "EPUB" => "https://multimedia.elsevier.es/PublicationsMultimediaV1/item/epub/S2173507723001126?idApp=UINPBA00004N" "url" => "/21735077/0000010100000012/v1_202312071922/S2173507723001126/v1_202312071922/en/main.assets" ] "en" => array:14 [ "idiomaDefecto" => true "cabecera" => "<span class="elsevierStyleTextfn">Scientific letter</span>" "titulo" => "Diagnostic performance studies: interpretation of ROC analysis and cut-offs" "tieneTextoCompleto" => true "paginas" => array:1 [ 0 => array:2 [ "paginaInicial" => "865" "paginaFinal" => "867" ] ] "autores" => array:1 [ 0 => array:4 [ "autoresLista" => "Javier Arredondo Montero, Nerea Martín-Calvo" "autores" => array:2 [ 0 => array:4 [ "nombre" => "Javier" "apellidos" => "Arredondo Montero" "email" => array:2 [ 0 => "Javier.montero.arredondo@gmail.com" 1 => "jarredondom@alumni.unav.es" ] "referencia" => array:2 [ 0 => array:2 [ "etiqueta" => "<span class="elsevierStyleSup">a</span>" "identificador" => "aff0005" ] 1 => array:2 [ "etiqueta" => "<span class="elsevierStyleSup">*</span>" "identificador" => "cor0005" ] ] ] 1 => array:3 [ "nombre" => "Nerea" "apellidos" => "Martín-Calvo" "referencia" => array:3 [ 0 => array:2 [ "etiqueta" => "<span class="elsevierStyleSup">a</span>" "identificador" => "aff0005" ] 1 => array:2 [ "etiqueta" => "<span class="elsevierStyleSup">b</span>" "identificador" => "aff0010" ] 2 => array:2 [ "etiqueta" => "<span class="elsevierStyleSup">c</span>" "identificador" => "aff0015" ] ] ] ] "afiliaciones" => array:3 [ 0 => array:3 [ "entidad" => "Preventive Medicine and Public Health Department, School of Medicine, University of Navarra, Pamplona, Spain" "etiqueta" => "a" "identificador" => "aff0005" ] 1 => array:3 [ "entidad" => "IdiSNA, Instituto de Investigación Sanitaria de Navarra, Pamplona, Spain" "etiqueta" => "b" "identificador" => "aff0010" ] 2 => array:3 [ "entidad" => "CIBER de Fisiopatología de la Obesidad y la Nutrición, Instituto de Salud Carlos III, Madrid, Spain" "etiqueta" => "c" "identificador" => "aff0015" ] ] "correspondencia" => array:1 [ 0 => array:3 [ "identificador" => "cor0005" "etiqueta" => "⁎" "correspondencia" => "<span class="elsevierStyleItalic">Corresponding author</span>." ] ] ] ] "titulosAlternativos" => array:1 [ "es" => array:1 [ "titulo" => "Estudios de rendimiento diagnóstico: interpretación del análisis ROC y de los puntos de corte" ] ] "resumenGrafico" => array:2 [ "original" => 0 "multimedia" => array:8 [ "identificador" => "fig0005" "etiqueta" => "Fig. 1" "tipo" => "MULTIMEDIAFIGURA" "mostrarFloat" => true "mostrarDisplay" => false "figura" => array:1 [ 0 => array:4 [ "imagen" => "gr1.jpeg" "Alto" => 1196 "Ancho" => 1675 "Tamanyo" => 205596 ] ] "detalles" => array:1 [ 0 => array:3 [ "identificador" => "at0005" "detalle" => "Fig. " "rol" => "short" ] ] "descripcion" => array:1 [ "en" => "<p id="spar0005" class="elsevierStyleSimplePara elsevierViewall">Example of real ROC curves with different diagnostic performances. The x-axis represents 1-Specificity and the y-axis represents Sensitivity. The straight line that divides the graph into 2 equal halves represents the AUC value of 0.5. (A) 0.97, excellent discrimination. (B) 0.83, moderate discrimination. C: 0.65, poor discrimination. (D) 0.52, practically no discrimination (like a coin toss).</p>" ] ] ] "textoCompleto" => "<span class="elsevierStyleSections"><p id="par0005" class="elsevierStylePara elsevierViewall">Diagnosis is a fundamental part of the medical practice. Much scientific literature has been published about the implementation of new diagnostic tools, so it is essential for every clinician to know the methods used to evaluate the validity of these tools and determine their usefulness.<ul class="elsevierStyleList" id="lis0005"><li class="elsevierStyleListItem" id="lsti0005"><span class="elsevierStyleLabel">1</span><p id="par0010" class="elsevierStylePara elsevierViewall">Diagnostic performance studies: Diagnostic performance studies evaluate the ability of a clinical tool (for example, a radiological test or biomarker) to diagnose a certain pathology. These studies include:</p></li><li class="elsevierStyleListItem" id="lsti0010"><span class="elsevierStyleLabel">-</span><p id="par0015" class="elsevierStylePara elsevierViewall">A group of patients affected by a pathology</p></li><li class="elsevierStyleListItem" id="lsti0015"><span class="elsevierStyleLabel">-</span><p id="par0020" class="elsevierStylePara elsevierViewall">A group of control patients who generally have the same symptoms as the patient group. For example, in the case of studies evaluating the performance of a specific test for the diagnosis of acute appendicitis, the control group usually consists of patients with acute abdominal pain in whom the diagnosis of acute appendicitis has been ruled out.</p></li><li class="elsevierStyleListItem" id="lsti0020"><span class="elsevierStyleLabel">-</span><p id="par0025" class="elsevierStylePara elsevierViewall">A diagnostic tool for evaluation: for example, a new serum biomarker</p></li><li class="elsevierStyleListItem" id="lsti0025"><span class="elsevierStyleLabel">-</span><p id="par0030" class="elsevierStylePara elsevierViewall">A “gold standard” or reference test, which is the best existing diagnostic test for that pathology. For example, in acute appendicitis, this would be the histopathological study of the surgical specimen of the appendix. The objective of this test in this type of studies is to be used as a reference against which to compare the new tool being evaluated.</p></li><li class="elsevierStyleListItem" id="lsti0030"><span class="elsevierStyleLabel">2</span><p id="par0035" class="elsevierStylePara elsevierViewall">Description of diagnostic performance: In the evaluation of a diagnostic test, important indicators should be described:</p></li><li class="elsevierStyleListItem" id="lsti0035"><span class="elsevierStyleLabel">-</span><p id="par0040" class="elsevierStylePara elsevierViewall">Sensitivity (Se): the probability that the test will correctly classify (as positive) an individual affected by the pathology (ill or sick)</p></li><li class="elsevierStyleListItem" id="lsti0040"><span class="elsevierStyleLabel">-</span><p id="par0045" class="elsevierStylePara elsevierViewall">Specificity (Sp): the probability that the test will correctly classify (as negative) a control subject (healthy)</p></li><li class="elsevierStyleListItem" id="lsti0045"><span class="elsevierStyleLabel">-</span><p id="par0050" class="elsevierStylePara elsevierViewall">Positive predictive value (PPV): the probability that a subject has the pathology in question (ill or sick) if the test result was positive</p></li><li class="elsevierStyleListItem" id="lsti0050"><span class="elsevierStyleLabel">-</span><p id="par0055" class="elsevierStylePara elsevierViewall">Negative predictive value (NPV): the probability that a subject does not have the pathology in question (healthy) if the test result was negative.</p></li><li class="elsevierStyleListItem" id="lsti0055"><span class="elsevierStyleLabel">-</span><p id="par0060" class="elsevierStylePara elsevierViewall">
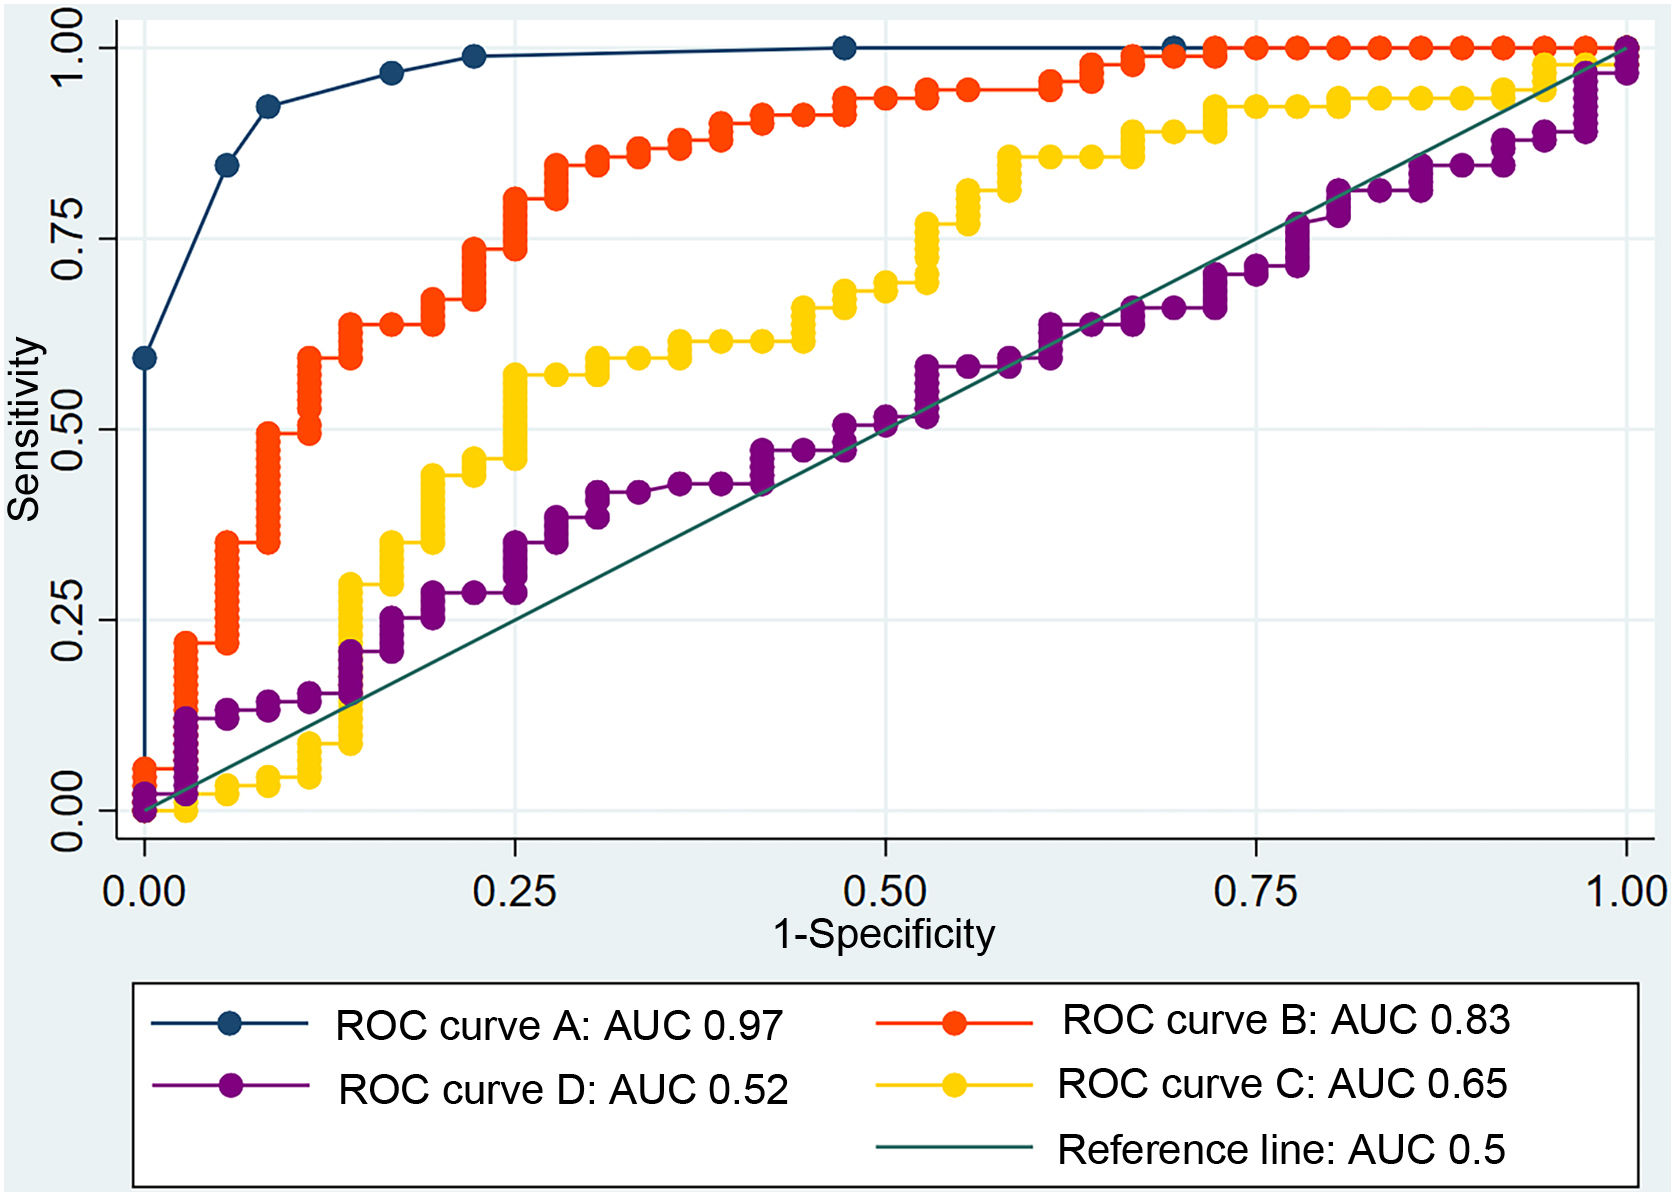
Receiver Operating Characteristic (ROC) analysis: This analysis establishes the capacity of diagnosis of a binary classification system as its discrimination treshold is varied.<a class="elsevierStyleCrossRefs" href="#bib0005"><span class="elsevierStyleSup">1,2</span></a> The result of a ROC analysis is expressed as an area under the curve (AUC), which reflects the discriminatory capacity of the diagnostic tool, meaning its ability to classify the healthy subject as healthy and the ill or sick as ill or sick. The AUC is usually expressed as a number and a confidence Interval and is usually accompanied by a graph (<a class="elsevierStyleCrossRef" href="#fig0005">Figure 1</a>).</p><elsevierMultimedia ident="fig0005"></elsevierMultimedia></li><li class="elsevierStyleListItem" id="lsti0060"><span class="elsevierStyleLabel">o</span><p id="par0065" class="elsevierStylePara elsevierViewall">AUC = 1: perfect discrimination</p></li><li class="elsevierStyleListItem" id="lsti0065"><span class="elsevierStyleLabel">o</span><p id="par0070" class="elsevierStylePara elsevierViewall">AUC ≥ 0.9: excellent discrimination</p></li><li class="elsevierStyleListItem" id="lsti0070"><span class="elsevierStyleLabel">o</span><p id="par0075" class="elsevierStylePara elsevierViewall">0.7 ≤ AUC < 0.9: moderate discrimination</p></li><li class="elsevierStyleListItem" id="lsti0075"><span class="elsevierStyleLabel">o</span><p id="par0080" class="elsevierStylePara elsevierViewall">0.5 < AUC < 0.7: poor discrimination</p></li></ul></p><p id="par0085" class="elsevierStylePara elsevierViewall">An AUC of 0.5 is considered a non-useful test for diagnosis, since the probability of it correctly classifying patients is the same as a coin toss. An AUC value of less than 0.5 indicates that the diagnostic criterion should be inverted. <ul class="elsevierStyleList" id="lis0010"><li class="elsevierStyleListItem" id="lsti0080"><span class="elsevierStyleLabel">3</span><p id="par0090" class="elsevierStylePara elsevierViewall">The importance of disease prevalence: Se and Sp are intrinsic characteristics of a diagnostic test, but the predictive values depend on the prevalence of the disease in the population in which this test is applied. The same diagnostic tool will have a greater PPV if it is applied to a population where the prevalence of the disease is high than if it is applied in a population where the prevalence is low. Contrarily, the NPV decreases if the prevalence of the disease increases. In diagnostic performance studies, we can find different PPV and NPV for the same diagnostic tool when applied to different populations, depending on the prevalence of the disease in each population.<a class="elsevierStyleCrossRef" href="#bib0015"><span class="elsevierStyleSup">3</span></a></p></li><li class="elsevierStyleListItem" id="lsti0085"><span class="elsevierStyleLabel">4</span><p id="par0095" class="elsevierStylePara elsevierViewall">The cut-off point: when a diagnostic tool is presented as a continuous variable, the cut-off point refers to the value chosen to classify the subjects as healthy or ill or sick. The cut-off point with the best discriminatory capacity is closest to the upper left corner of the ROC. There are different methods for its calculation<a class="elsevierStyleCrossRefs" href="#bib0020"><span class="elsevierStyleSup">4,5</span></a>:</p></li><li class="elsevierStyleListItem" id="lsti0090"><span class="elsevierStyleLabel">-</span><p id="par0100" class="elsevierStylePara elsevierViewall">Cut-off point with the greatest Youden Index (Sensitivity + Specificity − 1)</p></li><li class="elsevierStyleListItem" id="lsti0095"><span class="elsevierStyleLabel">-</span><p id="par0105" class="elsevierStylePara elsevierViewall">Cut-off point with the lowest value for the formula: (1−sensitivity)<span class="elsevierStyleSup">2</span> + (1−specificity)<span class="elsevierStyleSup">2</span></p></li></ul></p><p id="par0110" class="elsevierStylePara elsevierViewall">With the cut-off point, we can calculate the Se, Sp, and predictive values of the diagnostic tool in a table that compares the results of our test with those of the standard reference. The cut-off point with the best discrimination capacity is usually chosen, but it may also be interesting to evaluate other cut-off points, such as the most sensitive (in severe pathologies) or the most specific (in pathologies whose treatment entails important adverse effects).</p><p id="par0115" class="elsevierStylePara elsevierViewall">Strengths and limitations: ROC analysis is able to evaluate the discriminatory capacity of a diagnostic tool and compare it with others in a simple and graphic manner. Its limitations include the need for a gold standard against which the new tool can be compared and and the difficulty to generalize the results (cut-off points, sensitivity and specificity) to other populations (<a class="elsevierStyleCrossRef" href="#fig0005">Fig. 1</a>).</p><span id="sec0005" class="elsevierStyleSection elsevierViewall"><span class="elsevierStyleSectionTitle" id="sect0005">Contributions of the authors</span><p id="par0120" class="elsevierStylePara elsevierViewall">All the authors have made substantial contributions, both directly and intellectually, to the manuscript and have approved the final version for publication.</p></span><span id="sec0010" class="elsevierStyleSection elsevierViewall"><span class="elsevierStyleSectionTitle" id="sect0010">Original paper</span><p id="par0125" class="elsevierStylePara elsevierViewall">All of the authors of this manuscript declare that this is an original contribution that has not been previously published.</p></span><span id="sec0015" class="elsevierStyleSection elsevierViewall"><span class="elsevierStyleSectionTitle" id="sect0015">Conflict of interest</span><p id="par0130" class="elsevierStylePara elsevierViewall">The authors have no conflicts of interest to declare, nor any external sources of funding.</p></span></span>" "textoCompletoSecciones" => array:1 [ "secciones" => array:4 [ 0 => array:2 [ "identificador" => "sec0005" "titulo" => "Contributions of the authors" ] 1 => array:2 [ "identificador" => "sec0010" "titulo" => "Original paper" ] 2 => array:2 [ "identificador" => "sec0015" "titulo" => "Conflict of interest" ] 3 => array:1 [ "titulo" => "References" ] ] ] "pdfFichero" => "main.pdf" "tienePdf" => true "multimedia" => array:1 [ 0 => array:8 [ "identificador" => "fig0005" "etiqueta" => "Fig. 1" "tipo" => "MULTIMEDIAFIGURA" "mostrarFloat" => true "mostrarDisplay" => false "figura" => array:1 [ 0 => array:4 [ "imagen" => "gr1.jpeg" "Alto" => 1196 "Ancho" => 1675 "Tamanyo" => 205596 ] ] "detalles" => array:1 [ 0 => array:3 [ "identificador" => "at0005" "detalle" => "Fig. " "rol" => "short" ] ] "descripcion" => array:1 [ "en" => "<p id="spar0005" class="elsevierStyleSimplePara elsevierViewall">Example of real ROC curves with different diagnostic performances. The x-axis represents 1-Specificity and the y-axis represents Sensitivity. The straight line that divides the graph into 2 equal halves represents the AUC value of 0.5. (A) 0.97, excellent discrimination. (B) 0.83, moderate discrimination. C: 0.65, poor discrimination. (D) 0.52, practically no discrimination (like a coin toss).</p>" ] ] ] "bibliografia" => array:2 [ "titulo" => "References" "seccion" => array:1 [ 0 => array:2 [ "identificador" => "bibs0005" "bibliografiaReferencia" => array:5 [ 0 => array:3 [ "identificador" => "bib0005" "etiqueta" => "1" "referencia" => array:1 [ 0 => array:2 [ "contribucion" => array:1 [ 0 => array:2 [ "titulo" => "Understanding diagnostic tests - Part 3: receiver operating characteristic curves" "autores" => array:1 [ 0 => array:2 [ "etal" => false "autores" => array:2 [ 0 => "R. Aggarwal" 1 => "P. Ranganathan" ] ] ] ] ] "host" => array:1 [ 0 => array:2 [ "doi" => "10.4103/picr.PICR_87_18" "Revista" => array:7 [ "tituloSerie" => "Perspect Clin Res." "fecha" => "2018" "volumen" => "9" "numero" => "3" "paginaInicial" => "145" "paginaFinal" => "148" "link" => array:1 [ 0 => array:2 [ "url" => "https://www.ncbi.nlm.nih.gov/pubmed/30090714" "web" => "Medline" ] ] ] ] ] ] ] ] 1 => array:3 [ "identificador" => "bib0010" "etiqueta" => "2" "referencia" => array:1 [ 0 => array:2 [ "contribucion" => array:1 [ 0 => array:2 [ "titulo" => "Receiver-operating characteristic analysis for evaluating diagnostic tests and predictive models" "autores" => array:1 [ 0 => array:2 [ "etal" => false "autores" => array:3 [ 0 => "K.H. Zou" 1 => "A.J. O’Malley" 2 => "L. Mauri" ] ] ] ] ] "host" => array:1 [ 0 => array:2 [ "doi" => "10.1161/CIRCULATIONAHA.105.594929" "Revista" => array:6 [ "tituloSerie" => "Circulation." "fecha" => "2007" "volumen" => "115" "numero" => "5" "paginaInicial" => "654" "paginaFinal" => "657" ] ] ] ] ] ] 2 => array:3 [ "identificador" => "bib0015" "etiqueta" => "3" "referencia" => array:1 [ 0 => array:2 [ "contribucion" => array:1 [ 0 => array:2 [ "titulo" => "Diagnostic performance of calprotectin and APPY-1 test in pediatric acute appendicitis: a systematic review and a meta-analysis" "autores" => array:1 [ 0 => array:2 [ "etal" => false "autores" => array:6 [ 0 => "J. Arredondo Montero" 1 => "C. Bardají Pascual" 2 => "G. Antona" 3 => "M. Bronte Anaut" 4 => "N. López-Andrés" 5 => "N. Martín-Calvo" ] ] ] ] ] "host" => array:1 [ 0 => array:2 [ "doi" => "10.1007/s00068-022-02000-2" "Revista" => array:2 [ "tituloSerie" => "Eur J Trauma Emerg Surg." "fecha" => "2022" ] ] ] ] ] ] 3 => array:3 [ "identificador" => "bib0020" "etiqueta" => "4" "referencia" => array:1 [ 0 => array:2 [ "contribucion" => array:1 [ 0 => array:2 [ "titulo" => "Index for rating diagnostic tests" "autores" => array:1 [ 0 => array:2 [ "etal" => false "autores" => array:1 [ 0 => "W.J. Youden" ] ] ] ] ] "host" => array:1 [ 0 => array:2 [ "doi" => "10.1186/1471-2407-3-32" "Revista" => array:7 [ "tituloSerie" => "Cancer." "fecha" => "1950" "volumen" => "3" "numero" => "1" "paginaInicial" => "32" "paginaFinal" => "35" "link" => array:1 [ 0 => array:2 [ "url" => "https://www.ncbi.nlm.nih.gov/pubmed/14678564" "web" => "Medline" ] ] ] ] ] ] ] ] 4 => array:3 [ "identificador" => "bib0025" "etiqueta" => "5" "referencia" => array:1 [ 0 => array:2 [ "contribucion" => array:1 [ 0 => array:2 [ "titulo" => "Discriminatory capacity of serum interleukin-6 between complicated and uncomplicated acute appendicitis in children: a prospective validation study" "autores" => array:1 [ 0 => array:2 [ "etal" => true "autores" => array:6 [ 0 => "J. Arredondo Montero" 1 => "G. Antona" 2 => "A. Rivero Marcotegui" 3 => "C. Bardají Pascual" 4 => "M. Bronte Anaut" 5 => "R. Ros Briones" ] ] ] ] ] "host" => array:1 [ 0 => array:2 [ "doi" => "10.1007/s12519-022-00598-2" "Revista" => array:7 [ "tituloSerie" => "World J Pediatr" "fecha" => "2022" "volumen" => "18" "numero" => "12" "paginaInicial" => "810" "paginaFinal" => "817" "link" => array:1 [ 0 => array:2 [ "url" => "https://www.ncbi.nlm.nih.gov/pubmed/36114365" "web" => "Medline" ] ] ] ] ] ] ] ] ] ] ] ] ] "idiomaDefecto" => "en" "url" => "/21735077/0000010100000012/v1_202312071922/S2173507722004203/v1_202312071922/en/main.assets" "Apartado" => array:4 [ "identificador" => "24081" "tipo" => "SECCION" "en" => array:2 [ "titulo" => "Scientific letter" "idiomaDefecto" => true ] "idiomaDefecto" => "en" ] "PDF" => "https://static.elsevier.es/multimedia/21735077/0000010100000012/v1_202312071922/S2173507722004203/v1_202312071922/en/main.pdf?idApp=UINPBA00004N&text.app=https://www.elsevier.es/" "EPUB" => "https://multimedia.elsevier.es/PublicationsMultimediaV1/item/epub/S2173507722004203?idApp=UINPBA00004N" ]
Journal Information
Vol. 101. Issue 12.
Pages 865-867 (December 2023)
Share
Download PDF
More article options
Vol. 101. Issue 12.
Pages 865-867 (December 2023)
Scientific letter
Diagnostic performance studies: interpretation of ROC analysis and cut-offs
Estudios de rendimiento diagnóstico: interpretación del análisis ROC y de los puntos de corte
Visits
2
This item has received
Article information
These are the options to access the full texts of the publication Cirugía Española (English Edition)
Subscriber
Subscribe
Purchase
Contact
Phone for subscriptions and reporting of errors
From Monday to Friday from 9 a.m. to 6 p.m. (GMT + 1) except for the months of July and August which will be from 9 a.m. to 3 p.m.
Calls from Spain
932 415 960
Calls from outside Spain
+34 932 415 960
E-mail