


Comprehensive assessment of pharmacotherapy effects on atherogenic parameters (AP) that influence the risk of cardiovascular disease (CVD) is challenging due to interactions among a large number of parameters that modulate CVD risk.
MethodsWe developed an illustrative tool, athero-contour (AC), which incorporates weighted key lipid, lipo- and glycoprotein parameters, to readily illustrate their overall changes following pharmacotherapy. We demonstrate the applicability of AC to assess changes in AP in response to saroglitazar treatment in patients with metabolic associated fatty liver disease (MAFLD) in the EVIDENCES IV study.
ResultsThe baseline AC of saroglitazar and placebo groups was worse than the mean of the general population. After 16-week treatment, AC improved significantly in the saroglitazar group due to alterations in very low-density lipoprotein, triglyceride, and glycoproteins.
ConclusionUsing AC, we could readily and globally evaluate and visualize changes in AP. AC improved in patients with MAFLD following saroglitazar therapy.
La evaluación global de la farmacoterapia en relación con los efectos moleculares que influyen en el riesgo de enfermedad cardiovascular (ECV) supone un desafío complejo asociado a la naturaleza e interacción entre los parámetros que modulan el riesgo de ECV.
MétodosDesarrollamos una herramienta ilustrativa, la atero-silueta (AS), que incorpora parámetros ponderados lipídicos, lipo- y glicoproteicos, para ilustrar de manera sencilla sus cambios generales después de la farmacoterapia. Demostramos la aplicabilidad de la AS para evaluar cambios moleculares en respuesta al tratamiento con saroglitazar en pacientes con enfermedad del hígado graso metabólico (MAFLD) en el estudio EVIDENCES IV.
ResultadosLa AS de los grupos de estudio, tanto de intervención como de placebo, era inicialmente más proaterogénica que la media de la población general con un perfil lipoproteico e inflamatorio asociado a mayor riesgo de ECV. Después de 16 semanas de tratamiento, la AS mejoró significativamente en el grupo de intervención con saroglitazar debido principalmente a modificaciones de las lipoproteínas de muy baja densidad, triglicéridos y glicoproteínas.
ConclusiónUtilizando la AS, pudimos evaluar y visualizar fácilmente y de manera global los cambios moleculares asociados a riesgo de ECV. La AS mejoró en los pacientes con MAFLD después de la terapia con saroglitazar.
Atherogenic dyslipidemia (AD) is a strong risk factor for cardiovascular disease (CVD). It is characterized by increased triglyceride (TG), small dense low-density lipoprotein (LDL) particles, very low-density lipoprotein (VLDL), and decreased high-density lipoprotein cholesterol (HDL-C).1,2 AD is driven by insulin resistance, and is prevalent in patients with some cardiometabolic disease, such as diabetes, obesity, polycystic ovary syndrome, or metabolic associated fatty liver disease (MAFLD).3
LDL-C levels are not necessarily increased in AD. The accumulation of cholesterol in the arteries even when circulating LDL-C levels are within the normal range, can be attributed to other Apo-B containing lipoproteins that also transport cholesterol. This phenomenon is likely due to triglyceride-rich lipoproteins (TRLs) and to physical or compositional characteristics of LDL that make it prone to arterial infiltration and retention even at normal concentrations. Conditions such as MAFLD, diabetes, obesity, or insulin resistance result in an increased flux of free fatty acids which, in turn, promotes hepatic overproduction of triglyceride-rich lipoproteins in the form of large VLDL, causing moderate hypertriglyceridemia. TRLs are rapidly hydrolyzed and transformed into smaller particles, named remnant particles, that can be cleared by the liver or further metabolized into IDL (intermediate-density lipoprotein) and LDL. The CETP (cholesteryl ester transfer protein)-mediated exchange of neutral lipids between TRLs and LDL and HDL (high-density lipoprotein) results in smaller and more atherogenic LDL particles, as well as dysfunctional TG-enriched LDL and HDL particles. The higher number of total Apo-B containing circulating lipoproteins, increased remnant cholesterol, and the presence of small and dysfunctional LDL and HDL particles constitute an altered lipoprotein profile associated with atherogenicity beyond LDL-C.
On the other hand, elevated plasma TG, VLDL, and increased small dense LDL particles not only promote the formation of atherosclerotic plaque, but also activate Toll-like receptors, resulting in a cascade of inflammation, endothelial cell damage, and consequent cardiovascular diseases.3 In addition to AD, other atherogenic parameters (AP), such as TG-rich remnant lipoproteins, small HDL particles, glycoprotein A, and multiple metabolites are associated with CVD.4,5
Although the numbers, sizes, and TG contents of lipoprotein subclasses, as well as glycoproteins and metabolites, are not measured routinely in clinical practice, they can be efficiently and simultaneously assessed by nuclear magnetic resonance (NMR).6 NMR provides an excellent technique for profiling biofluids and is especially adept at characterizing complex solutions. In metabolic research, NMR spectroscopy allows a comprehensive metabolic profiling associated with different metabolic conditions and inflammation: from small molecules (known as the aqueous metabolome) to large macromolecular complexes (advanced lipoprotein testing based on NMR technology and NMR glycoprotein profiling) from minimally-prepared plasma or serum.6,7
Recently, the glycoprotein profile assessed by using NMR has shown to be independently associated with CVD, particularly the residual risk of CVD and death in patients treated to low levels of LDL cholesterol.5,8 However, the complexity of working with large number of lipoprotein, glycoprotein parameters and metabolites yielded by NMR, as well as understanding the interaction between them, hampers the evaluation of AP in the setting of metabolic disease like MAFLD, or assessment of its changes after pharmacotherapy.
Here, we developed a novel illustrative approach named athero-contour (AC) for atherosclerosis profile (AP) evaluation. This method incorporates weighted key characteristics of lipids, lipoproteins, and glycoproteins to represent and readily visualize the overall molecular situation of the patient. Furthermore, we have tested the use of AC to monitor changes in the lipoprotein and inflammatory profile associated with a specific drug for MAFLD patients, saroglitazar. These changes are simultaneously associated with the improvement of cardiovascular risk, marking a beneficial effect beyond liver disease. Saroglitazar is a dual peroxisome proliferator-activated receptor-α/γ agonist that concurrently improves liver disease, dyslipidemia, and type 2 diabetes. This was observed in the context of the Phase 2 EVIDENCES IV Clinical Trial for Saroglitazar Magnesium (Clinical Study ID Number: NCT03061721).
Material and methodsStudy populationThe EVIDENCES IV study was a randomized placebo-controlled trial to evaluate the safety and efficacy of saroglitazar in patients with MAFLD/MASH. Its design, methods, and results were previously published.9 Briefly, 106 adults with MAFLD and persistently elevated ALT (≥50U/L) were randomized to receive saroglitazar (1mg, 2mg, and 4mg) and placebo for 16 weeks. The primary efficacy endpoint was the percentage change in serum ALT levels. Subsequent ancillary studies, including this study, on archived biosamples, were permitted under the original informed consent that participants provided before enrollment in EVIDENCES IV. Since saroglitazar 4mg dose was associated with the most significant improvement in ALT and liver fat reduction, we used nuclear magnetic resonance (NMR) profiles from this group (n=23) and that of the placebo group (n=24) to apply ACs for evaluation of changes in AP before and after pharmacologic intervention.
Lipoprotein and glycoprotein analysis by NMR spectroscopyFrozen serum samples (250μL) were used for analysis of lipoprotein profile by the NMR-based Liposcale® test at Biosfer Teslab (Reus, Spain). Lipid (i.e. TG and cholesterol) concentrations, size and particle number of the four main classes of lipoproteins [intermediate-density lipoprotein (IDL), VLDL, LDL, and HDL], and particle number of nine subclasses (large, medium and small VLDL, LDL, and HDL) were determined as previously reported.6
From the same NMR spectra, we obtained a general measurement of circulating glycoproteins (Glyc) A and B by deconvoluting with analytical functions the specific region where glycoproteins resonate. For each function, we determined total area (proportional to concentration), height, position and bandwidth. Height-to-width ratios (H/W) of Glyc-A and Glyc-B were also reported.7
Athero-contour representationThe number and nature of lipoprotein and inflammatory NMR parameters associated with atherogenicity are elevated and highly intertwined. Therefore, identifying a single isolated risk biomarker may not be as meaningful for CVD risk identification. For this reason, we sought to identify complex profiles linked to increased atherogenicity by combining well-established lipoprotein and inflammatory parameters through the development of the athero-contour (AC). The AC is a novel illustrative approach that includes a set of 12 key variables from the NMR profiling associated with CVD risk (see Fig. 1). This allows for a quick and comprehensive assessment of a patient's advanced lipoprotein and glycoprotein profiles.

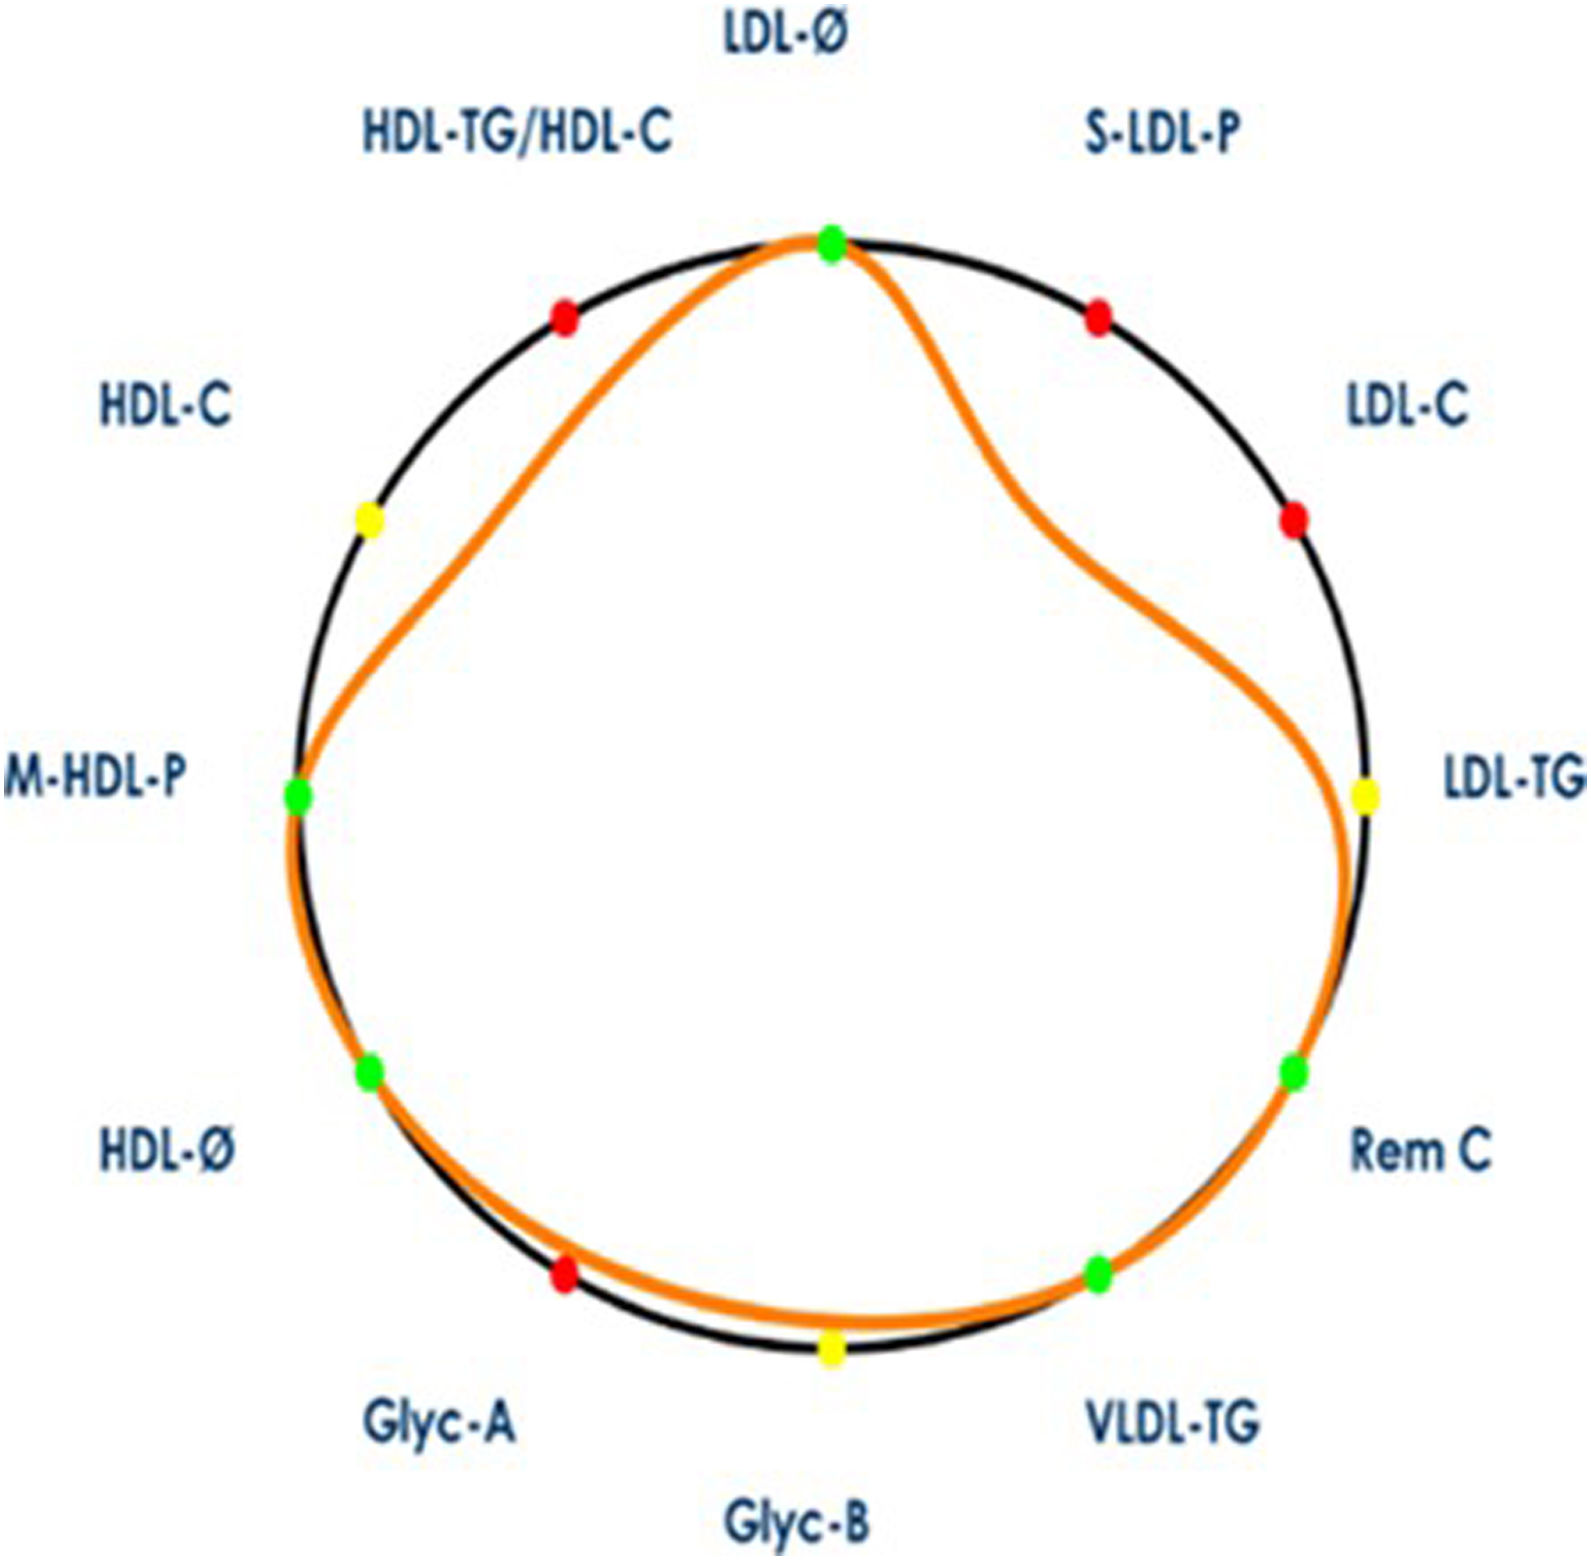
Illustration of arterial contour. The arterial contour represents the patient's profile (orange contour) with respect to mean values from a general population, represented by a black circle. The area defined by the patient's arterial contour decreases when its profile is associated with higher cardiovascular risk (i.e. values higher than the reference population's mean for VLDL-C, VLDL-TG, VLDL-P, LDL-C, LDL-TG, S-LDL-P, HDL-TG variables; or lower than reference population's mean for LDL-Z, HDL-Z and M-HDL-P variables). Variables contributing to a decrease in the arterial contour area are marked in red, while variables that contribute to an increase in the arterial contour area are marked in green. Variables whose values are close to the reference population's mean appear in yellow. LDL-C, low-density lipoprotein cholesterol; LDL-TG, LDL triglycerides; S-LDL-P, small LDL particles; LDL-Ø, LDL particle size; HDL-C, high-density lipoprotein cholesterol; HDL-TG, HDL triglycerides; M-HDL-P, medium HDL particles; HDL-Ø, HDL particle size; VLDL-C, very low-density lipoprotein cholesterol; VLDL-TG, VLDL triglycerides; VLDL-P, VLDL particles; Remnant-C remnant cholesterol; Glyc-A, N-acetyl-glucosamine/-galactosamine protein bonds; Glyc-B, N-acetyl-neuraminic acid protein bonds.
AC could represent a patient or group's profile (orange contour) with respect to mean values from a general population, represented by a black circle, using the same methodological approach and NMR equipment. Specifically, the lipoprotein and glycoprotein profiles were compared with the general population values from a total of 6022 individuals across two Spanish cohorts: the Di@bet.es Study9 and the Mollerussa Study.10 These are population-based Spanish cohorts comprising individuals aged 18 years and older, with a composition of 55% women.
The mathematical entity used to account for how the set of the patient's variables in relation to the general population values is the geometric mean, equivalent to the volume of the multidimensional object of the 12 selected variables.
The multidimensional volume defined by the patient's AC decreases when its profile is associated with higher CVD risk (i.e. values higher than the reference population's mean for VLDL-TG, Rem C, LDL-C, LDL-TG, S-LDL-P, HDL-TG/HDL-C, Glyc-A, Glyc-B; or lower than reference population's mean for LDL-Z, HDL-Z, HDL-C and M-HDL-P variables). Variables contributing to a decrease in AC volume are marked in red, while variables that contribute to an increase in AC volume are marked in green. Variables whose values are close to the reference population's mean appear in yellow.
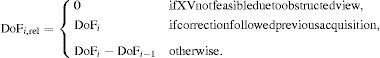
We defined the AC volume as:
for i=VLDL-TG, Rem C, LDL-C, LDL-TG, S-LDL-P, HDL-TG/HDL-C, Glyc-A, Glyc-B:for j=LDL-Z, HDL-Z, HDL-C and M-HDL-P

We then compared the group mean volume changes before and after the treatment for both placebo and saroglitazar-treated individuals.
Statistical analysisStatistical analysis was performed using MATLAB, Ver. 7.10.0. Means (SD) of the lipoprotein and glycoprotein variables and the AC volume changes (in percentage) for each group were reported and compared by parametric t-test. p value <0.05 was considered statistically significant.
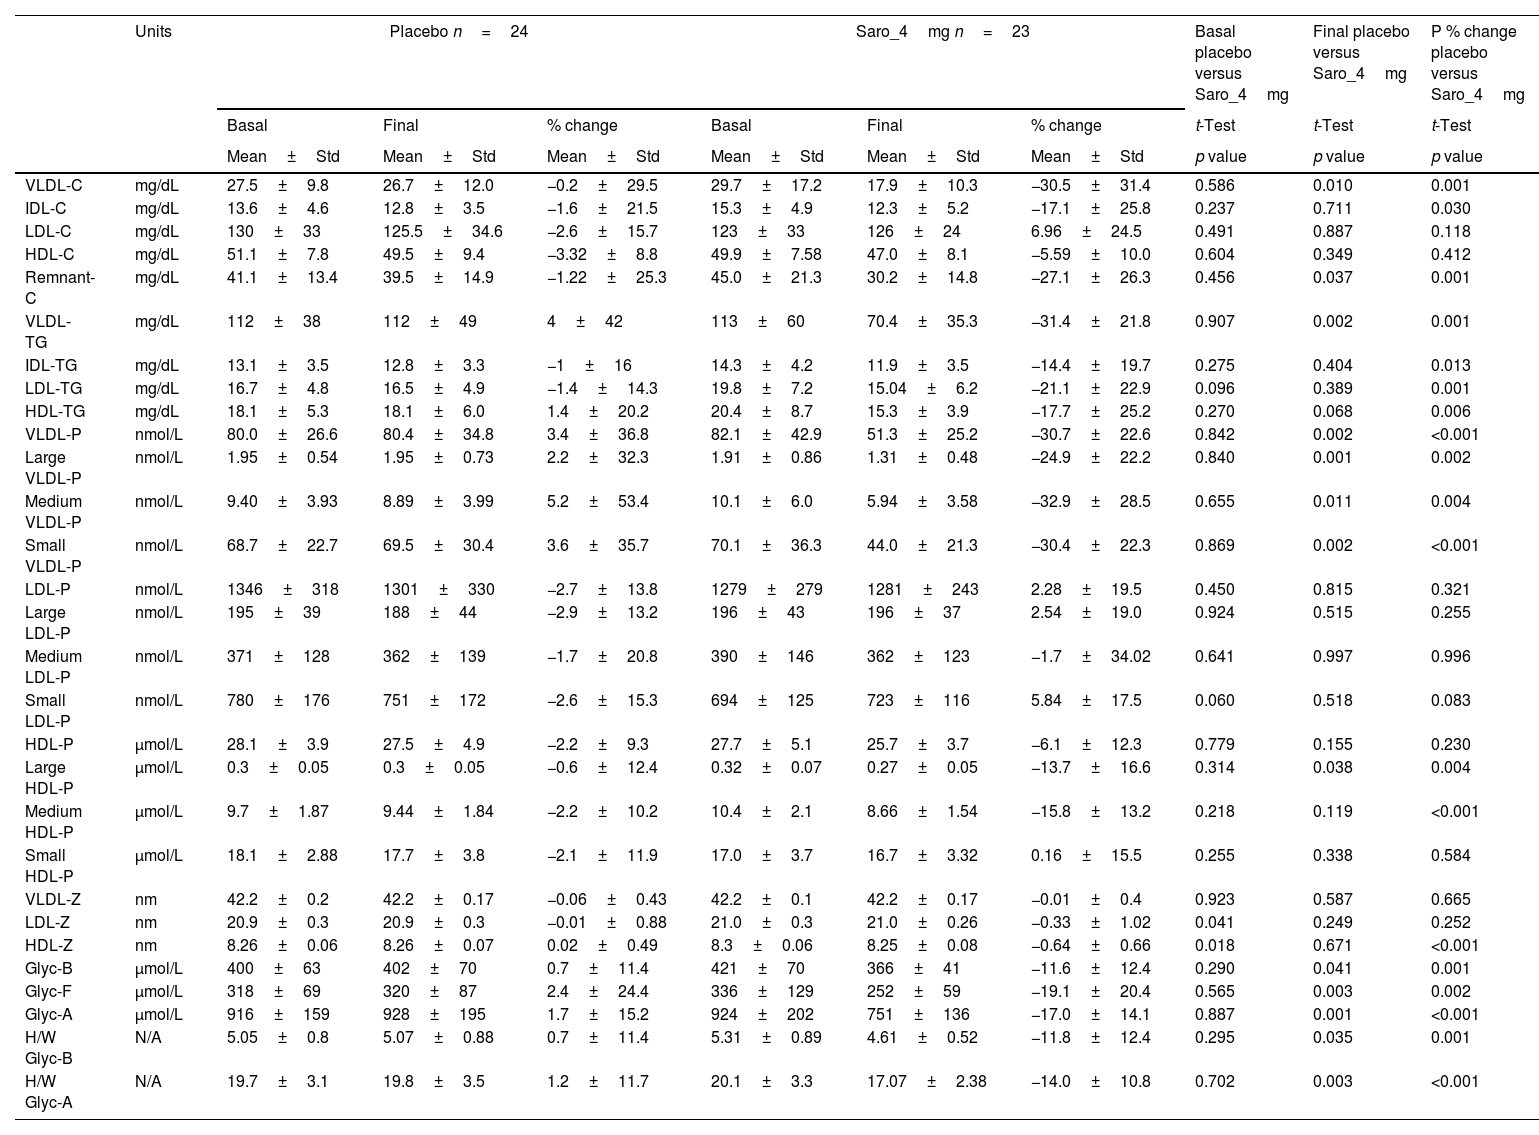
ResultsA total of 47 participants was included in this study, 23 in the saroglitazar group and 24 in the placebo group. Baseline demographic characteristics were comparable between both groups, as reported previously.11 Baseline lipids, lipo- and glycoprotein levels and parameters were not significantly different between the two groups (Table 1). However, post-treatment mean levels of remnant-C, VLDL-C, VLDL-TG, VLDL particles (large, medium, and small) and large HDL particles, Glyc-B, Glyc-F, Glyc-A and H/W Glyc-B, and H/W Glyc-A were significantly lower in the saroglitazar-treated group versus the placebo group.
NMR lipoprotein and glycoprotein profile: mean basal, final and % change of the variables for the intervention and the placebo groups.
| Units | Placebo n=24 | Saro_4mg n=23 | Basal placebo versus Saro_4mg | Final placebo versus Saro_4mg | P % change placebo versus Saro_4mg | |||||
|---|---|---|---|---|---|---|---|---|---|---|
| Basal | Final | % change | Basal | Final | % change | t-Test | t-Test | t-Test | ||
| Mean±Std | Mean±Std | Mean±Std | Mean±Std | Mean±Std | Mean±Std | p value | p value | p value | ||
| VLDL-C | mg/dL | 27.5±9.8 | 26.7±12.0 | −0.2±29.5 | 29.7±17.2 | 17.9±10.3 | −30.5±31.4 | 0.586 | 0.010 | 0.001 |
| IDL-C | mg/dL | 13.6±4.6 | 12.8±3.5 | −1.6±21.5 | 15.3±4.9 | 12.3±5.2 | −17.1±25.8 | 0.237 | 0.711 | 0.030 |
| LDL-C | mg/dL | 130±33 | 125.5±34.6 | −2.6±15.7 | 123±33 | 126±24 | 6.96±24.5 | 0.491 | 0.887 | 0.118 |
| HDL-C | mg/dL | 51.1±7.8 | 49.5±9.4 | −3.32±8.8 | 49.9±7.58 | 47.0±8.1 | −5.59±10.0 | 0.604 | 0.349 | 0.412 |
| Remnant-C | mg/dL | 41.1±13.4 | 39.5±14.9 | −1.22±25.3 | 45.0±21.3 | 30.2±14.8 | −27.1±26.3 | 0.456 | 0.037 | 0.001 |
| VLDL-TG | mg/dL | 112±38 | 112±49 | 4±42 | 113±60 | 70.4±35.3 | −31.4±21.8 | 0.907 | 0.002 | 0.001 |
| IDL-TG | mg/dL | 13.1±3.5 | 12.8±3.3 | −1±16 | 14.3±4.2 | 11.9±3.5 | −14.4±19.7 | 0.275 | 0.404 | 0.013 |
| LDL-TG | mg/dL | 16.7±4.8 | 16.5±4.9 | −1.4±14.3 | 19.8±7.2 | 15.04±6.2 | −21.1±22.9 | 0.096 | 0.389 | 0.001 |
| HDL-TG | mg/dL | 18.1±5.3 | 18.1±6.0 | 1.4±20.2 | 20.4±8.7 | 15.3±3.9 | −17.7±25.2 | 0.270 | 0.068 | 0.006 |
| VLDL-P | nmol/L | 80.0±26.6 | 80.4±34.8 | 3.4±36.8 | 82.1±42.9 | 51.3±25.2 | −30.7±22.6 | 0.842 | 0.002 | <0.001 |
| Large VLDL-P | nmol/L | 1.95±0.54 | 1.95±0.73 | 2.2±32.3 | 1.91±0.86 | 1.31±0.48 | −24.9±22.2 | 0.840 | 0.001 | 0.002 |
| Medium VLDL-P | nmol/L | 9.40±3.93 | 8.89±3.99 | 5.2±53.4 | 10.1±6.0 | 5.94±3.58 | −32.9±28.5 | 0.655 | 0.011 | 0.004 |
| Small VLDL-P | nmol/L | 68.7±22.7 | 69.5±30.4 | 3.6±35.7 | 70.1±36.3 | 44.0±21.3 | −30.4±22.3 | 0.869 | 0.002 | <0.001 |
| LDL-P | nmol/L | 1346±318 | 1301±330 | −2.7±13.8 | 1279±279 | 1281±243 | 2.28±19.5 | 0.450 | 0.815 | 0.321 |
| Large LDL-P | nmol/L | 195±39 | 188±44 | −2.9±13.2 | 196±43 | 196±37 | 2.54±19.0 | 0.924 | 0.515 | 0.255 |
| Medium LDL-P | nmol/L | 371±128 | 362±139 | −1.7±20.8 | 390±146 | 362±123 | −1.7±34.02 | 0.641 | 0.997 | 0.996 |
| Small LDL-P | nmol/L | 780±176 | 751±172 | −2.6±15.3 | 694±125 | 723±116 | 5.84±17.5 | 0.060 | 0.518 | 0.083 |
| HDL-P | μmol/L | 28.1±3.9 | 27.5±4.9 | −2.2±9.3 | 27.7±5.1 | 25.7±3.7 | −6.1±12.3 | 0.779 | 0.155 | 0.230 |
| Large HDL-P | μmol/L | 0.3±0.05 | 0.3±0.05 | −0.6±12.4 | 0.32±0.07 | 0.27±0.05 | −13.7±16.6 | 0.314 | 0.038 | 0.004 |
| Medium HDL-P | μmol/L | 9.7±1.87 | 9.44±1.84 | −2.2±10.2 | 10.4±2.1 | 8.66±1.54 | −15.8±13.2 | 0.218 | 0.119 | <0.001 |
| Small HDL-P | μmol/L | 18.1±2.88 | 17.7±3.8 | −2.1±11.9 | 17.0±3.7 | 16.7±3.32 | 0.16±15.5 | 0.255 | 0.338 | 0.584 |
| VLDL-Z | nm | 42.2±0.2 | 42.2±0.17 | −0.06±0.43 | 42.2±0.1 | 42.2±0.17 | −0.01±0.4 | 0.923 | 0.587 | 0.665 |
| LDL-Z | nm | 20.9±0.3 | 20.9±0.3 | −0.01±0.88 | 21.0±0.3 | 21.0±0.26 | −0.33±1.02 | 0.041 | 0.249 | 0.252 |
| HDL-Z | nm | 8.26±0.06 | 8.26±0.07 | 0.02±0.49 | 8.3±0.06 | 8.25±0.08 | −0.64±0.66 | 0.018 | 0.671 | <0.001 |
| Glyc-B | μmol/L | 400±63 | 402±70 | 0.7±11.4 | 421±70 | 366±41 | −11.6±12.4 | 0.290 | 0.041 | 0.001 |
| Glyc-F | μmol/L | 318±69 | 320±87 | 2.4±24.4 | 336±129 | 252±59 | −19.1±20.4 | 0.565 | 0.003 | 0.002 |
| Glyc-A | μmol/L | 916±159 | 928±195 | 1.7±15.2 | 924±202 | 751±136 | −17.0±14.1 | 0.887 | 0.001 | <0.001 |
| H/W Glyc-B | N/A | 5.05±0.8 | 5.07±0.88 | 0.7±11.4 | 5.31±0.89 | 4.61±0.52 | −11.8±12.4 | 0.295 | 0.035 | 0.001 |
| H/W Glyc-A | N/A | 19.7±3.1 | 19.8±3.5 | 1.2±11.7 | 20.1±3.3 | 17.07±2.38 | −14.0±10.8 | 0.702 | 0.003 | <0.001 |
More significant percentage decreases were observed in the saroglitazar group in multiple lipo- and glycoprotein parameters (Table 1).
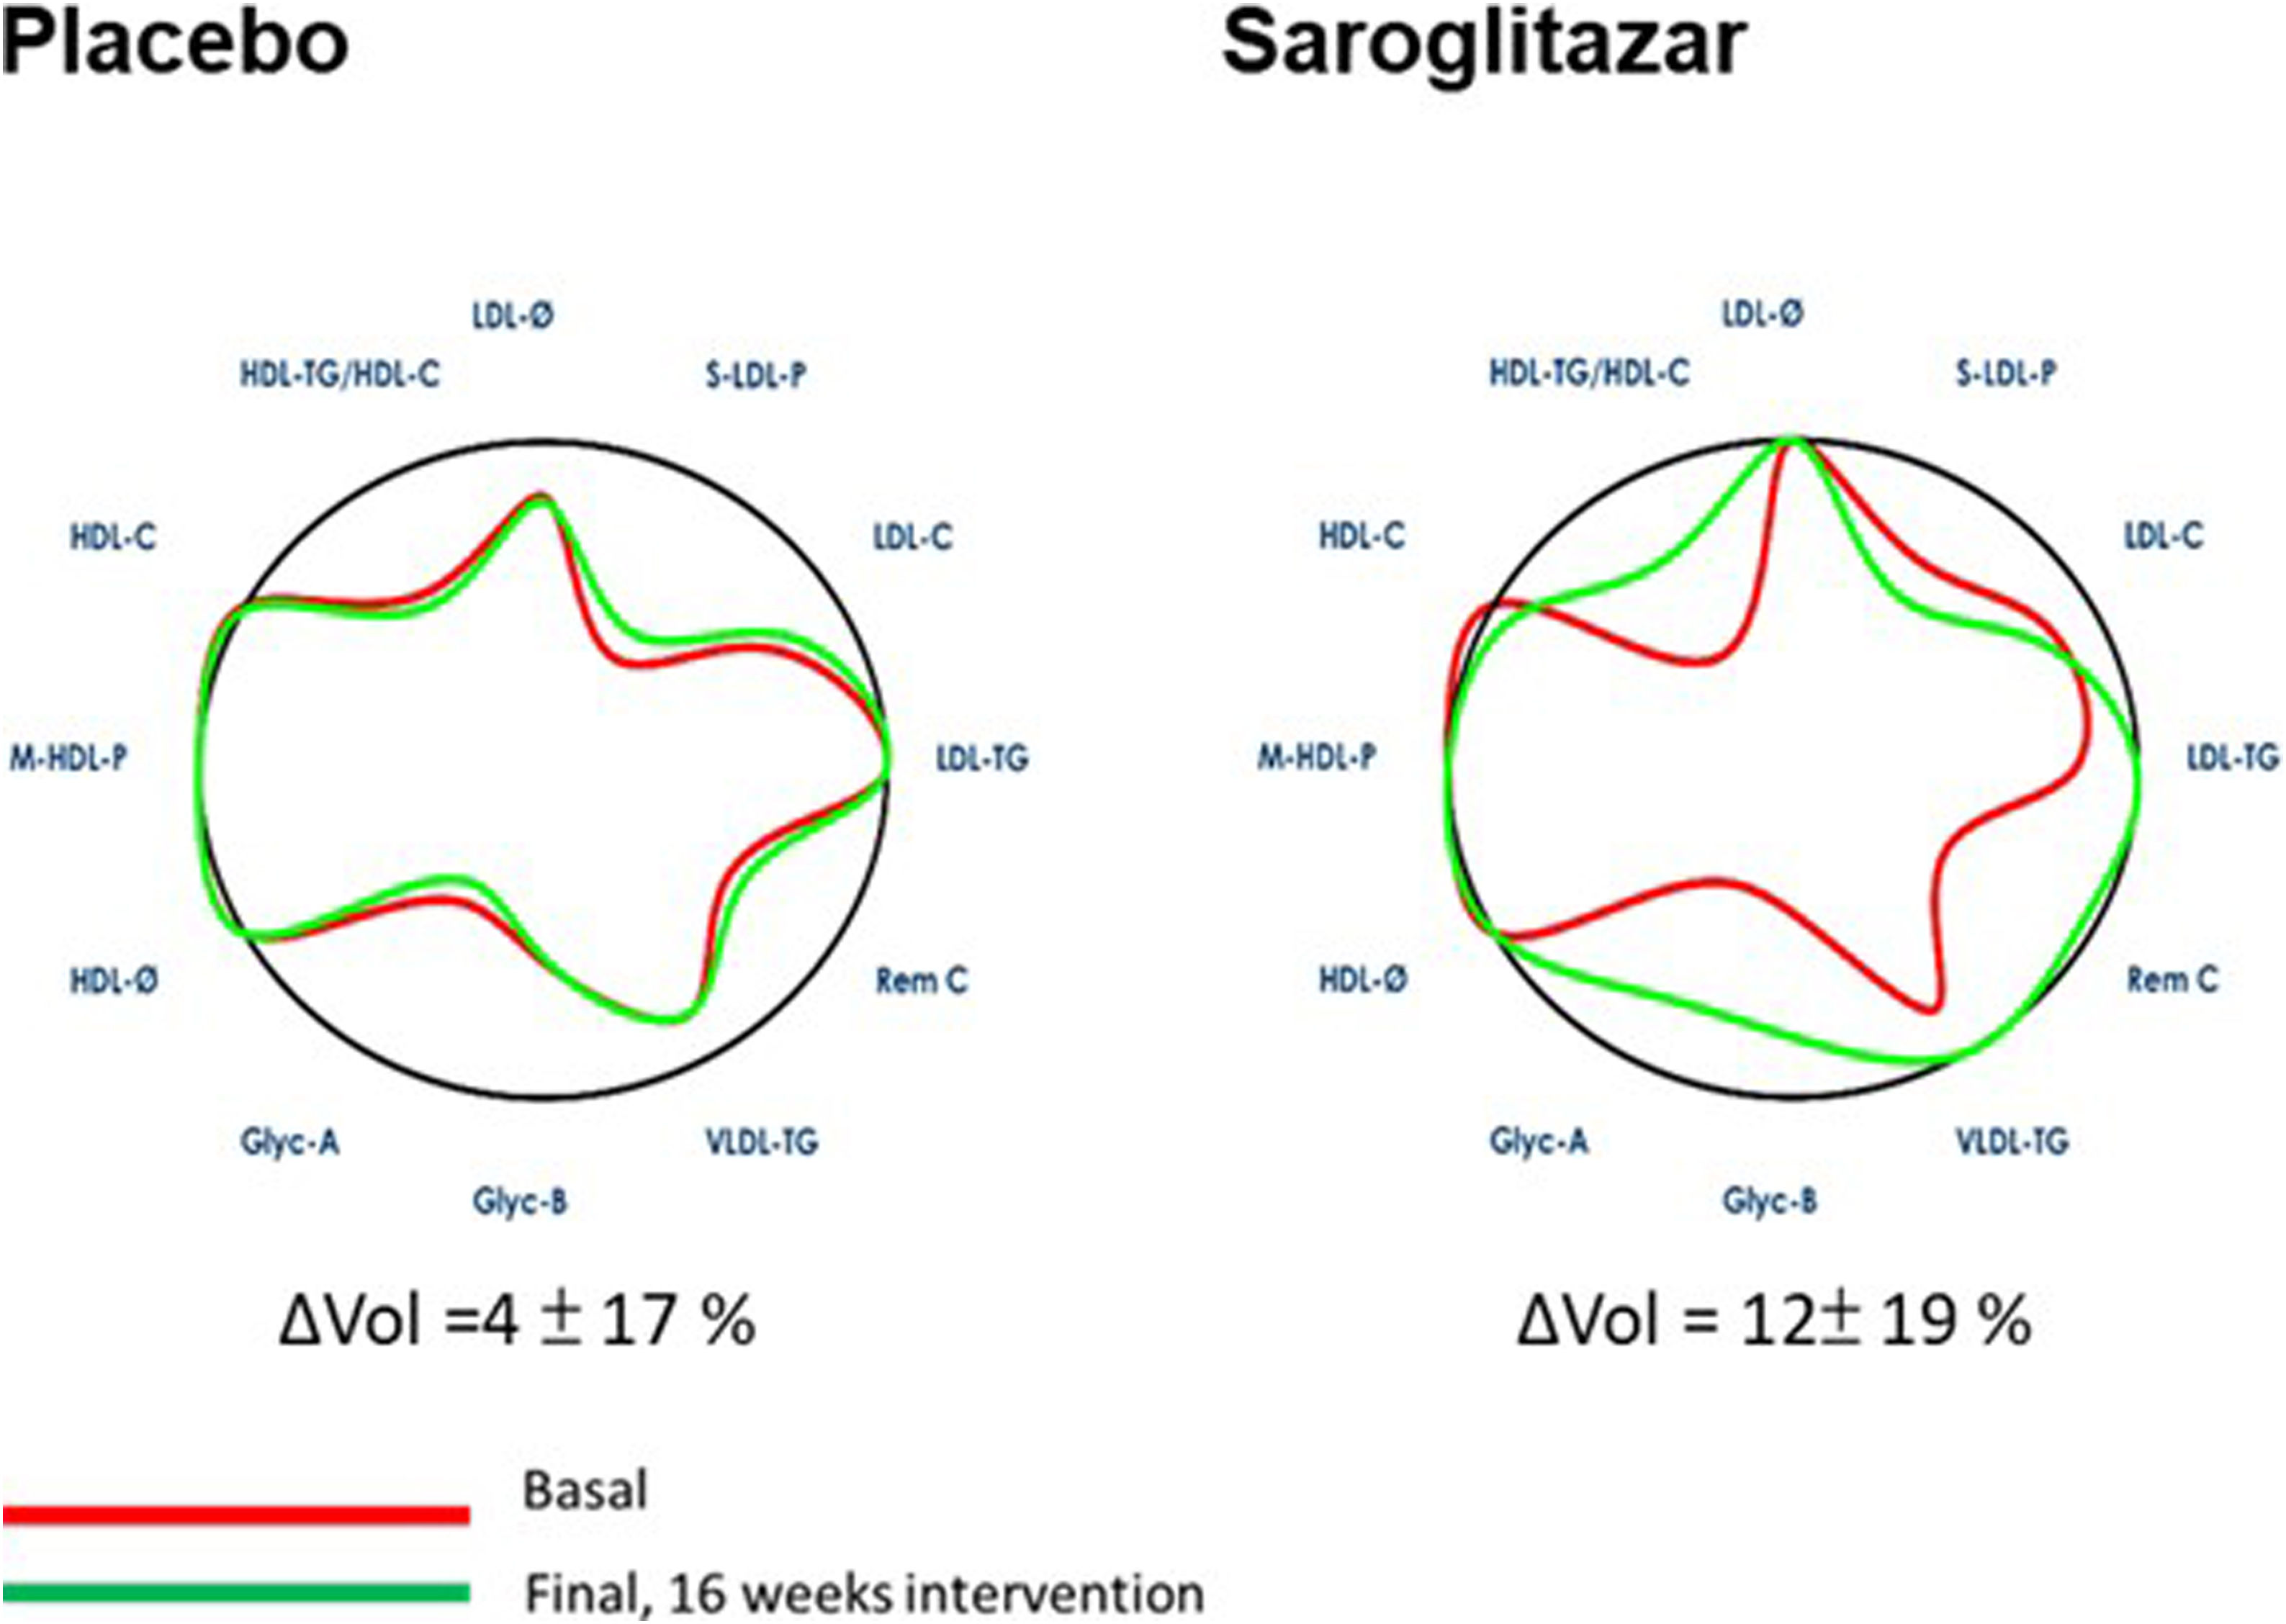
Baseline AC volume of either group (79±17% and 78±22% for the placebo and saroglitazar respectively) was worse than the ideal volume (100%) of the general population (Fig. 2). After 16-week treatment, AC improved significantly in the saroglitazar group versus placebo (mean changes in AC area [ΔVol]: 12±19% versus 4±17%, p=0.039). This improvement was mainly due to improvement in HDL-TG/HDL-C, LDL-TG, Rem C, VLDL-TG, Glyc-A and -B.

Changes in arterial contour from baseline after 16 weeks of saroglitazar therapy. The arterial contour before and after 16 weeks of intervention. LDL-C, low-density lipoprotein cholesterol; LDL-TG, LDL triglycerides; S-LDL-P, small LDL particles; LDL-Ø, LDL particle size; HDL-C, high-density lipoprotein cholesterol; HDL-TG, HDL triglycerides; M-HDL-P, medium HDL particles; HDL-Ø, HDL particle size; VLDL-C, very low-density lipoprotein cholesterol; VLDL-TG, VLDL triglycerides; VLDL-P, VLDL particles; Remnant-C, remnant cholesterol; Glyc-A, N-acetyl-glucosamine/-galactosamine protein bonds; Glyc-B, N-acetyl-neuraminic acid protein bonds.
The heterogeneity and large number of lipids, lipo- and glycoprotein variables that contributes to the atherosclerotic process make evaluation of changes in these parameters challenging as it pertains to CVD risk. The complexity of this assessment is due not only to working with a high number of parameters as shown in Table 1, but also understanding how the interaction between these variables may influence CVD risk. In this study, we present a novel tool, the AC, which allows global and rapid visual assessment of the overall changes in AP by illustrating weighted changes in key lipids, lipo- and glycoprotein parameters pertinent to CVD risk.
Saroglitazar was designed to have stronger PPAR-α and weaker-γ effects, increases hepatic oxidation of fatty acids and lowers synthesis and secretion of TG through its potent PPAR-α agonism,12 and increases triglycerides catabolism and clearance through the changes in transcription of many genes including the lipoprotein lipase (LPL).13 This mechanism probably explains the improvement in parameters mainly associated with TG, TG-rich lipoprotein (i.e. VLDL and IDL), and their particle size in the saroglitazar-treated group in this study. The atherogenic potential of these TG-rich lipoproteins had been recognized independent from LDL.13
Regarding the HDL particles, the small but significant percentage decrease in large and medium HDL particles observed with saroglitazar may be difficult to interpret. While some studies have inversely associated smaller HDL particles with incident CVD and all-cause mortality,14 others have shown them to be less associated with cardiovascular prevention.15 However, the total amount of HDL-C was not significantly altered; in all cases, the changes in HDL particle distributions were minor.
Glyc-A had been shown to correlated with increased CVD events and mortality,8,16 while Glyc-B, Glyc-F, H/W Glyc-A and H/W Glyc-B were also associated with subclinical systemic inflammation and atherosclerosis.17–19 A recent study revealed Glyc-A and Glyc-B were strongly correlated with plasma TG and non-HDL-C.20 The substantial decline of these glycoprotein markers revealed in our study could be related to decreased TG secretion and improved hepatic steatosis and inflammation observed in the saroglitazar group.9
This study has several limitations that should be considered when interpreting its results. Firstly, a significant limitation is the absence of validation for the AC values in terms of their predictive power. Questions remain regarding what constitutes normal, low, or high-risk levels for the AC values according to specific cohorts. Secondly, while the weight of each variable is mathematically defined, it is not weighted according to its clinical predictive importance and might be different according to the clinical characteristics of the patient. Future work necessarily involves including longitudinal follow up information to evaluate the predictive capacity of the tool in specific populations.
This pilot study presented a novel tool, AC, that facilitates global and rapid visual assessment of AP by evaluating changes in a variety of key lipids, lipo- and glycoprotein parameters pertinent to CVD risk, before and after a 16-week saroglitazar therapy in patients with MAFLD. Further evaluation of association of changes in AC with CV events in larger cohorts is warranted in future studies.
ConclusionsIn summary, AC is a novel tool for global evaluation and visualization of AP changes before and after pharmacotherapy. A 16-week sarolitazar treatment significantly improved AC in patients with MAFLD.
Authors’ contributionsNA created arterial contour. Data collection: NA, PO, CA, NPC, SG. Statistical analysis: NA. Interpretation of the study results: All authors. Manuscript writing: KHL and SG. Critical review and revision of manuscript: All authors reviewed and approved the final manuscript.
FundingZydus Discovery DMCC.
Conflicts of interestDr. Lin: Nothing to disclose, Dr. Amigó is stock owner of Biosfer Teslab and has a patent of the lipoprotein profiling described in the present research, Dr. Ortiz is Medical Advisor for Biosfer, Dr. Alonso is employed by OWL Metabolomics, Dr. Smolensky declare no conflict pertinent to this work, Dr. Parmar is Chief Medical Officer and Head Clinical Research and Development of Zydus Therapeutics Inc, Dr. Chalasani: Ongoing consulting activities (or had in preceding 12 months) with Madrigal, Zydus, Galectin, Boeringher-Ingelheim, Merck, GSK, Foresite, and Altimmune. These consulting activities are generally in the areas of nonalcoholic fatty liver disease and drug hepatotoxicity. Dr. Chalasani receives research grant support from Exact Sciences and DSM where his institution receives the funding. He has equity ownership in RestUp, LLC and Avant Sante Therapeutics, LLC, health care start-up companies, Dr. Gawrieh consulting: TransMedics, Pfizer. Research grant support: Viking and Zydus, SonicIncytes.