


Despite the key role of the endothelium in atherosclerosis, there are no direct techniques for its analysis. The study of extracellular vesicles of endothelial origin (EEVs), might lead to the identification of molecular signatures and early biomarkers of atherosclerosis. The aim of this work was to set up the methods for EEVs separation and transcriptomic analysis.
MethodsWe adapted an antibody-magnetic-bead based immunocapture protocol for plasma EEVs separation from control (G1), subclinical atherosclerosis (G2) and peripheral artery disease subjects (PAD) (G3), and modified an ultra-low input RNASeq method (n=5/group). By bioinformatics analysis we compared the transcriptome of plasma EEVs with that of human aortic endothelial cells (TeloHAECs), and then, searched for differentially expressed genes (DEG) among EEVs of G1, G2 and G3. From those DEG, UCP2 was selected for further validation in plasma EVs (qPCR), and in vitro, in stimulated TeloHAECs (IL-1β, TNFα, oxLDL and hypoxia).
ResultsThe RNASeq analysis of plasma EEVs rendered 1667 genes enriched in transcripts expressed by TeloHAECs (NES: 1.93, p adjust=1.4e−73). One hundred seventy DEGs were identified between G2 vs G1, and 180 between G3 vs G1, of which 17 were similarly expressed in G2 and G3 vs control, including UCP2. IL-1β and TNFα (10ng/mL, p<0.05), hypoxia (1% O2, p=0.05) and oxLDL (100μg/mL, p=0.055) reduced UCP2 expression in TeloHAECs.
ConclusionsWe set up a protocol for EEVs separation and sequencing that might be useful for the identification of early markers of endothelial dysfunction in atherosclerosis.
A pesar del papel clave del endotelio en la aterosclerosis, no existen técnicas directas para su análisis. El estudio de las vesículas extracelulares de origen endotelial (EEV) podría facilitar la identificación de firmas moleculares y biomarcadores tempranos de aterosclerosis. El objetivo de este trabajo fue establecer los métodos para la separación de EEV y su análisis transcriptómico.
MétodosAdaptamos un protocolo de inmunocaptura con anticuerpos y microesferas magnéticas para la separación de las EEV del plasma de sujetos control (G1), con aterosclerosis subclínica (G2) y con enfermedad arterial periférica (G3), y modificamos un método de RNASeq para su análisis transcriptómico (n=5/grupo). Comparamos el transcriptoma de las EEV plasmáticas con el de células endoteliales de aorta humana (TeloHAEC) e identificamos genes diferencialmente expresados (DEG) entre los grupos de pacientes, incluyendo UCP2, validado en EV plasmáticas (qPCR) e in vitro, en TeloHAECs tratadas con IL-1β, TNF-α, oxLDL e hipoxia.
ResultadosEl RNASeq de las EEV plasmáticas detectó 1.667 genes enriquecidos en transcritos expresados por las TeloHAECs (NES: 1,93, ajuste p=1,4e−73). Se identificaron 170 DEG entre los grupos G2 vs. G1 y 180 entre G3 vs. G1, de los cuales 17 se expresaron de forma similar en G2 y G3 vs. control, incluyendo UCP2. El tratamiento con IL-1β y TNF-α (10ng/ml, p<0,05), hipoxia (1% O2, p=0,05) y oxLDL (100μg/ml, p=0,055) redujo la expresión de UCP2 en las TeloHAEC.
ConclusionesHemos puesto a punto un protocolo para la separación y la secuenciación de EEV que podría ser útil para la identificación de marcadores tempranos de disfunción endotelial en aterosclerosis.
Cardiovascular diseases (CVDs) are the leading cause of morbidity and mortality in developed countries, contributing to 17.3 million deaths per year worldwide with a growth expectation beyond 23.6 million by 2030 due to lifestyle changes and aging.1 Atherosclerosis, the main aetiology behind CVDs, begins early in life affecting large and medium size arteries. It progresses silently from its subclinical form to clinical symptoms according to genetic factors and to the exposure to environmental elements, increasing the risk of ischemic complications and death.1–4 The timely recognition of subclinical atherosclerosis might slow down its progression and delay the development of associated CVDs. In this regard, the study of the endothelial monolayer, the first to be activated in response to inflammatory and atherogenic stimuli,5 could give invaluable insights into the arterial changes related to this process. However, its inaccessibility and diffuse nature hinders this possibility. In this context, extracellular vesicles (EVs) might represent an opportunity to study endothelial cells (ECs).6
EVs are lipid nanoparticles released into the bloodstream by all cell types, including ECs, carrying nucleic acids (DNA, mRNA, microRNA), proteins and lipids from the cells of origin. Their cargo is specific to the stimulus triggering their formation and release, and it is protected by the lipid bilayer from degradation by the nucleases and the proteinases present in body fluids.7 EVs have been proposed as fundamental components of liquid biopsy, participating in the crosstalk between vascular and circulating cells, in cell to cell communication processes, and as biomarkers of cellular activation.6 Additionally, EVs directly shed from the plasma membrane, or microvesicles, can bring markers specific to the parental cell, enabling their categorization by cellular origin.8 Based on the latter, the separation of circulating EVs of endothelial origin (EEVs) would constitute a non-invasive opportunity to study their content in different pathophysiological conditions.
We hypothesize that the molecular study of circulating EEVs will lead to the identification of early biomarkers of atherosclerosis and potential therapeutic targets. To test our hypothesis, first, we adapted an immunocapture protocol for EEVs based on magnetic beads.9 Second, we modified an ultra-low input RNASeq method for the transcriptomic analysis, and third, we applied these methods to blood samples of: controls without atherosclerosis (group 1), subclinical atherosclerosis subjects (group 2), and patients with symptomatic lower extremity peripheral artery disease (PAD, group 3). Finally, we studied the expression of a selected candidate gene in ECs subjected to proinflammatory and atherogenic stimuli in vitro.
Materials and methodsClinical samplesControl (G1, n=12) and subclinical atherosclerosis subjects (G2, subclinical atherosclerosis in more than two arterial beds, n=12) were selected from de Lipid Unit of the Hospital Universitario Miguel Servet, Zaragoza, Spain.10 Patients with symptomatic lower extremity PAD (G3, n=12) were enrolled at the vascular surgery department of the Hospital Universitario de Navarra, Spain.11 The demographic and clinical parameters of these subjects are listed in Supplemental Table 1.
As previously described,12 blood collected in citrated tubes (VACUETTE tube 3.5mL 9NC Coagulation sodium citrate 3.2%, Greiner Bio-one) was centrifuged at 1800g for 15min at 4°C (swinging bucket rotor, model SX4250, Allegra X-22 centrifuge, Beckman Coulter) to obtained platelet rich plasma, that was then centrifuged (fixed angle rotor, radius 92mm, Mikro 22R, Hettich Zentrifugen) at 14,000g for 2min to obtain platelet-free plasma (PFP), which was frozen at −80°C. No purity assessment of PFP was performed.
The study was approved by the Institutional Review Boards of the CEICA (3.0.20/2017) and the CEI (2021.197) according to the standards of the Declaration of Helsinki on medical research, and written informed consent was obtained from all patients who were enrolled in this study.
Endothelial cell cultureEndothelial EVs separationImmortalized human aortic endothelial cells (TeloHAEC, ATCC® CRL-4052™) were grown in 175cm2 flasks in complete medium [vascular cell basal medium (PCS-100-030, ATCC primary cell solution) supplemented with the endothelial cell growth kit-VEGF (PCS-100-041, ATCC primary cell solution) and 1% penicillin/streptomycin (PS, 100U/mL and 100μg/mL respectively, Sigma-Aldrich)] at 37°C in 5% CO2 until confluency. Confluent cells were washed and changed to serum free medium (human endothelial SFM, 11111-044, Gibco; 100nM P/S at 37°C in 5% CO2) in the absence or presence of 5ng/mL recombinant human TNFα (Merck) for 24h. The conditioned medium was collected and centrifuged twice to eliminate cellular debris (1× 300g, 5min at 4°C, followed by 2500g, 10min at 4°C) and stored at −20°C for EVs separation (TeloHAEC-EVs and TeloHAEC-TNFα-EVs).
RNASeq1×105 TeloHAEC/well were seeded on 6 well/plates in complete medium until confluence. Confluent cells were changed to serum free medium for 16h and collected in lysis buffer (1.1μL Phusion® HF Buffer 5X (NEB), 27.5μL Proteinase K (20mg/mL, Thermo Fisher Scientific), 1.1μL RNaseIN (Promega), 4.4μL 10% Triton X100 (ThermoFisher), up to 440μL RNase free H2O (Invitrogen)) for RNASeq analysis.
Gene expression analysisSixty-five thousand TeloHAECs/well were seeded on 24 well/plates in complete medium until confluency, changed to SFM for 16h and stimulated with 10ng/mL IL-1β (IL038, Millipore), 10ng/mL TNFα (GF023, Millipore), 100μg/mL oxidized-LDL (LDLO13-N-1, Alpha Diagnostic International) or hypoxia (1% O2). Cells were harvested in 200μL of homogenization buffer (Maxwell RSC simplyRNA tissue kit, Promega) at baseline, 6, 12 and 24h after stimulation and stored at −80°C for RNA isolation.
Flow cytometry1×105 TeloHAECs were stained with a PE anti-CD146 antibody (1:70 dilution, #5050-B100T, Biocytex) in 100μL of FACS buffer (5% FBS, 2mM EDTA in PBS) for 20min at RT. One milliliter of FACS buffer was added and cells were centrifuged at 400g for 5min. The cellular pellet was resuspended in 200μL of FACS buffer for flow cytometry (CytoFlex, Beckman coulter). Results were analysed with CytExpert 2.5 software (Beckman Coulter).
TeloHAEC-EVs and total plasma EVs separation by centrifugationForty milliliters of conditioned medium from TeloHAECs or 400μL of PFP were thawed at RT and centrifuged at 20,000g for 70min at 4°C (ROTOR 30.50 Ti, Avanti J-30I centrifuge, Beckman Coulter for conditioned medium, and Mikro 22R, Hettich Zentrifugen for PFP). The obtained EVs pellet was washed in 1mL of wash buffer (10mM HEPES, 0.9% NaCl, pH=7.4, filtered twice through 0.22μm filters) and centrifuged (Mikro 22R, Hettich Zentrifugen) at 20,000g for 70min at 4°C. Resulting pelleted EVs were resuspended in wash buffer (100μL for TeloHAEC-EVs and 50μL for PFP-EVs) and stored at −80°C.
EVs characterizationCFSE staining and flow cytometryThirty microlitres of isolated TeloHAEC-EVs were stained with carboxyfluorescein N-succinimidyl ester (CFSE, Sigma) to a final concentration of 200μM for 30min at 37°C. To remove the unbound dye, 500μL of 2% BSA in wash buffer was added and samples centrifuged 70min at 20,000g (Mikro 22R, Hettich Zentrifugen). The resulting pellet was resuspended in 50μL wash buffer and stored at −80°C. 25μL of CFSE+ and CFSE− (unstained) TeloHAEC-EVs were used for flow cytometry on a Cytoflex cytometer (Beckman Coulter). The gating strategy was defined with calibrated polystyrene beads of 0.25, 0.58, 0.79 and 1.34μm (Spherotech) using the violet side scatter (Violet-SSC) against the regular SSC (488nm) to trigger a signal to discriminate the noise, resulting in higher particle resolution compared to the forward side scatter (FSC). Results were analysed with CytExpert 2.5 software (Beckman Coulter).
Nano particle tracking analysis (NTA)TeloHAEC-EVs size distribution was measured by NTA (n=4) following the manufacturer's instructions (NanoSight NS300, Malvern Instruments Limited).
Western blotTo assess EVs protein markers, 20μL of isolated TeloHAEC-EVs were lysed by thermal shock (3× 37°C-liquid N2), separated by SDS-PAGE (4–20% Mini-PROTEAN TGX Stain-Free, Bio-Rad) and transferred onto nitrocellulose membrane (iBLOT, Invitrogen, ThermoFisher). Blots were incubated overnight with primary antibodies: Alix (3A9) mouse monoclonal antibody (1:1000, 2171Cell Signaling Bioscience), EMMPRIN (1μg/mL mouse monoclonal anti-human EMMPRIN/CD147, clone IT10C5, Immunotools) followed by 1h incubation with required peroxidase-conjugated secondary antibodies. Peroxidase activity was detected with a chemiluminescent substrate (TMA-6, Lumigen) and images acquired with Chemidoc MP Imaging system (Bio-Rad). Loading was verified using the stain-free gel images generated with Chemidoc MP Imaging system (Bio-Rad).
Separation of plasma endothelial EVs (EEVs) by indirect immunocaptureThe protocol for immunocapture of EEVs is a modification of the method described by Cointe et al.9 Briefly, 25μL of CFSE+ TeloHAEC-EVs or 400μL of CFSE stained (200μM CFSE, 30min at 37°C) or unstained PFP were incubated overnight with an anti-CD146 antibody (1:70 dilution, #5050-B100T, Biocytex) in up to 500μL of isolation buffer (IB: Ca2+ and Mg2+ free PBS, 0.1% BSA, 2mM EDTA, pH 7.4) at 4°C with rotation. Prior to capture, 20μL of immunomagnetic beads (Dynabeads® Goat anti-Mouse IgG, 11033, Invitrogen) were washed three times in 500μL IB. Washed immunomagnetic beads were resuspended in 500μL of IB, added to the PFP+anti-CD146 mix and incubated 1h at RT with rotation. After incubation, EVs-antibody-beads complexes were recovered with a magnet and resuspended in IB for confocal microscopy, or in lysis buffer (1.1μL Phusion® HF Buffer 5X, 27.5μL Proteinase K (20mg/mL, 1.1μL RNaseIN, 4.4μL 10% Triton X100, up to 440μL RNase free H2O) for RNASeq library preparation.
Confocal microscopy of EEVs-beads immunocomplexesConfocal microscopyTen microlitres of beads-EEVs complexes (5×10⁴ beads) were added to 5mm diameter chambers (μ-Slide 18 Well-Flat, Ref. 81826, Ibidi) and covered with 10μL 1.6% Agar-Agar (Scharlau). Samples were visualized with a LSM 880 NLO confocal microscope (Zeiss).
Library preparation for RNA sequencing and bioinformatic analysisSequencing libraries were obtained following the molecular crowding single-cell RNA barcoding and sequencing (mcSCRBseq) method of Bagnoli et al. with minor modifications.13 Briefly, samples were mixed with 5μL of lysis buffer and incubated on ice 10min, then at 50°C 10min, and at 80°C 10min. RNA was then captured with RNA XP beads and annealed to a custom primer containing a poly-(T) tract, a unique molecule identifier (UMI), and a sample barcode. Retrotranscription using template-switching oligonucleotides (TSO) was then used to synthetize and amplify 3′UTR enriched cDNA, resulting in barcoded cDNA fragments. Library preparation was performed using the Nextera XT library preparation protocol which introduces i5-P5 and i7-P7 structure for massive parallel sequencing. Quality control was performed following pre-amplification RT and library preparation to ensure quality and length accuracy, as well as to equilibrate sample pooling. Libraries were then sequenced using a NextSeq2000 sequencer (Illumina). Fifty million pair-end reads were sequenced for each sample. EEVs RNASeq data have been submitted to NCBI GEO repository, study number GSE268116.
Bioinformatics analysisThe analysis of the transcriptome was performed as previously reported.12 Briefly, quality of the data was evaluated with FastQC software and the reads were processed with Trimmomatic.14 The resulting reads were aligned with STAR15 using GRCh38 human assembly and Gencode v38 as genome annotation reference.16 Then, duplicated reads were removed applying UMI-tools dedup function.17 Finally, expression levels were calculated using featureCounts.18 The obtained gene expression data was normalized using the analysis pipeline available in LIMMA package (TMM normalization and logCPM calculation using voom method).19,20 After quality assessment and outlier detection with R/Bioconductor,21 a filtering process was performed. Genes with read counts lower than six in more than the 50% of all the studied conditions were filtered out. LIMMA was used to identify the genes with significant differential expression, considering the age and sex of each patient in the linear model. The selection of differentially expressed genes was based on a p-value cut off, and further functional and clustering analyses and graphical representations were performed using R/Bioconductor. Gene-set enrichment analysis (GSEA) was conducted using mdGSA R package to compared the molecular profile of EEVs with the mRNA content of TeoHAECs, and with endothelial dataset obtained from the gene expression omnibus (GEO) database (GSE163827 and GSE138628). Moreover, a hypergeometric test was performed to assess the overlap between the mRNA content of EEVs and the molecular profile categorized as endothelium-specific in the protein atlas (https://www.proteinatlas.org/humanproteome/celltype/vascular+cells#endothelialcells).
Retrotranscription and quantitative PCR (RT-qPCR)TeloHAECsTotal RNA from cell lysates was extracted using the semi-automated Maxwell RSC simplyRNA tissue kit (Promega) following the manufacturer's instructions. One microgram of total RNA was reverse transcribed with random primers and Moloney murine leukemia virus reverse transcriptase (Thermo Fisher Scientific). Quantitative polymerase chain reactions (qPCRs) were performed on a QuantStudio 5 Real-Time PCR System (Thermo Fisher Scientific) using gene expression assay for UCP2 (Hs01075227_m1, Life technologies) and GAPDH (Hs.PT.39a.22214836, IDT) as housekeeping gene.
Unsorted (total) plasma EVsPrior to RNA isolation, EVs underwent a pre-treatment with proteinase/RNase to eliminate co-precipitated free RNA. Briefly, 100μL of isolated EVs were incubated with 3.5ng/μL Proteinase K (Thermo Fisher Scientific) for 10min at 37°C. The reaction was stopped by the incubation of the mix with 17.6μM of Proteinase K inhibitor (Merk) for 10min at RT. Then, 1ng/μL RNase A (Thermo Fisher Scientific) was added and samples incubated 20min at 37°C. The reaction was stopped by the addition of 1.5U/μL RNaseOUT (Thermo Fisher Scientific) for 5min at RT. RNA from EVs was isolated with the ReliaPrep RNA Tissue Miniprep System (Z6111, Promega) following the manufacturer's instruction, eluted in 20μL of RNase free water and stored at −80°C. One step RT-qPCR reaction was performed for multiple transcript with the TaqPath 1-Step Multiplex Master Mix (Applied Biosystems) on a QuantStudio 5 Real-Time PCR System (Thermo Fisher Scientific) using gene expression assay for UCP2 (Hs01075227_m1, Life technologies) and GAPDH (VIC, NM_002046, IDT).
Statistical analysisThe results of the in vitro experiments are presented as median and interquartile range (IQR). Differences between more than two groups were assessed by Kruskal–Wallis followed by Mann–Whitney U test. Statistical significance was established as p<0.05. The statistical analysis was performed with SPSS version 15.
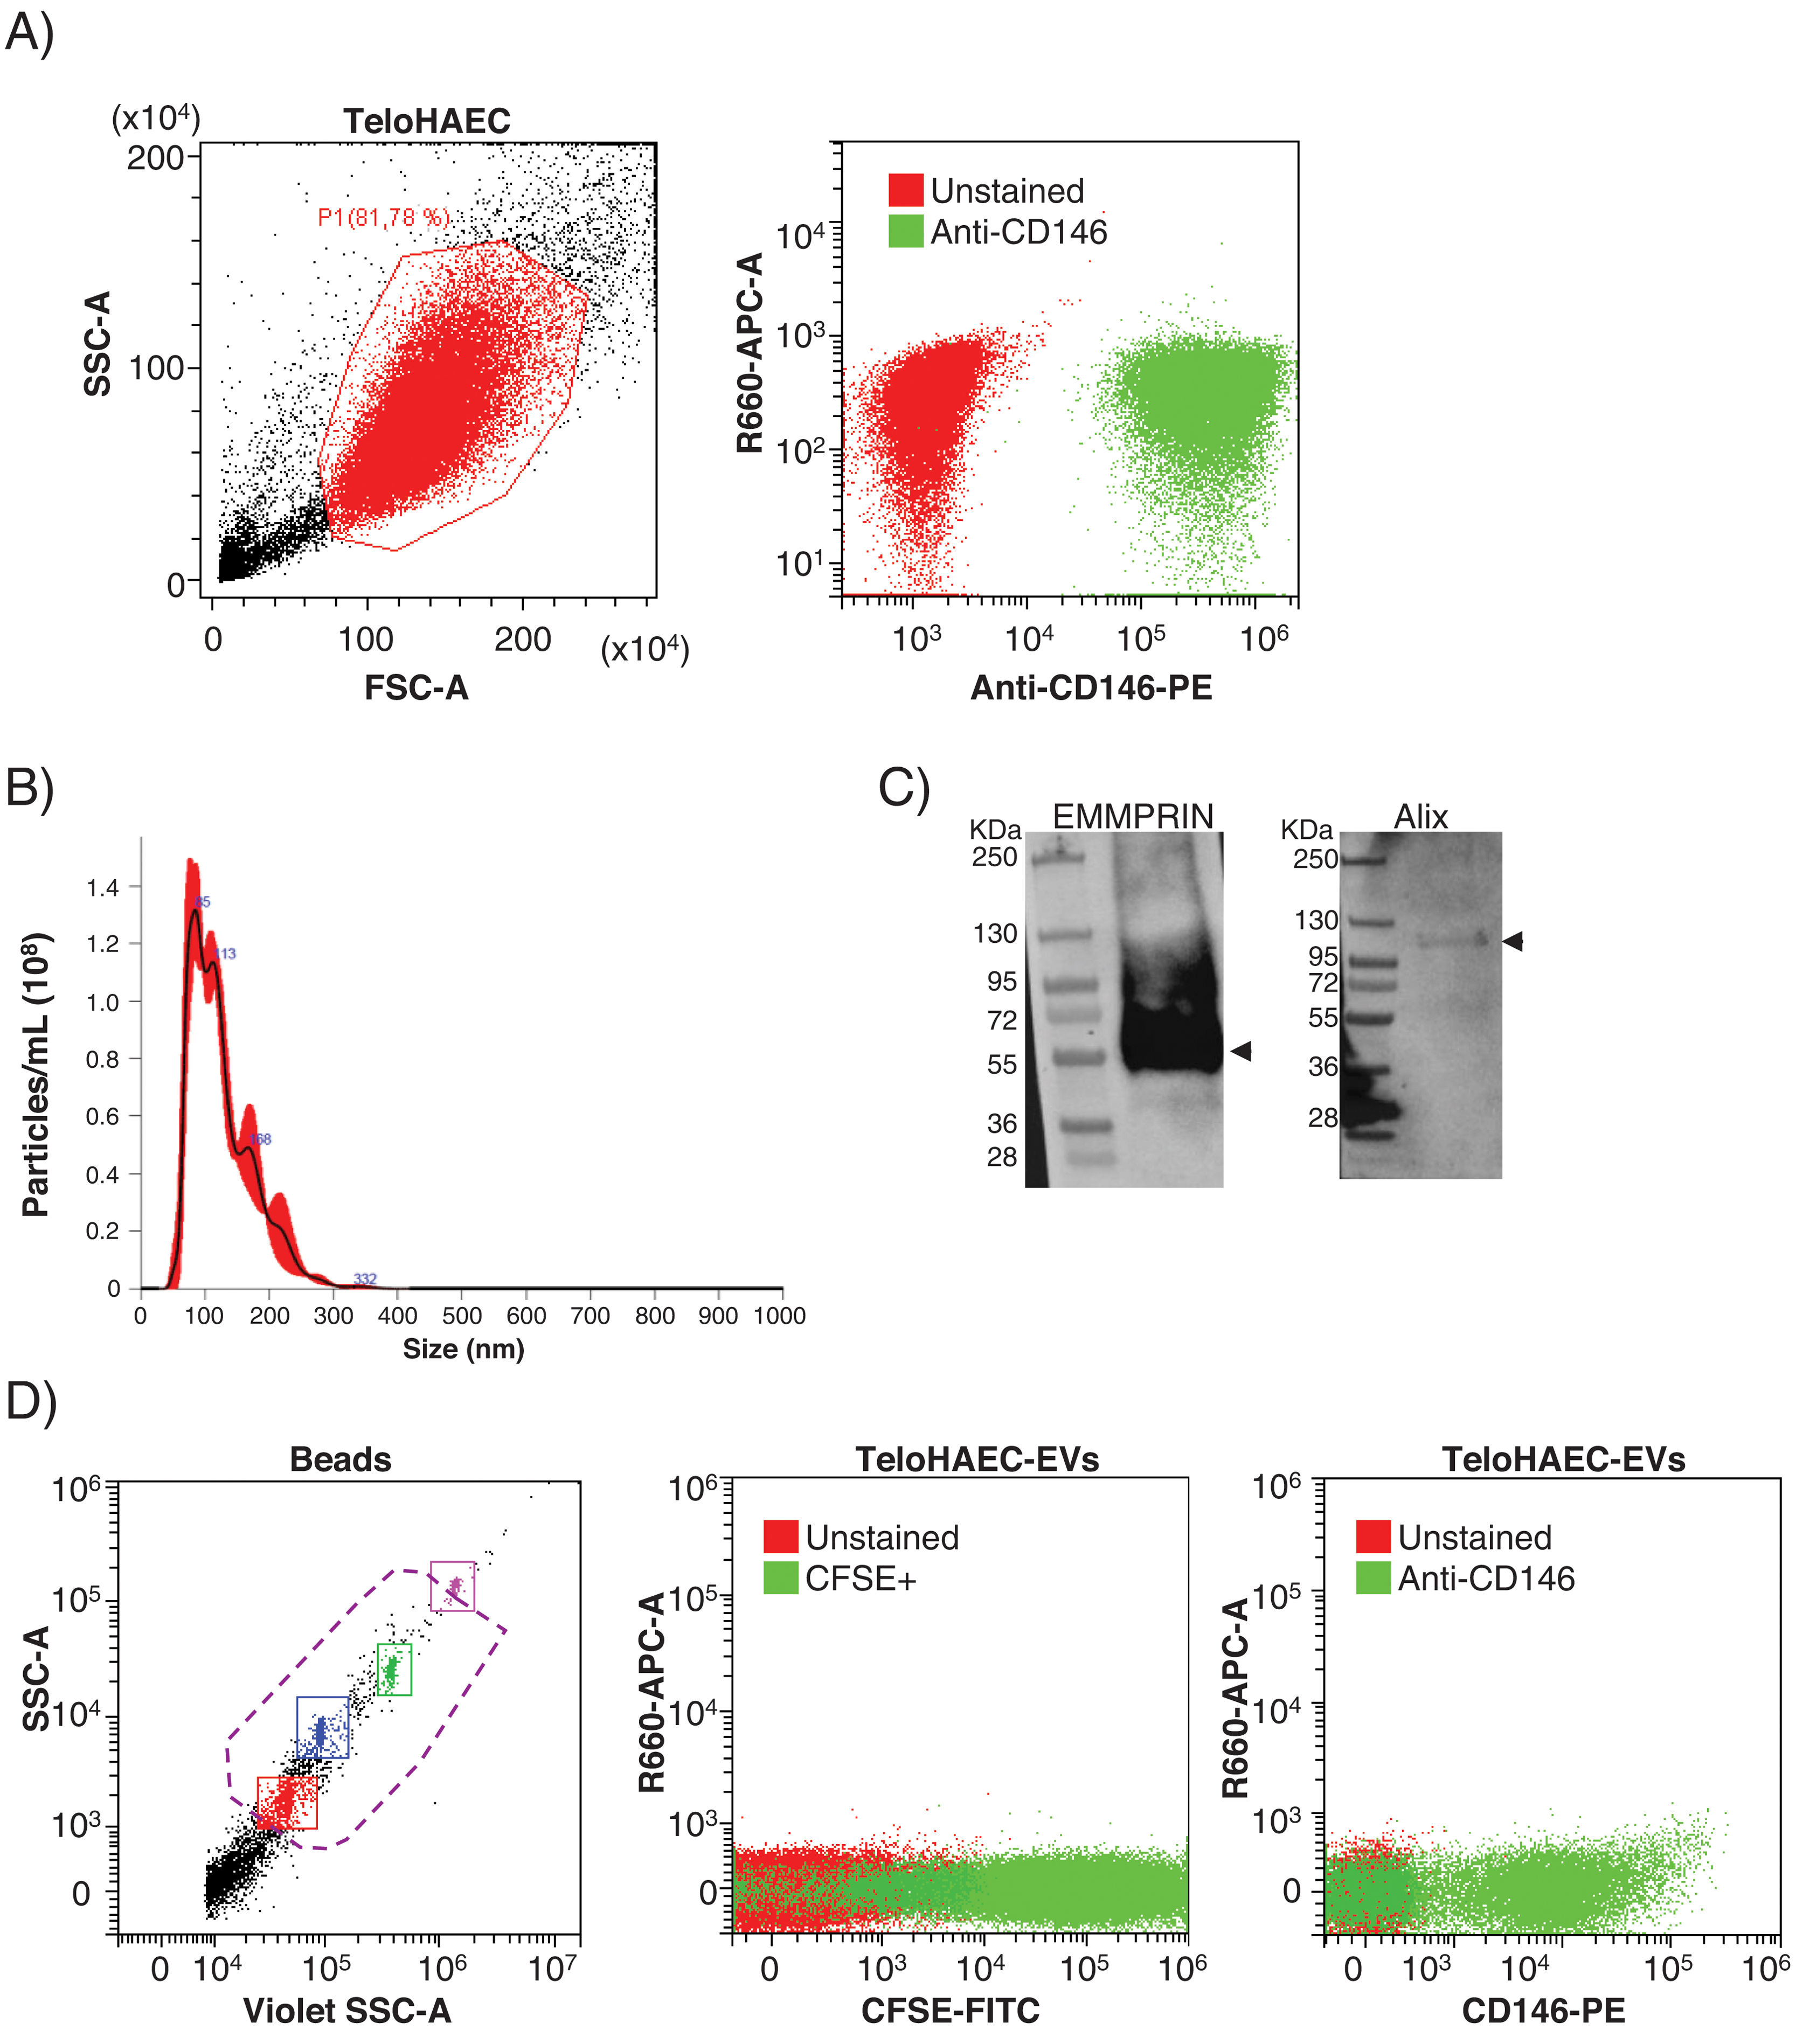
ResultsEEVs are immunocaptured by magnetic beadsPrior to set up the experimental conditions for EEVs immunocapture, we performed flow cytometry on immortalized human aortic endothelial cells (TeloHAEC) to test the anti-CD146 antibody, observing 100% of immunolabelling by this technique (Fig. 1A). To check whether the immunoreactivity of the antibody was maintained in EVs, we obtained EVs from conditioned medium of TeloHAECs and characterized them by NTA, western blot and flow cytometry. TeloHAEC-EVs presented a mean size of 121±2nm, carried the EVs markers Alix and EMMPRIN, and were able to uptake and process the CFSE dye (Fig. 1B–D). Moreover, 68% of TeloHAEC-EVs were positive for CD146 by flow cytometry (Fig. 1D), indicating the presence of the CD146 antigen on their surface.
 and their derived EVs. (A) Left panel: gating strategy for TeloHAECs. Right panel: representative dot-blot for unstained (red) and CD146+TeloHAECs (green). (B) Representative NTA analysis for TeloHAEC-EVs. (C) Western blot for the EVs markers EMMPRIN (≈55kDa) and Alix (≈95kDa) on TeloHAEC-EVs. MW: molecular weight. (D) Flow cytometry analysis of EVs. Left panel: EVs were detected using the violet side scatter (Violet-SSC) against the regular SSC. The working gate (violet discontinuous line) was defined with calibrated beads of 0.25–1.34μm. Middle panel: representative dot-plot of gated unstained (red) and CFSE+TeloHAEC-EVs (FITC+, green). Right panel: gated unstained TeloHAEC-EVs (in red) and CD146+TeloHAEC-EVs (PE+, green).")
Flow cytometry for anti-CD146 antibody on immortalized human aortic endothelial cells (TeloHAECs) and their derived EVs. (A) Left panel: gating strategy for TeloHAECs. Right panel: representative dot-blot for unstained (red) and CD146+TeloHAECs (green). (B) Representative NTA analysis for TeloHAEC-EVs. (C) Western blot for the EVs markers EMMPRIN (≈55kDa) and Alix (≈95kDa) on TeloHAEC-EVs. MW: molecular weight. (D) Flow cytometry analysis of EVs. Left panel: EVs were detected using the violet side scatter (Violet-SSC) against the regular SSC. The working gate (violet discontinuous line) was defined with calibrated beads of 0.25–1.34μm. Middle panel: representative dot-plot of gated unstained (red) and CFSE+TeloHAEC-EVs (FITC+, green). Right panel: gated unstained TeloHAEC-EVs (in red) and CD146+TeloHAEC-EVs (PE+, green).
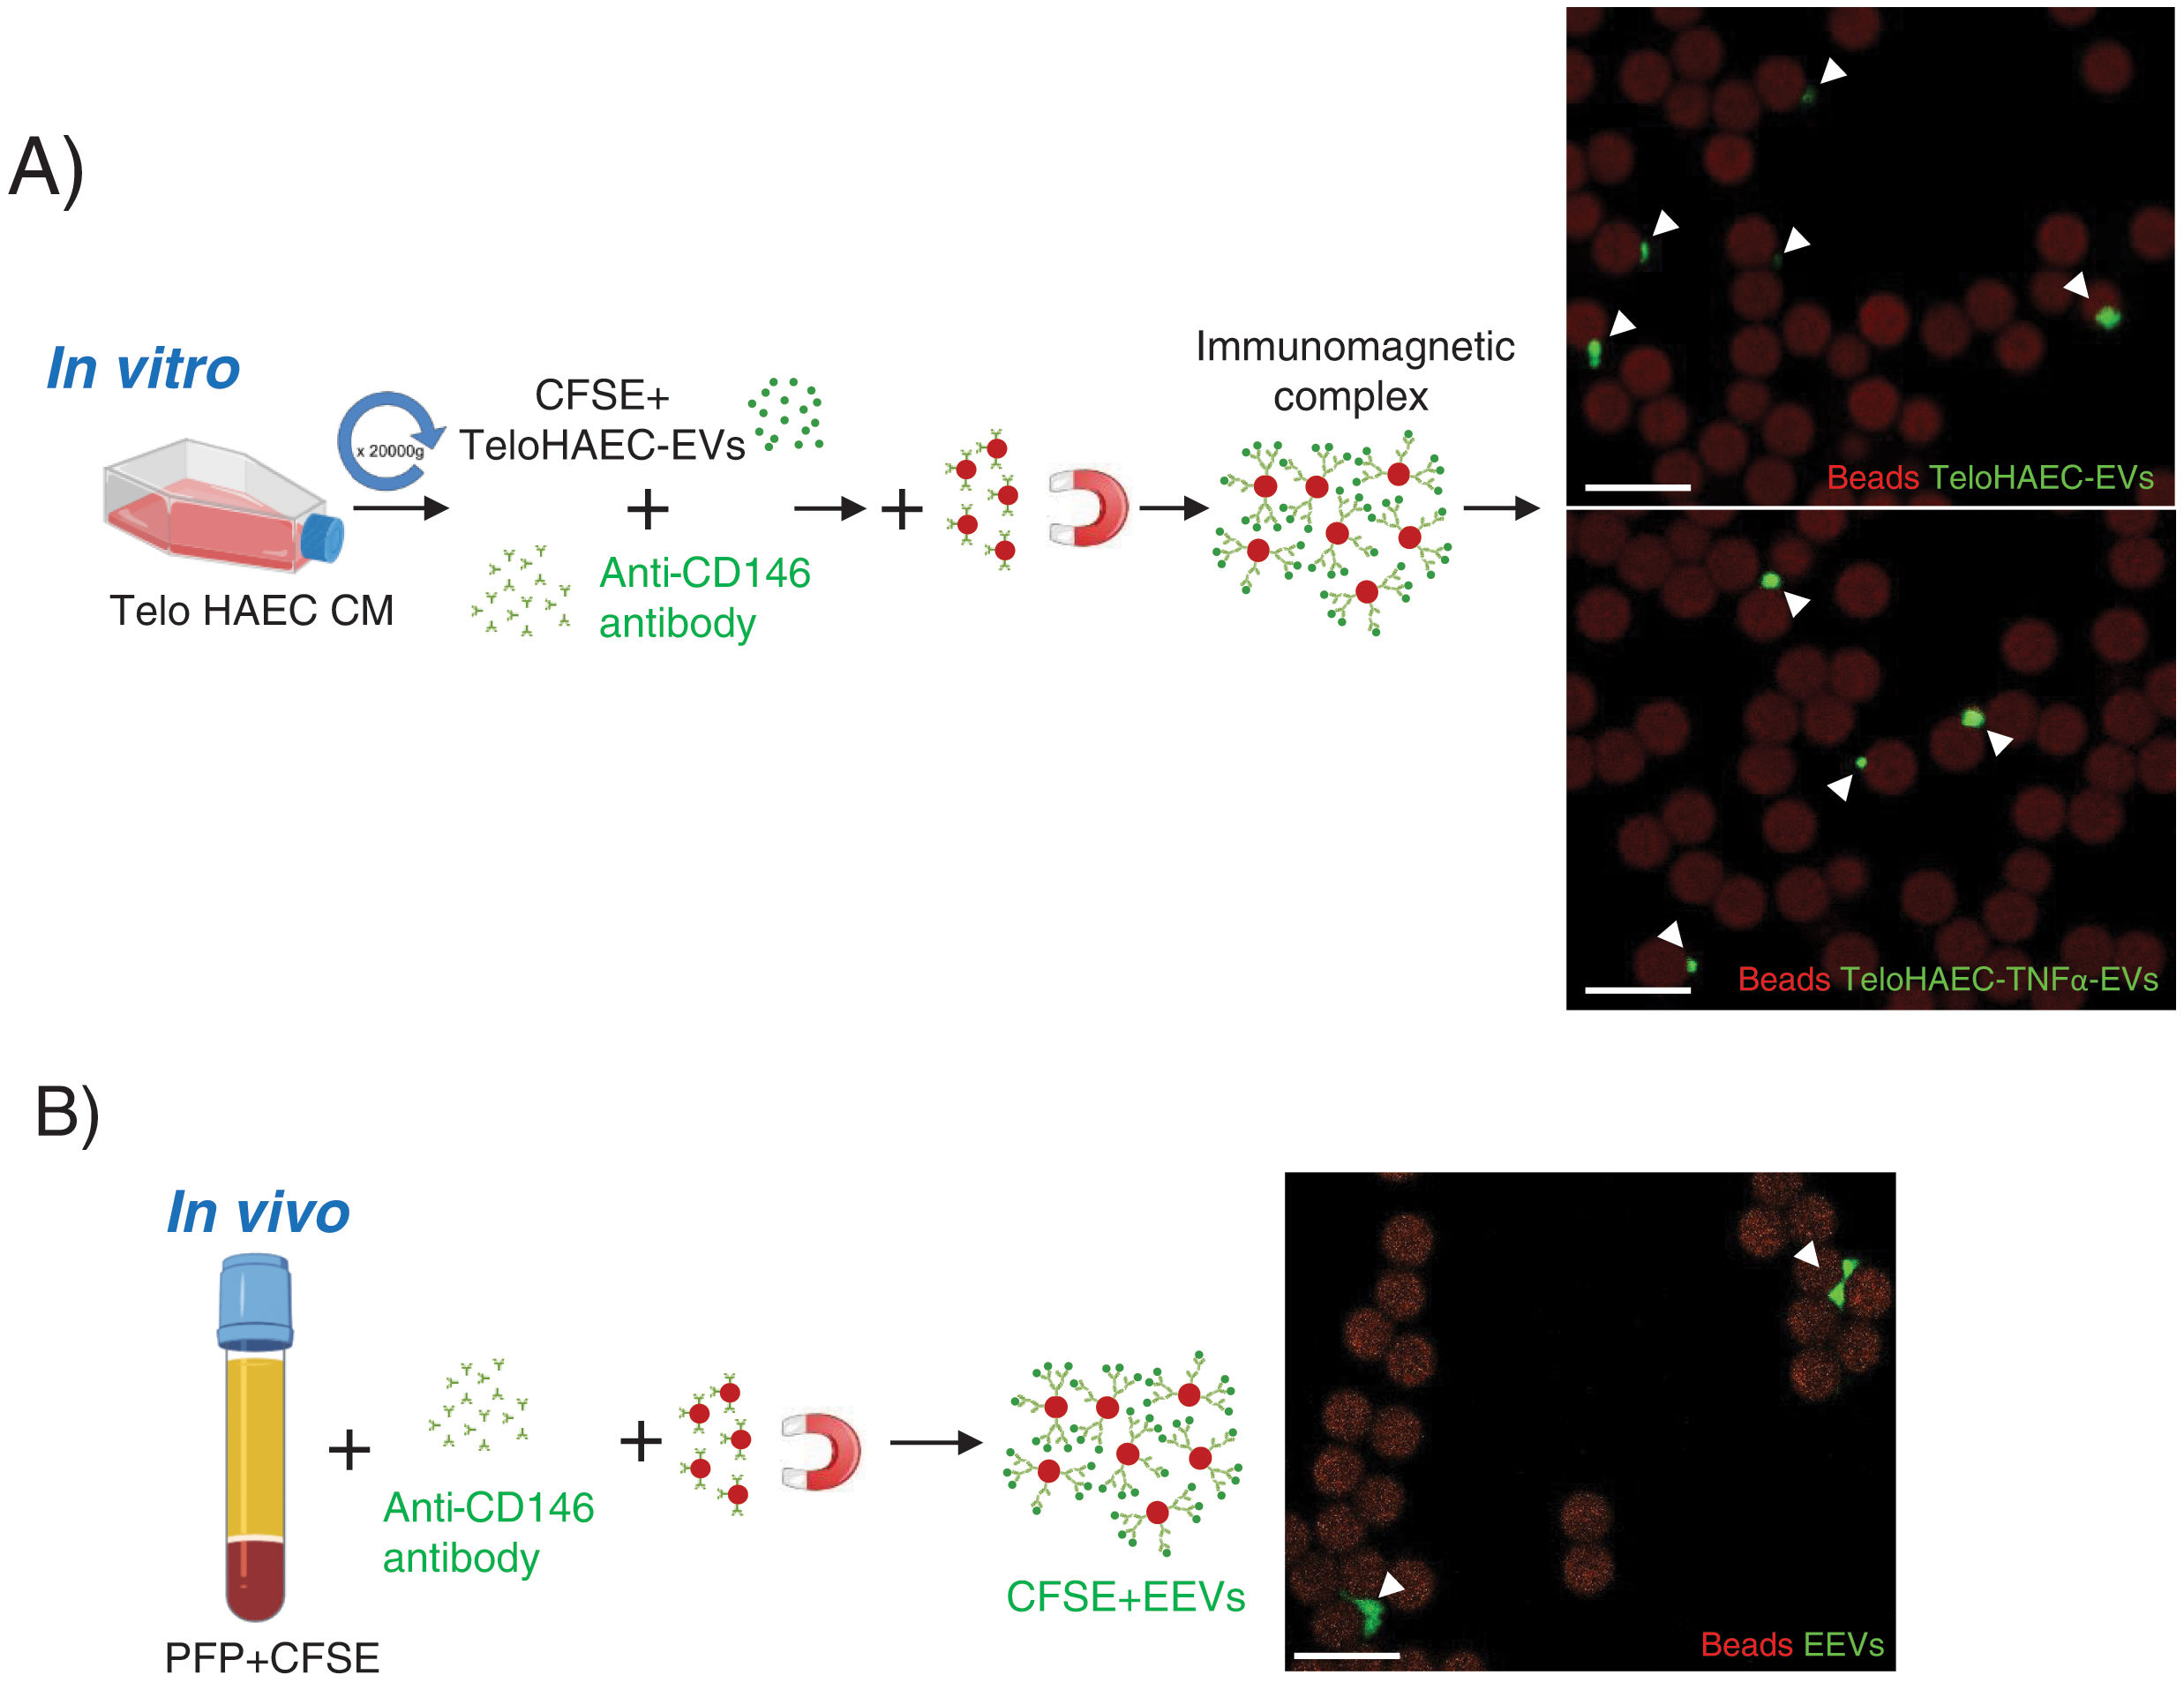
According to these results, we proceeded to set up the conditions for endothelial EVs separation modifying the protocol by Cointe et al.,9 using the anti-CD146 antibody. As shown in Fig. 2A, first, we set up the immunocapture protocol with TeloHAEC-EVs obtained from control or TNFα stimulated cells, observing their binding to immunomagnetic beads by confocal microscopy, and second, we applied this method to CFSE-stained human platelet-free plasma (PFP), detecting EEVs aggregates bound to beads (Fig. 2B) which ensures the utility of this technique for EEVs separation.
 immunocapture in vitro and in vivo. (A) TeloHAEC-EVs were obtained by centrifugation (20,000×g, 70min) of control or TNFα stimulated TeloHAECs conditioned medium (CM). After CFSE staining, CFSE positive TeloHAEC-EVs or TeloHAEC-TNFα-EVs (in green) were incubated overnight with the anti-CD146 antibody, followed by conjugation with immunomagnetic beads (in red). The EVs-anti-CD146-beads complexes were pool down with a magnet and taken for confocal microscopy. On the upper right-hand panel, a representative image of immunomagnetic beads (reddish background) alone or and bound to aggregates of TeloHAEC-EVs (green). On the lower right-hand panel, the immune-binding of TeloHAEC-TNFα-EVs. (B) Immunomagnetic separation of EEVs from platelet-free plasma (PFP) stained with CFSE. PFP was incubated overnight with the anti-CD146 antibody and then conjugated to immunomagnetic beads. The CFSE+EVs-anti-CD146-beads complexes were pool down with a magnet and visualized by confocal microscopy. Scale bar denotes 10μm.")
Endothelial extracellular vesicles (EEVs) immunocapture in vitro and in vivo. (A) TeloHAEC-EVs were obtained by centrifugation (20,000×g, 70min) of control or TNFα stimulated TeloHAECs conditioned medium (CM). After CFSE staining, CFSE positive TeloHAEC-EVs or TeloHAEC-TNFα-EVs (in green) were incubated overnight with the anti-CD146 antibody, followed by conjugation with immunomagnetic beads (in red). The EVs-anti-CD146-beads complexes were pool down with a magnet and taken for confocal microscopy. On the upper right-hand panel, a representative image of immunomagnetic beads (reddish background) alone or and bound to aggregates of TeloHAEC-EVs (green). On the lower right-hand panel, the immune-binding of TeloHAEC-TNFα-EVs. (B) Immunomagnetic separation of EEVs from platelet-free plasma (PFP) stained with CFSE. PFP was incubated overnight with the anti-CD146 antibody and then conjugated to immunomagnetic beads. The CFSE+EVs-anti-CD146-beads complexes were pool down with a magnet and visualized by confocal microscopy. Scale bar denotes 10μm.
In order to determine the transcriptional content of EEVs, we applied the endothelial EVs separation protocol to 15 PFP samples followed by RNASeq. We included healthy subjects (mean age 57 years, 60% male, group 1, n=5), subjects with subclinical atherosclerosis in ≥2 vascular beds (mean age 56 years, 60% male, group 2, n=5), and patients with symptomatic peripheral artery disease (mean age 66 years, 60% male, group 3, n=5).
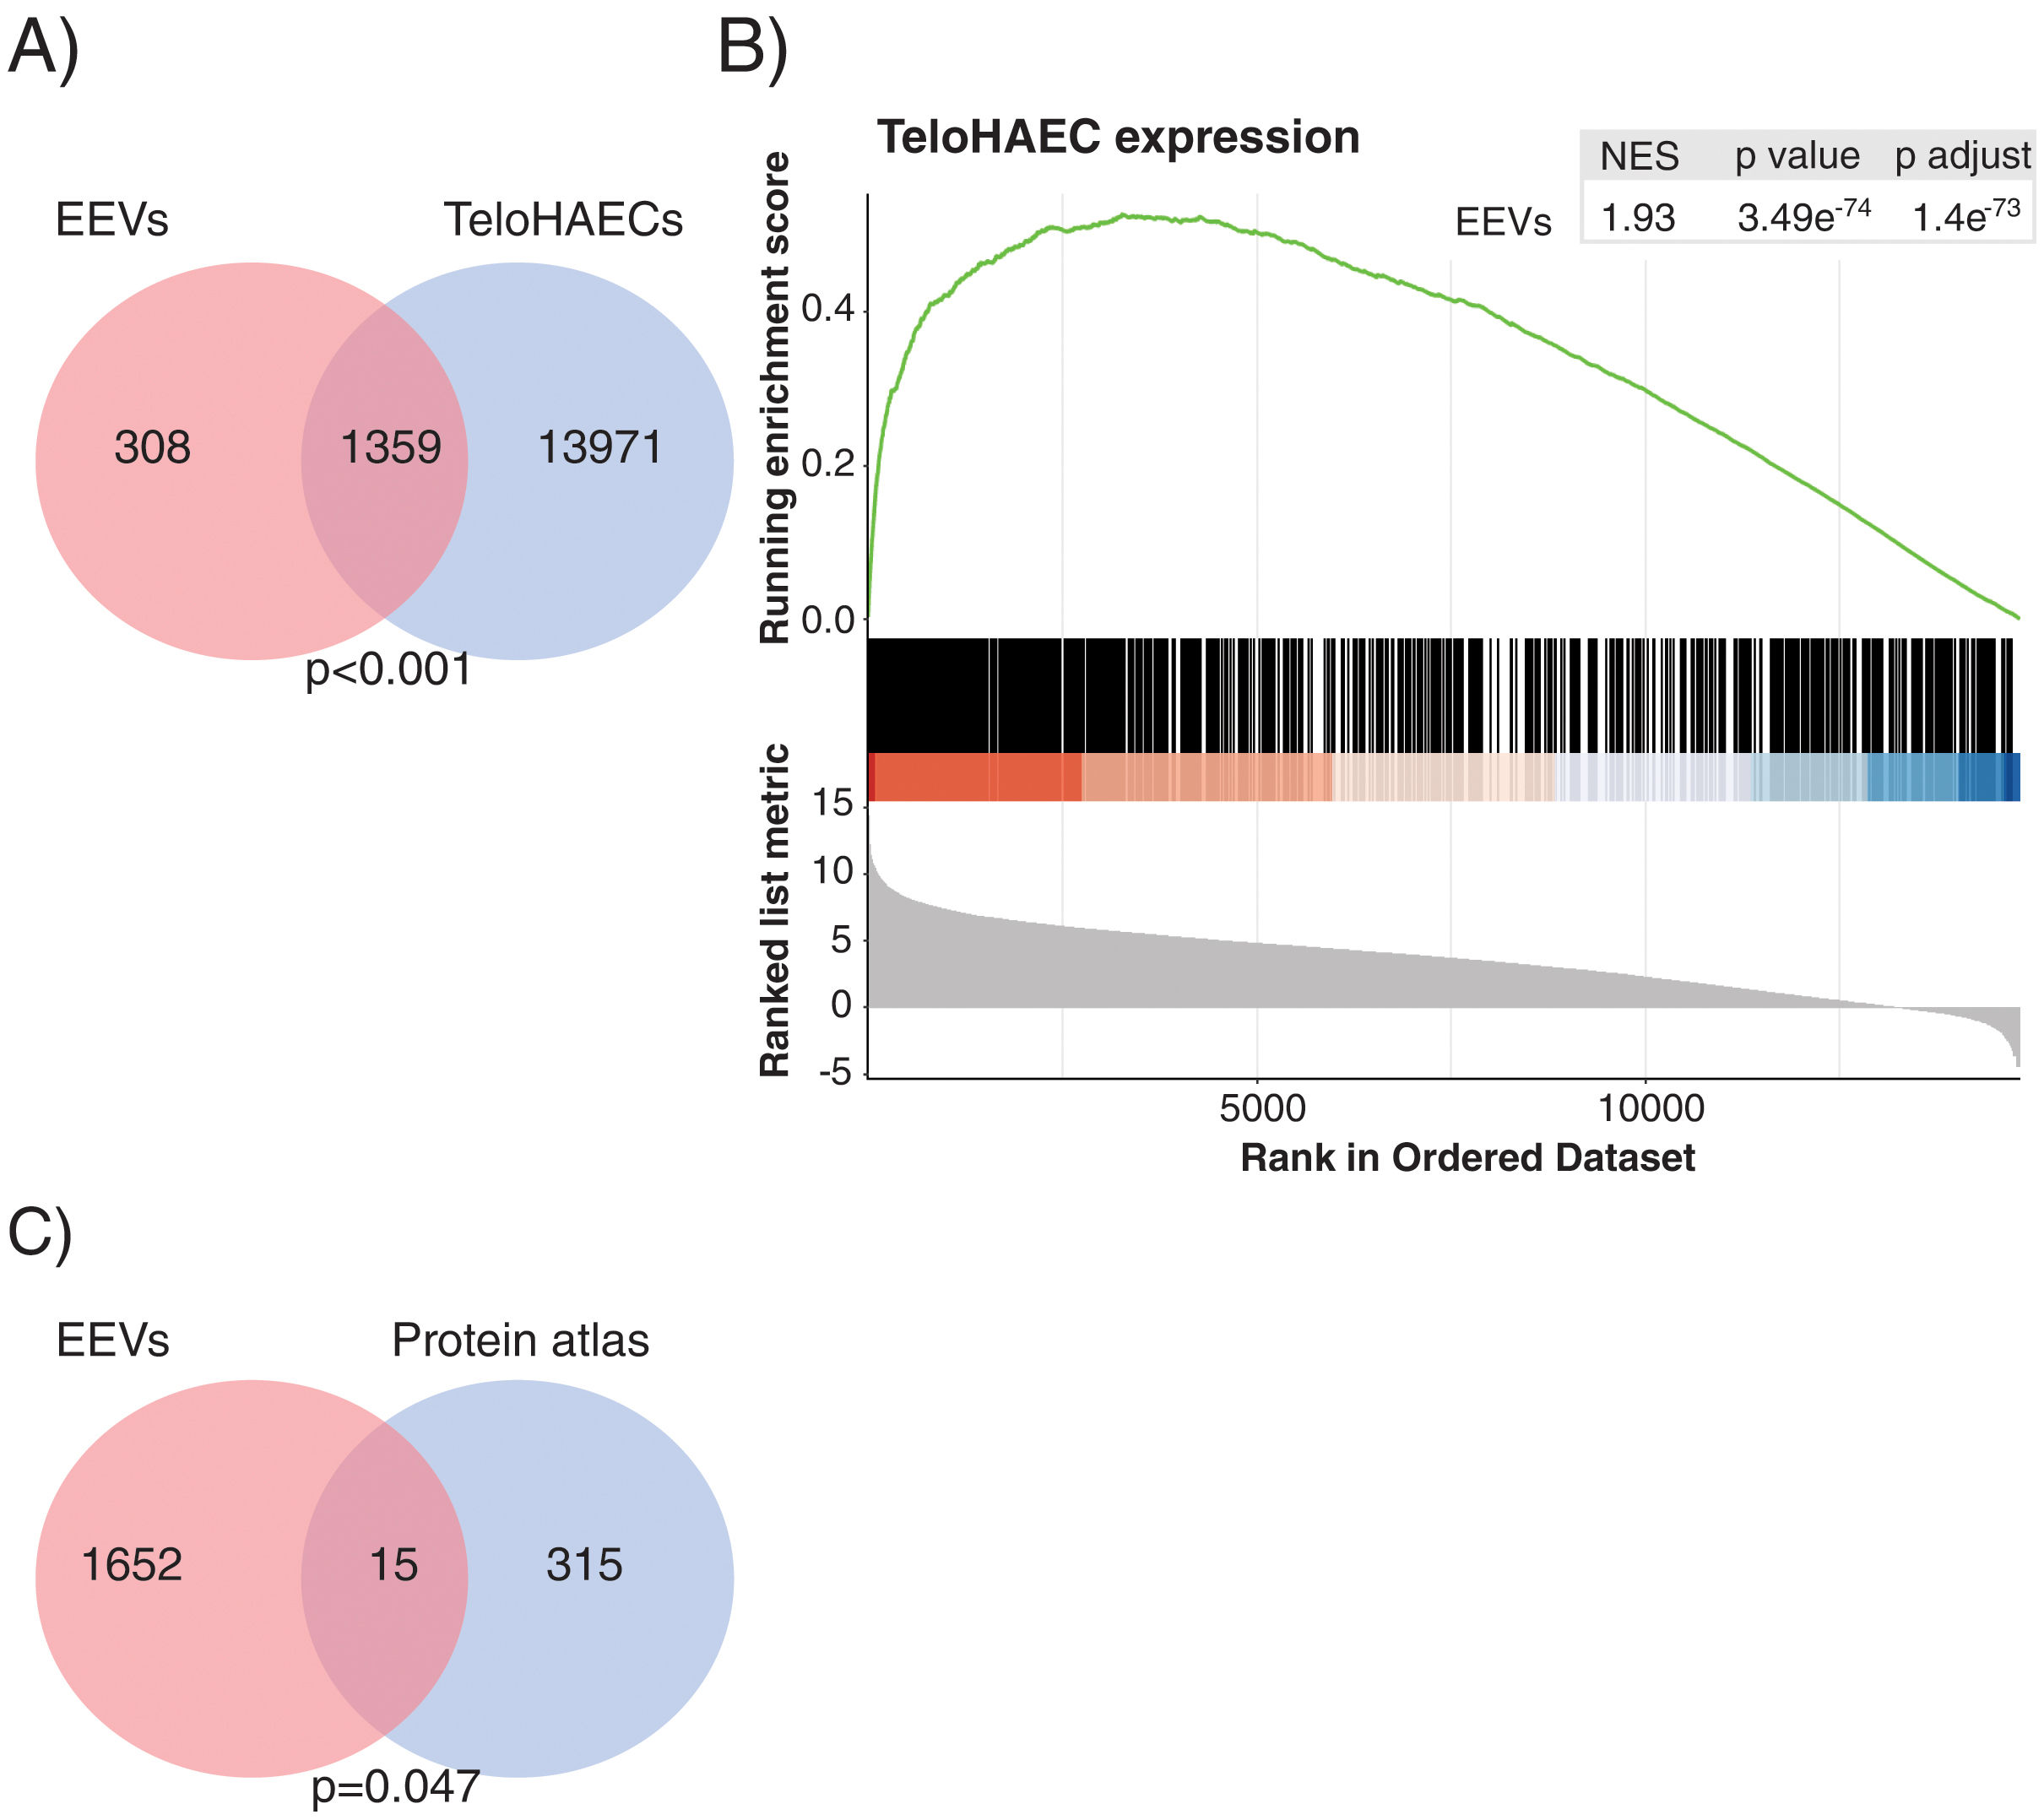
Gene expression analysis by RNASeq detected 1667 transcripts in EEVs (Fig. 3A). Data were analysed to understand whether EEVs transcriptional cargo overlapped with that of ECs. As such, we compared the mRNA content of EEVs with that of unstimulated TeloHAECs in culture. As shown in Fig. 3A, more than 80% of the transcripts present in EEVs were expressed in TeloHAECs (p<0.001). Moreover, gene-set enrichment analysis (GSEA) showed a positive correlation between the expression profile of those overlapping EEVs transcripts and the ranked list of genes for TeloHAECs (Fig. 3B). Similar results were obtained when performing GSEA analysis with endothelial datasets obtained from the gene expression omnibus (GEO) database (GSE163827 and GSE138628, Supplemental Fig. 1). Finally, a hypergeometric test was run to assess the association between the mRNA content of EEVs and the molecular profile categorized as endothelium-specific in the protein atlas containing 331 candidates, identifying a significant coincidence in 15 common genes (SNAI1, PCDH17, GIMAP4, COL15A1, SPARC, TCF4, GNG11, HIF3A, ADAMTS4, SULT1C4, PLEKHG1, FAM107A, PLSCR4, NPR1, HOXD1) supporting the endothelial nature of the immunocaptured EVs (Fig. 3C, p=0.047).
 Venn diagram showing the overlap between the transcriptional profile of TeloHAECs and EEVs. (B) Gene-set enrichment analysis (GSEA) of TeloHAECs. The curve displays the running enrichment score (ES) of EEVs relative to the ranked list of genes in TeloHAECs. The vertical lines in the middle of the figure mark the position of the corresponding genes in the ranked list. Genes on the left of this figure present a positive correlation with the expression in TeloHAECs (log-fold change). The normalized enrichment score (NES) quantifies the enrichment of genes in EEVs relative to the ranked list of genes in TeloHAECs ordered by log-fold change (bottom). (C) Venn diagram showing the coincident genes between the endothelial signature defined in the protein atlas and EEVs (p=0.047).")
The transcriptional profile of EEVs overlapped with that of endothelial cells. (A) Venn diagram showing the overlap between the transcriptional profile of TeloHAECs and EEVs. (B) Gene-set enrichment analysis (GSEA) of TeloHAECs. The curve displays the running enrichment score (ES) of EEVs relative to the ranked list of genes in TeloHAECs. The vertical lines in the middle of the figure mark the position of the corresponding genes in the ranked list. Genes on the left of this figure present a positive correlation with the expression in TeloHAECs (log-fold change). The normalized enrichment score (NES) quantifies the enrichment of genes in EEVs relative to the ranked list of genes in TeloHAECs ordered by log-fold change (bottom). (C) Venn diagram showing the coincident genes between the endothelial signature defined in the protein atlas and EEVs (p=0.047).
We then performed differential gene expression analyses to determine changes in the EEVs mRNA profile of the studied patient subgroups.
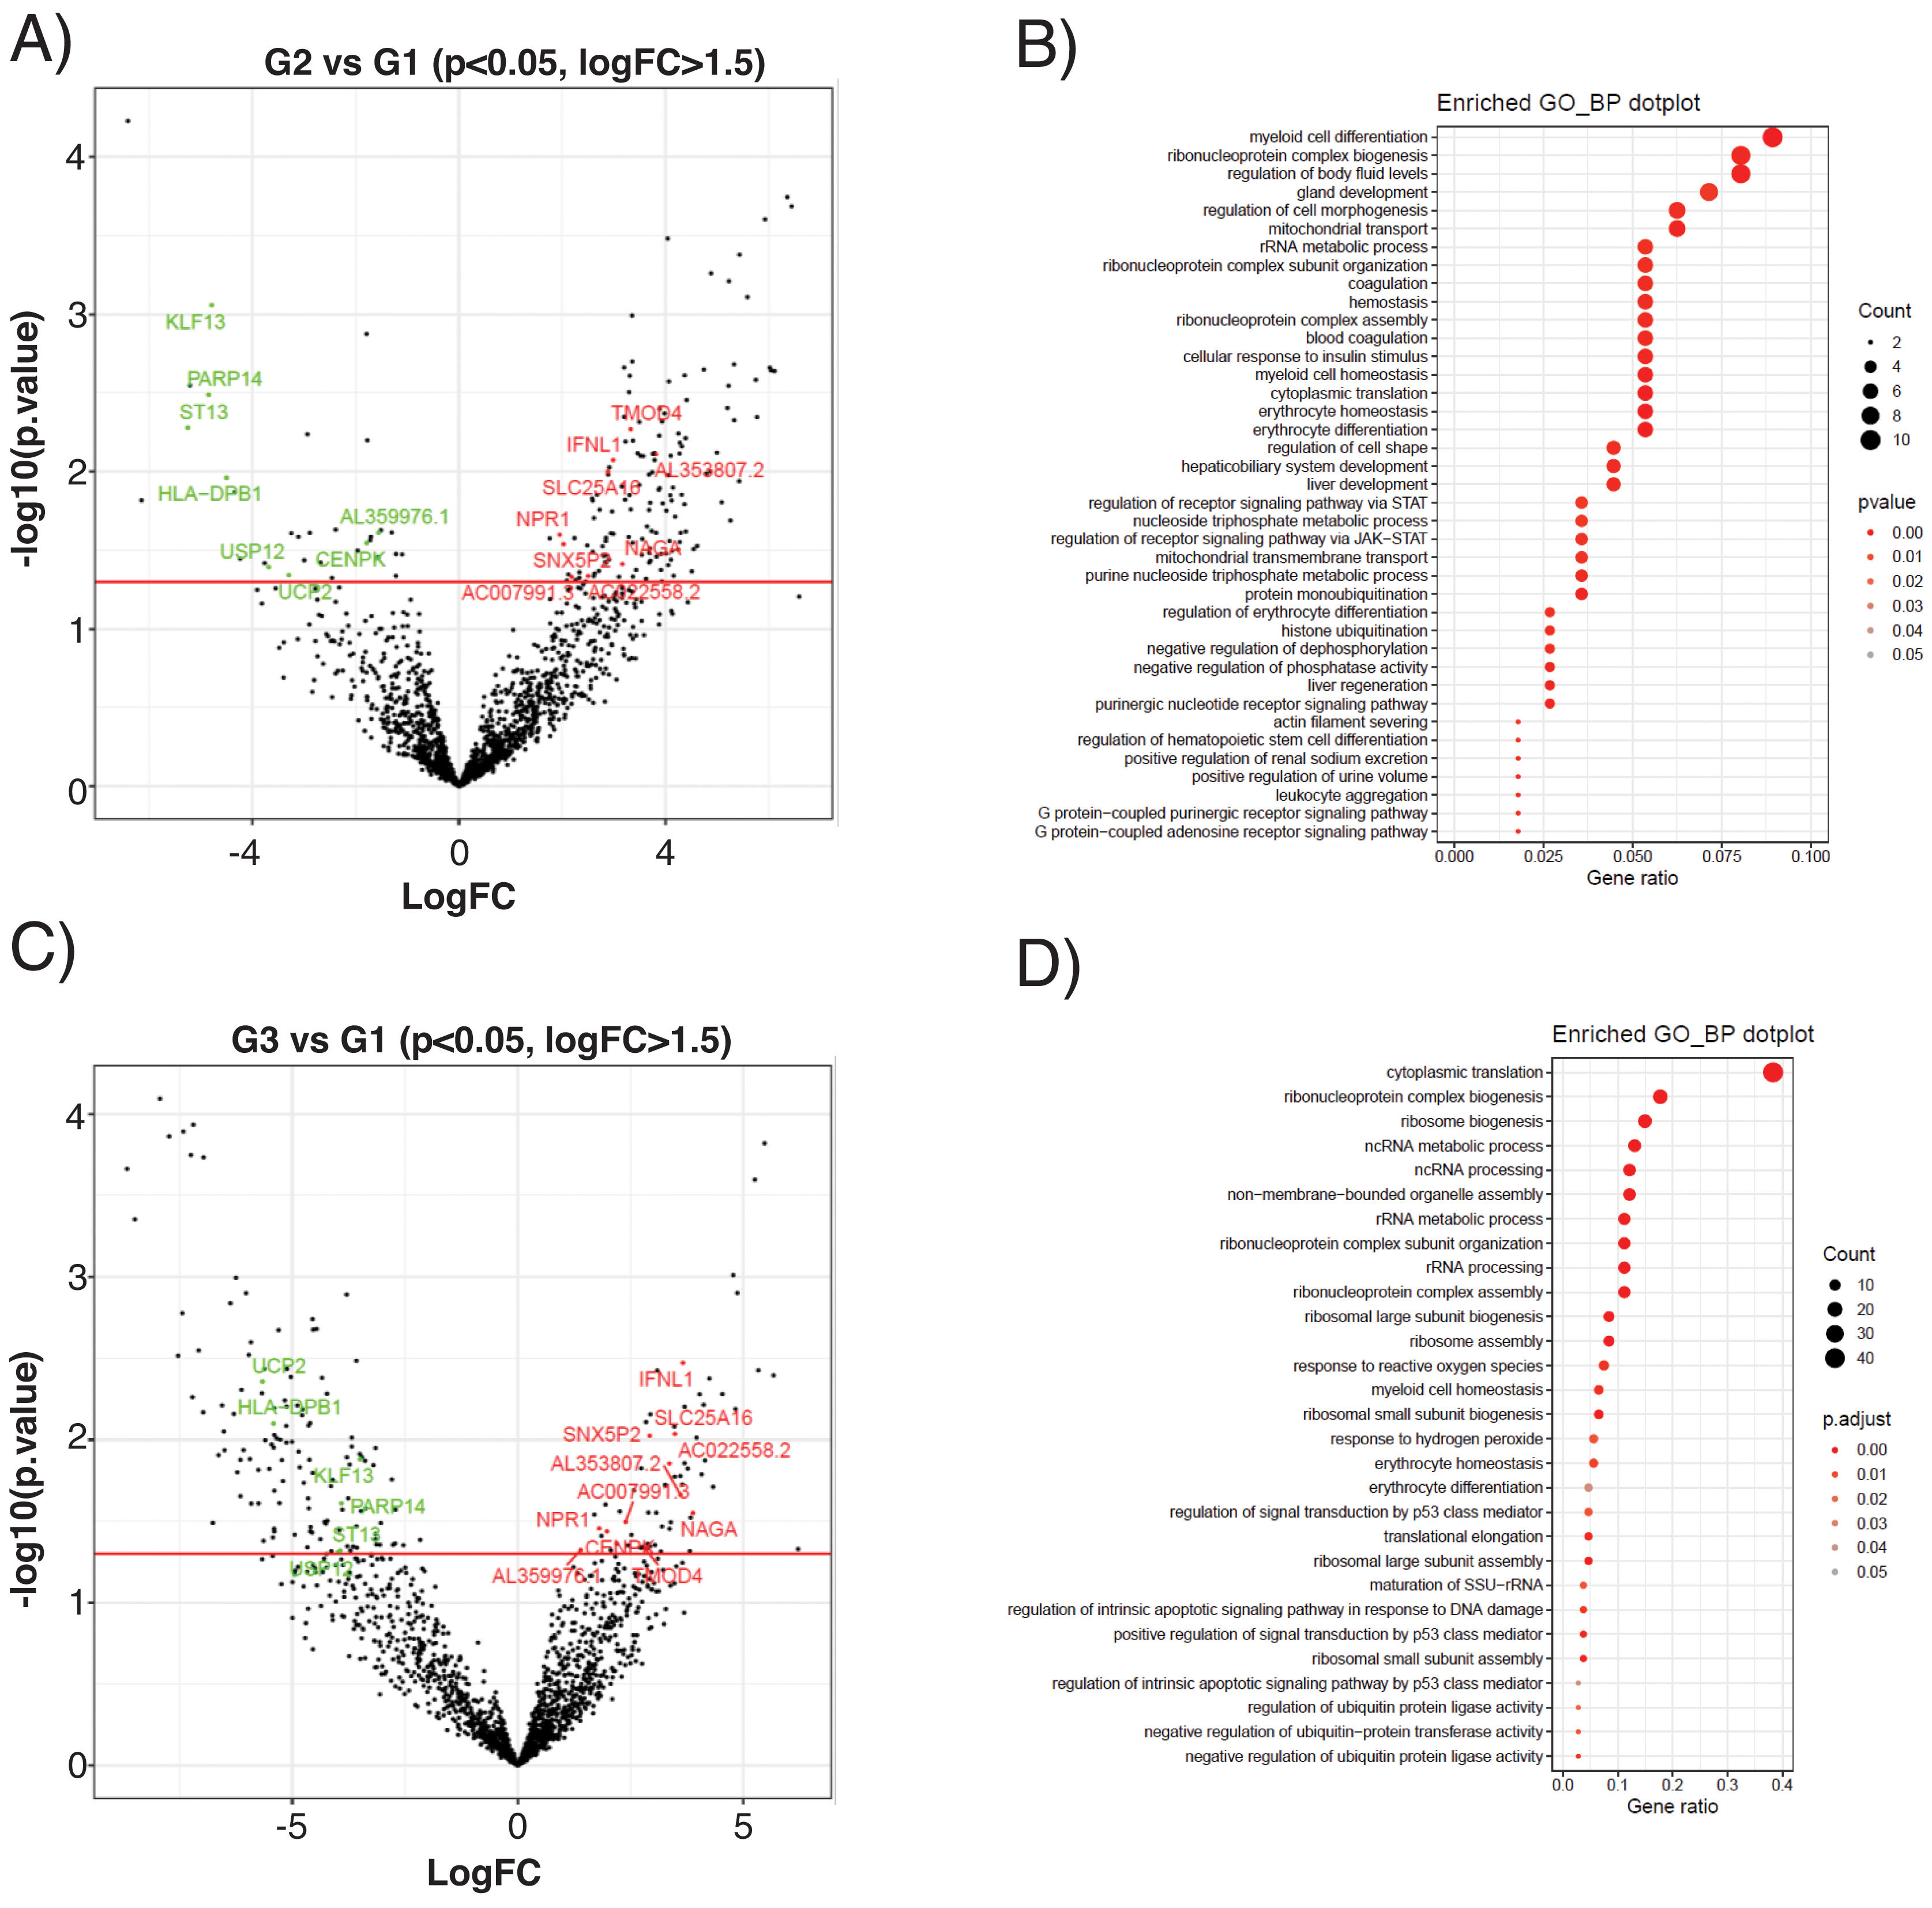
The subclinical atherosclerosis group (G2) presented a differential expression of 177 transcripts compared with G1 control (Fig. 4A), related to myeloid cell homeostasis, ribonucleoprotein biology, mitochondrial transport or coagulation (Fig. 4B). EEVs of PAD patients presented 188 DEG compared with controls (Fig. 4C), that were associated to protein translation processes, response to oxidative stress, cellular homeostasis or apoptosis (Fig. 4D).
, subclinical atherosclerosis (G2) and PAD patients (G3). (A) Volcano plot showing the differentially expressed genes (DEG) of the contrasts performed by LimmaVoom for G2 vs G1. In green those with a fold-change (log2FC) lower than −1.5 and in red the ones with log2FC higher than 1.5 and a p-value <0.05. (B) Gene ontology (GO) analysis for biological processes with the 177 transcripts differentially expressed in G2 vs G1. (C) Volcano plot for the contrasts performed by LimmaVoom for G1 vs G3 to identify DEG. In green those with a log2FC <−1.5 and in red the ones with a log2FC >1.5 and a p-value <0.05. (D) GO analysis for biological processes with the 188 transcripts differentially expressed in G3 vs G1.")
Differential expression analysis of EEVs in control (G1), subclinical atherosclerosis (G2) and PAD patients (G3). (A) Volcano plot showing the differentially expressed genes (DEG) of the contrasts performed by LimmaVoom for G2 vs G1. In green those with a fold-change (log2FC) lower than −1.5 and in red the ones with log2FC higher than 1.5 and a p-value <0.05. (B) Gene ontology (GO) analysis for biological processes with the 177 transcripts differentially expressed in G2 vs G1. (C) Volcano plot for the contrasts performed by LimmaVoom for G1 vs G3 to identify DEG. In green those with a log2FC <−1.5 and in red the ones with a log2FC >1.5 and a p-value <0.05. (D) GO analysis for biological processes with the 188 transcripts differentially expressed in G3 vs G1.
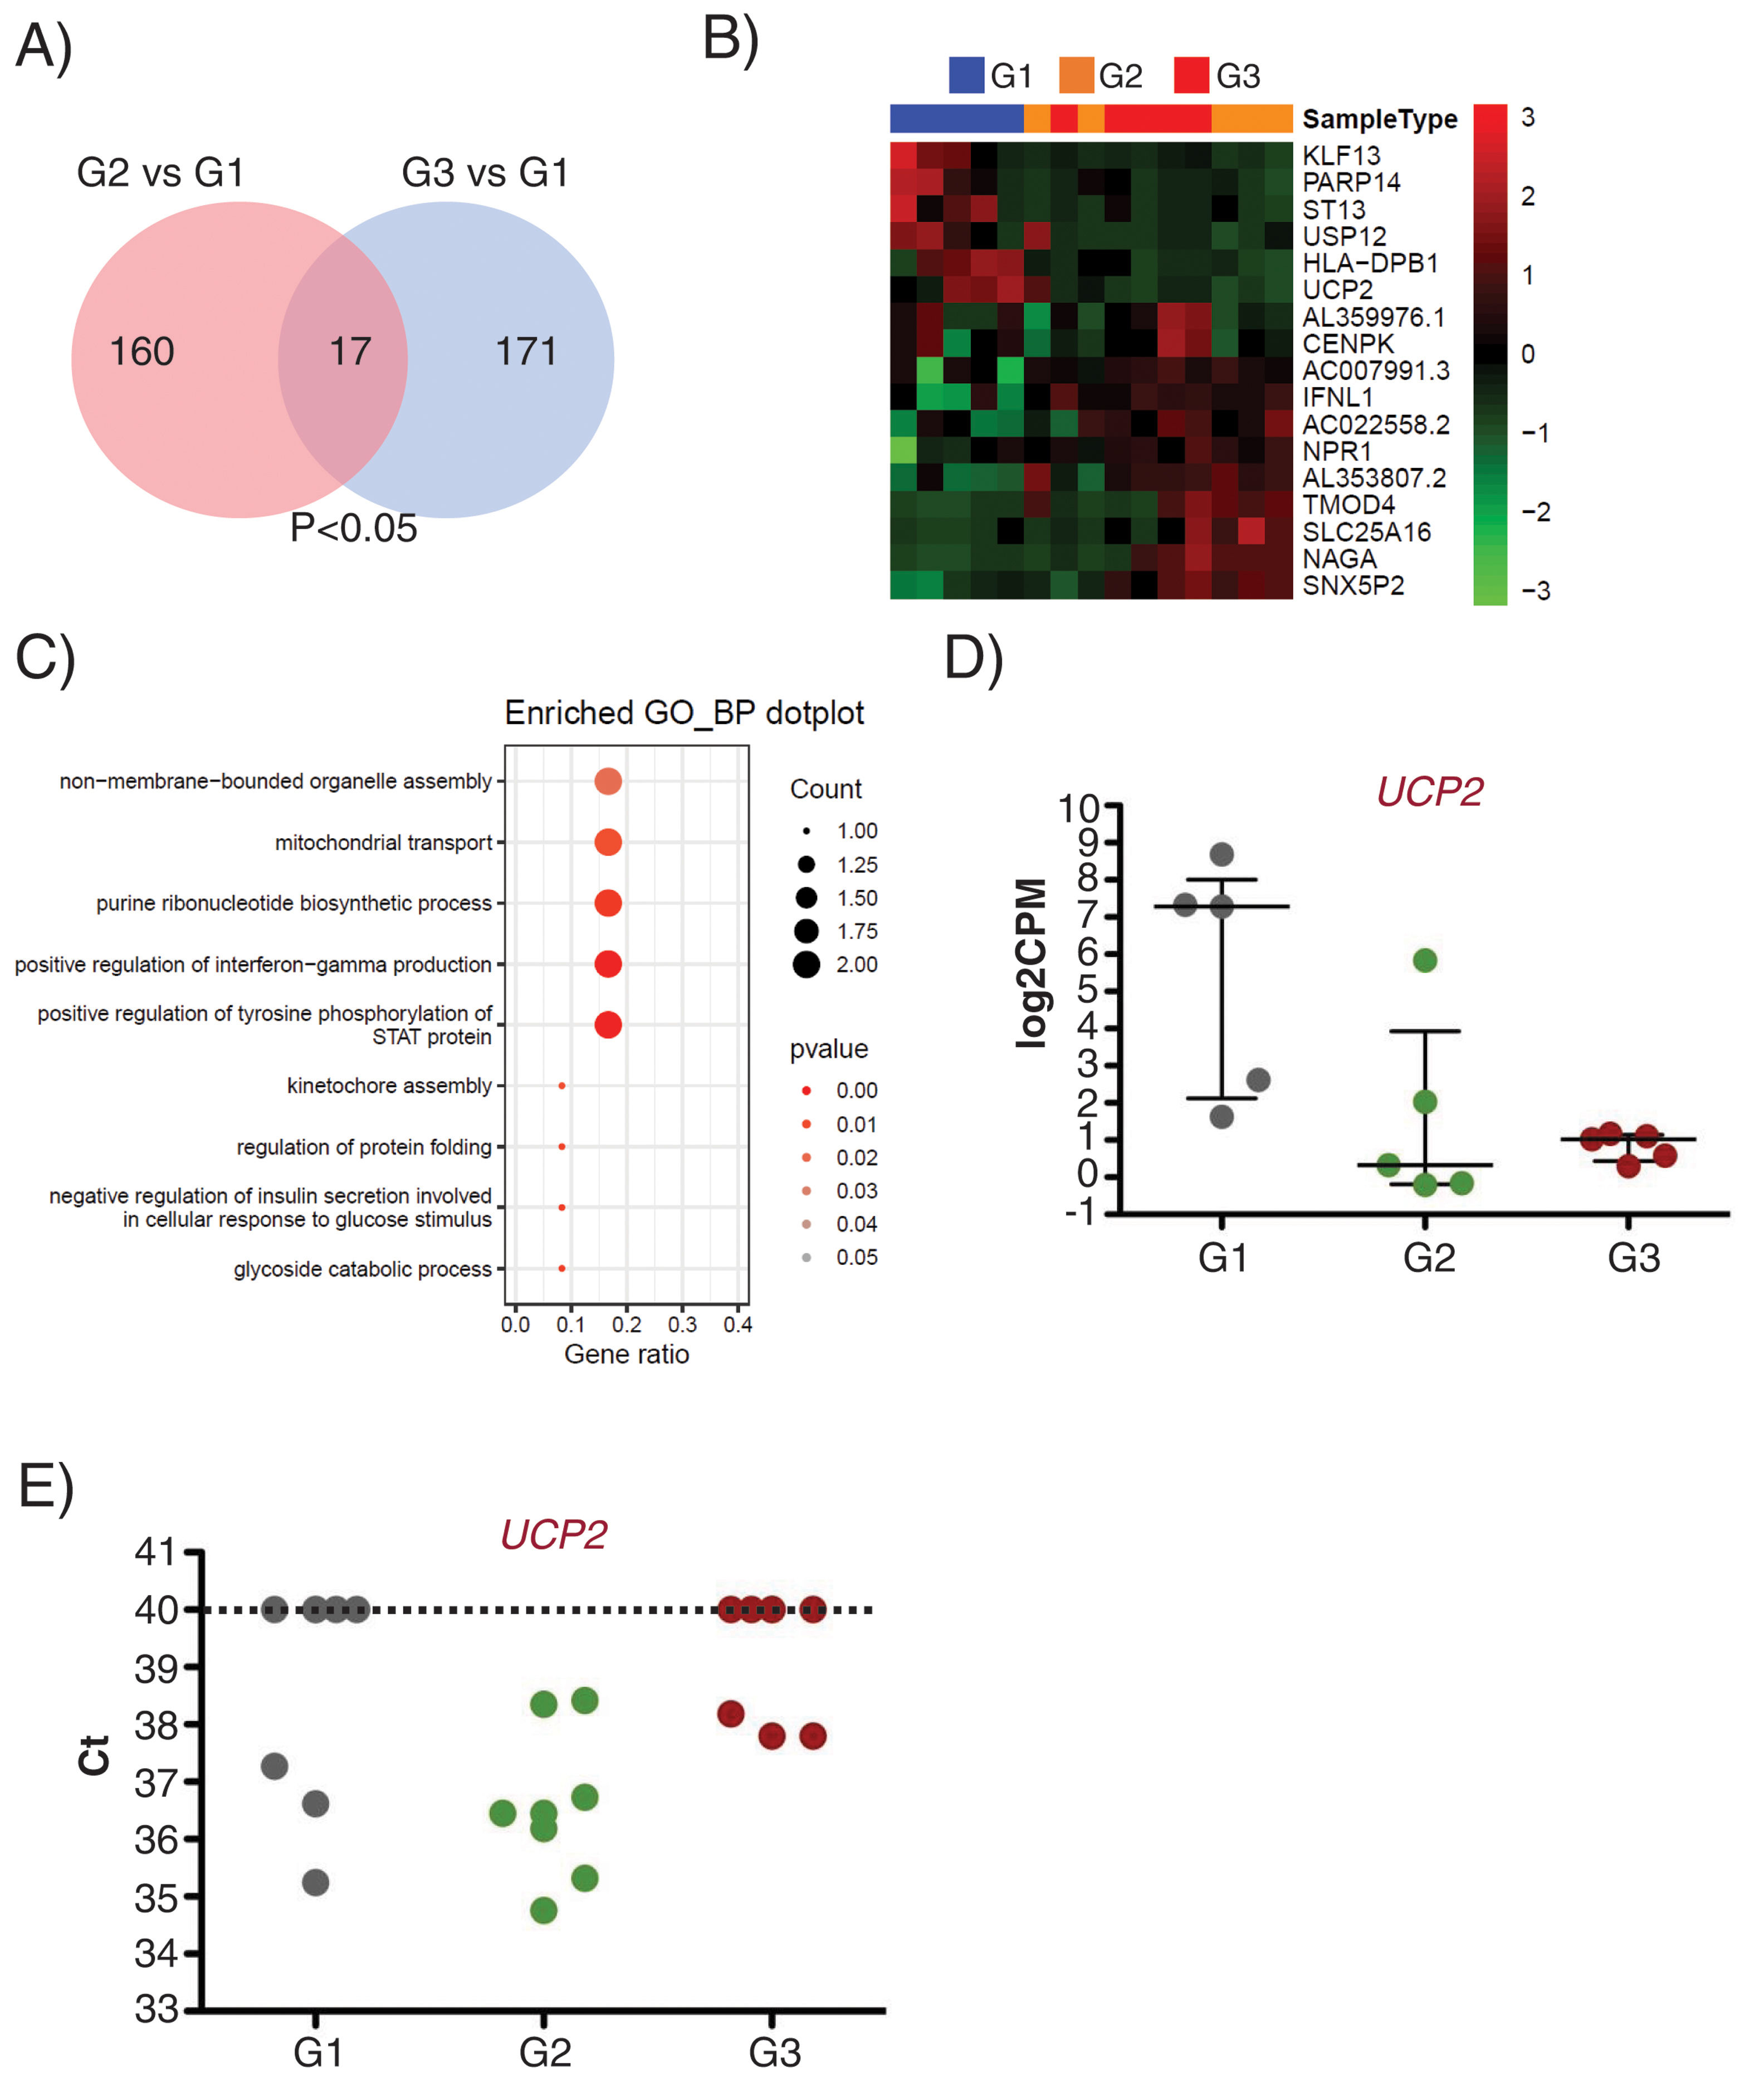
Interestingly, 17 transcripts were found similarly deregulated in G2 and G3 EEVs as compared with G1 (Fig. 5A and B). Gene ontology analysis for these 17 genes identified them as related to organelle assembly, mitochondrial transport, the response to glucose stimulus, cell division, etc. (Fig. 5C).
 Venn diagram showing the number of DEG between G2 (subclinical atherosclerosis) and G1 (control) on the left, and between G3 (peripheral artery disease) and G1 on the right. Seventeen DGEs are common to G2 and G3 vs G1. (B) Hierarchical clustering (Euclidean distance) and heatmap of those 17 DEG (n=5/group). Samples are arranged in columns (G1 blue, G2 orange, G3 red) and genes in rows. Up-regulated expression is shown in red and downregulated expression in green. The heatmap was generated using counts per million expression values (CPM, log2 transformed) after adjustment for sex and age. (C) GO analysis for biological processes with the 17 transcripts differentially expressed in G2 and G3 vs G1. (D) log2CPMs for UCP2 in EEVs of G1, G2 and G3 patients measured by RNASeq. (E) Ct values for UCP2 in EVs from G1, G2 and G3 (n=7/group). Undetected UCP2 transcripts were assigned a Ct of 40.")
UCP2 expression is already deregulated in EVs of subclinical atherosclerosis subjects. A) Venn diagram showing the number of DEG between G2 (subclinical atherosclerosis) and G1 (control) on the left, and between G3 (peripheral artery disease) and G1 on the right. Seventeen DGEs are common to G2 and G3 vs G1. (B) Hierarchical clustering (Euclidean distance) and heatmap of those 17 DEG (n=5/group). Samples are arranged in columns (G1 blue, G2 orange, G3 red) and genes in rows. Up-regulated expression is shown in red and downregulated expression in green. The heatmap was generated using counts per million expression values (CPM, log2 transformed) after adjustment for sex and age. (C) GO analysis for biological processes with the 17 transcripts differentially expressed in G2 and G3 vs G1. (D) log2CPMs for UCP2 in EEVs of G1, G2 and G3 patients measured by RNASeq. (E) Ct values for UCP2 in EVs from G1, G2 and G3 (n=7/group). Undetected UCP2 transcripts were assigned a Ct of 40.
Among the differentially expressed genes, the transcript encoding for the Uncoupling Protein 2 (UCP2), an inner mitochondrial membrane protein with antioxidant activity and associated to atherosclerosis development in vivo,22 displayed a comparable downregulation in G2 and G3 EEVs (Fig. 5D), and was selected for validation.
To corroborate the expression of UCP2 mRNA in EVs, we obtained total EVs by centrifugation of PFP of independent subjects/patients belonging to the same groups (n=7/group). By RT-qPCR, we were able to detect the UCP2 transcript in 62% of the tested EVs samples (13 out of 21) rendering a mean±SD Ct value of 36.85±1.24. When dividing the samples by clinical characteristics, UCP2 was detected in 43% of control (G1) and PAD (G3) samples (3 out of 7 in each group), and on 100% of subclinical atherosclerosis EVs (G2), with a mean±SD Ct value of 36.38±1.03 for controls (n=3), 36.60±1.39 for subclinical atherosclerosis (n=7) and 37.92±0.22 for PAD (n=3, Fig. 5E).
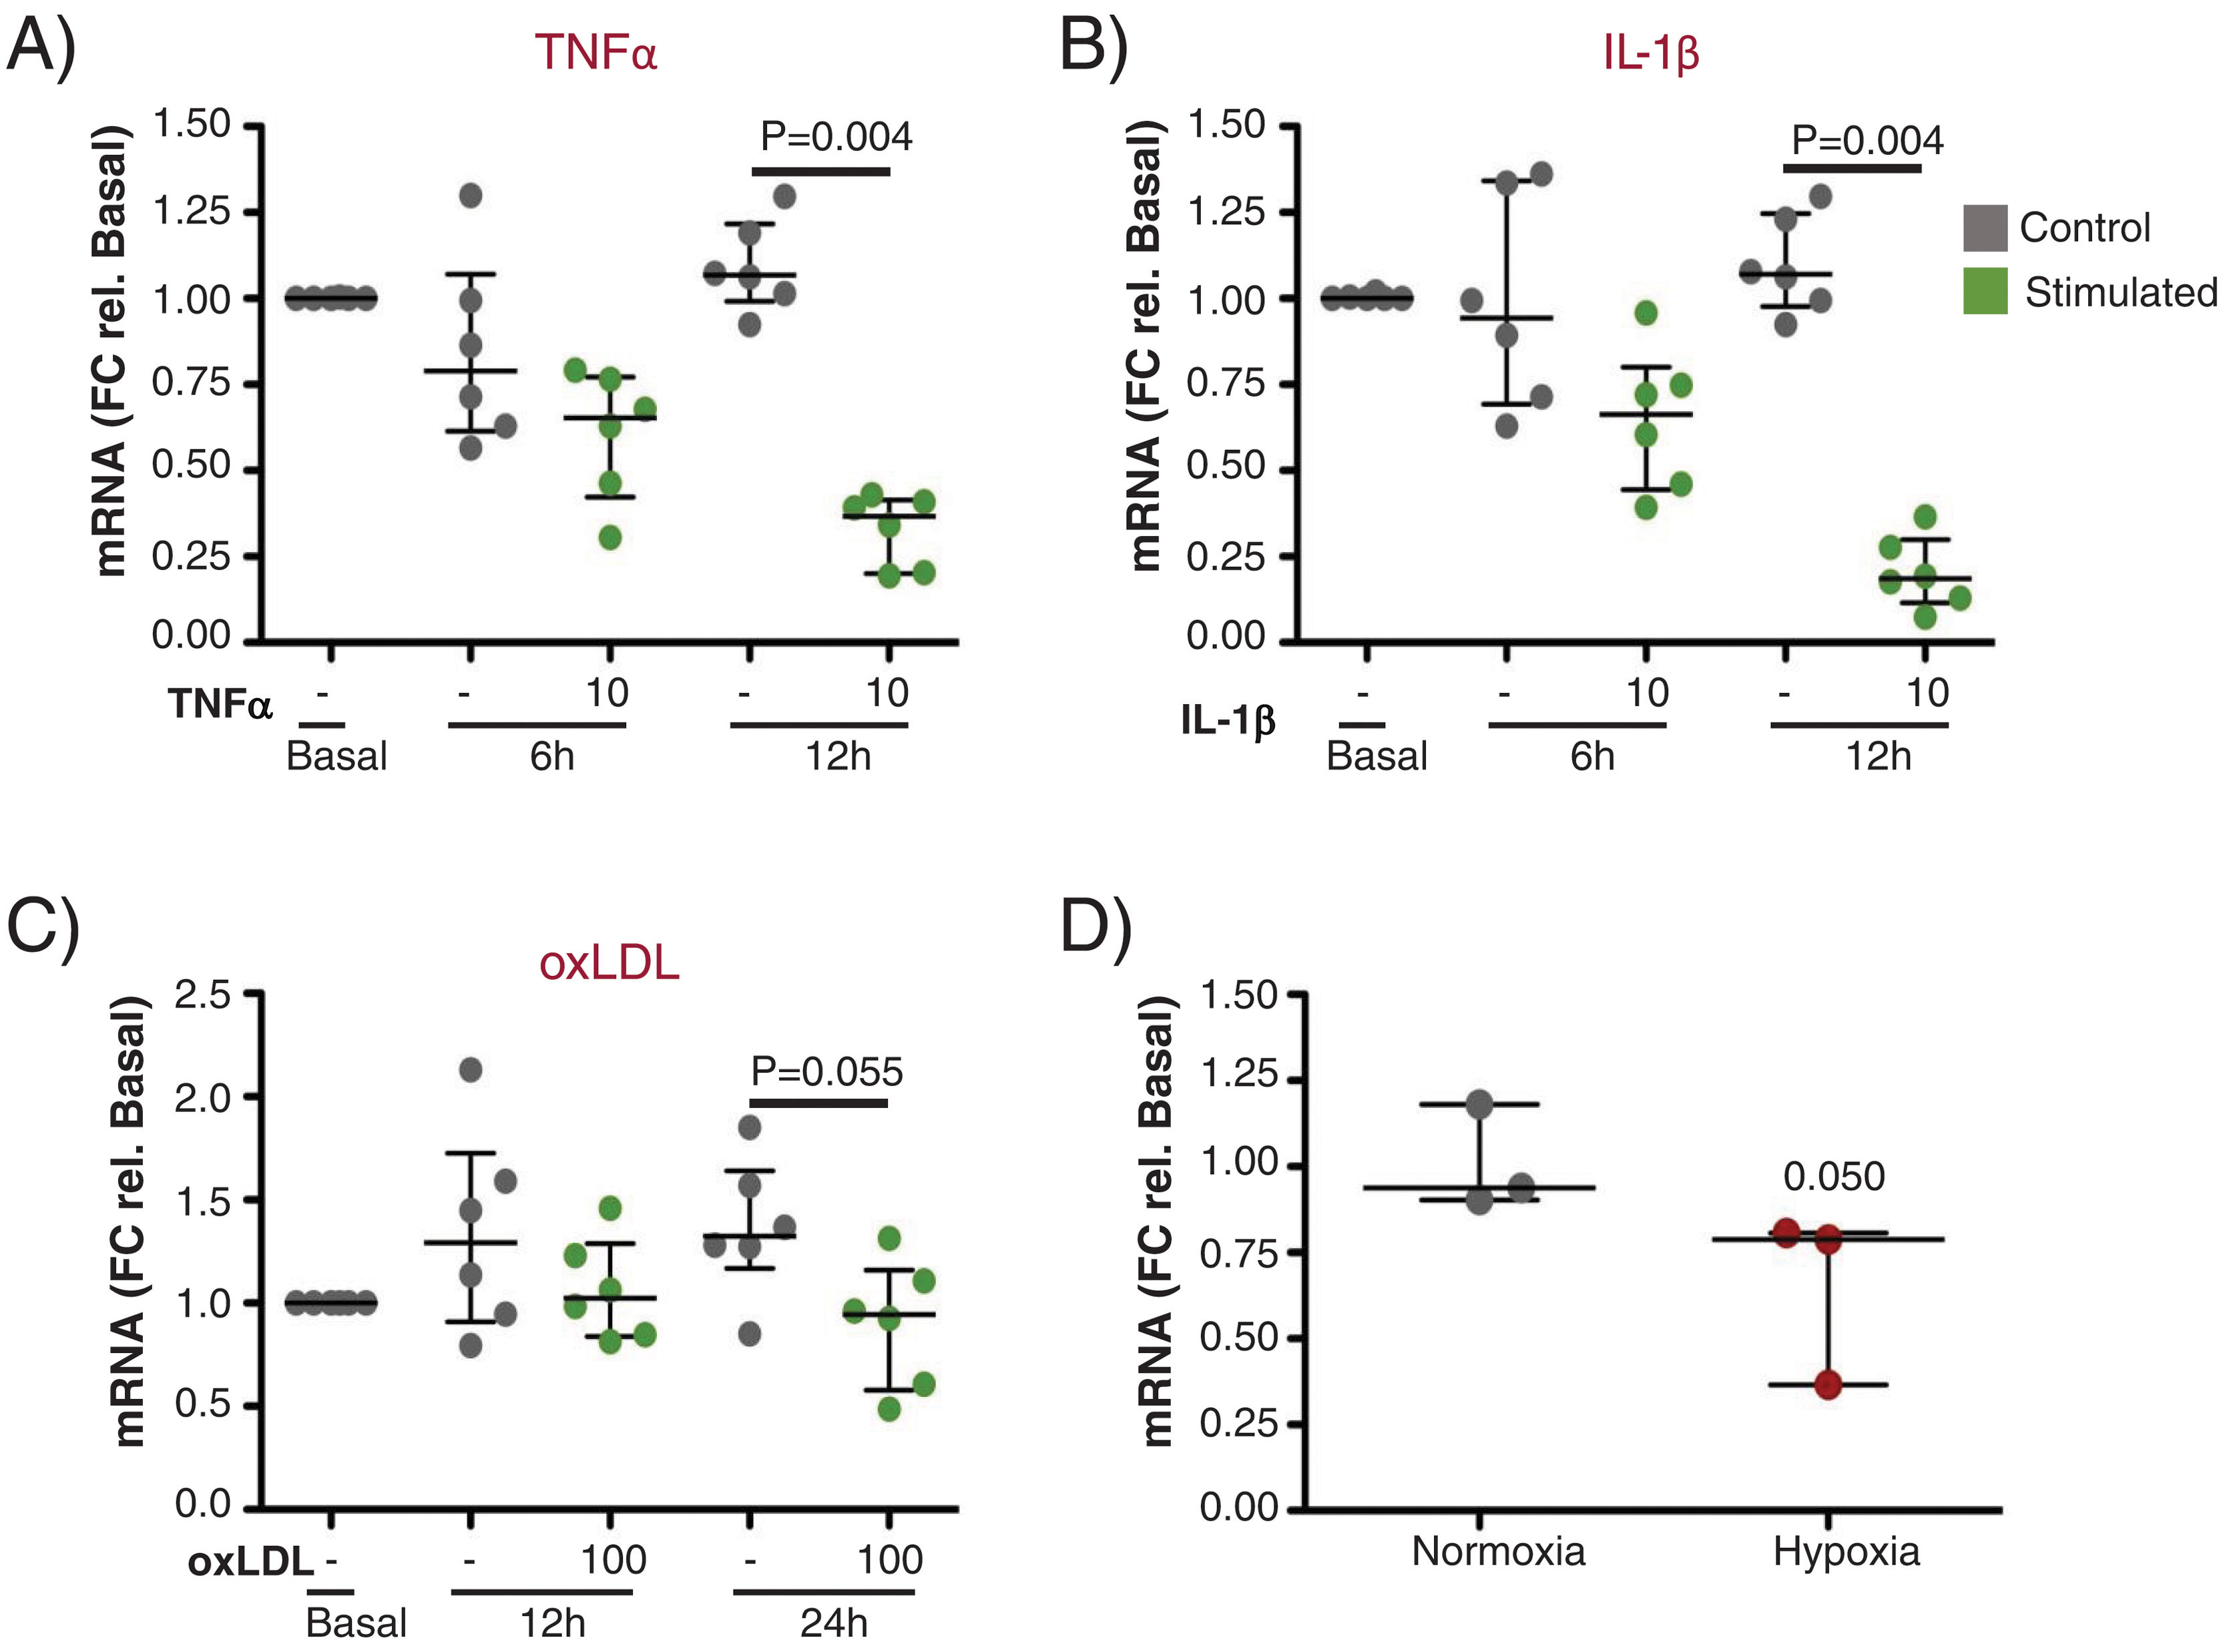
Next, we performed in vitro experiments to assess the expression of UCP2 in ECs before and after stimulation with proinflammatory and atherogenic stimuli (TNFα, IL-1β, oxLDL and hypoxia). As shown in Fig. 6A and B, UCP2 mRNA gradually decreased after TNFα and IL-1β treatment being significantly lowest at 12h (Fig. 6A and B, p<0.01). A similar trend was observed for oxLDL stimulation and hypoxia exposure, rendering lower levels of UCP2 mRNA at 24h (Fig. 6C and D).
 TeloHAECs UCP2 mRNA levels were significantly downregulated 12h after stimulation with either 10ng/mL TNFα (A) or 10ng/mL IL-1β (B) (n=6/condition). (C and D) Endothelial UCP2 expression was reduced 24h after treatment with 100μg/mL oxLDL (n=6/condition) and in hypoxia (1% O2) (n=3/condition).")
Gene expression of UCP2 on endothelial cells in response to proinflammatory and atherogenic stimuli in vitro. (A and B) TeloHAECs UCP2 mRNA levels were significantly downregulated 12h after stimulation with either 10ng/mL TNFα (A) or 10ng/mL IL-1β (B) (n=6/condition). (C and D) Endothelial UCP2 expression was reduced 24h after treatment with 100μg/mL oxLDL (n=6/condition) and in hypoxia (1% O2) (n=3/condition).
In the current study, we set up a protocol for the separation and RNA sequencing of EEVs, and used in vitro models and human plasma to test its applicability. The successful RNA sequencing of EEVs encouraged us to performed a differential expression analysis among the study groups (control, subclinical atherosclerosis and PAD), and the posterior in vitro validation of one of the downregulated genes in atherosclerosis, UCP2. Our in vitro and in vivo results, even if preliminary, point towards a potential utility of the developed methodology for the endothelial liquid biopsy.
EVs are released to the circulation by all vascular cells, and their content reflects their activation state, postulating them as important components of the liquid biopsy.23 In this regard, the transcriptomic analysis of circulating EEVs (endothelial liquid biopsy) might represent a novel and valuable method for the study of the molecular changes induced by the atherogenic process in the endothelial monolayer. To answer this need, we set up the experimental conditions for EEVs separation adapting a protocol of EVs immunocapture described by Cointe et al.,9 using an antibody against CD146. The CD146 antigen is a transmembrane adhesion molecule mainly, but not solely, expressed by ECs, that has been shown to be carried by EEVs, and accordingly accepted as a marker of both ECs and their derived EVs.9,24,25 Despite these previous reports, the lack of specificity of this antigen, reported to be expressed also by other cells types (e.g.: epithelial cells, smooth muscle cells, mesenchymal cells or some tumors among other), lead us to perform some experimental and bioinformatics controls. Likewise, we carried out flow cytometry analysis with the selected anti-CD146 antibody, observing a very efficient labelling of TeloHAECs and their derived EVs. In addition, and to further corroborate the validity of the designed methodology, once EEVs were separated and sequenced, we accomplished several bioinformatics tests comparing the transcriptomic content of EEVs with that of ECs, either from data obtained at the lab, or from public datasets. By these analyses we observed a significant overlap between the transcriptional content of PFP derived EEVs and ECs in culture, as well as an enrichment in genes expressed by different ECs lines. Moreover, 15 of the transcripts detected in EEVs belonged to the molecular signature identified as endothelium-specific in the protein atlas, supporting the endothelial nature of the separated EEVs. In spite of this promising results, considering the low amount of EEVs in circulation (5–15% of the total circulating EVs compared to other subtypes, e.g.: platelet or erythrocyte derived, 50–80% of all EVs),12 the absence of some endothelial markers on the surface of certain EEVs subpopulations, and the lack of specificity of the CD146 antigen, we should contemplate the use of other ECs markers, for instance CD62E or CD144,25,26 or the combination of more than one marker/antibody to enhance the yield and purity of the recovered EEVs. Even though the number of samples per group was low (n=5), the differential expression analysis of EEVs identified 17 genes as deregulated between control and atherosclerotic EEVs (asymptomatic+symptomatic subjects), suggesting an early and steady deregulation of those genes in atherosclerosis. Despite the identification of this molecular signature with the current experimental design, we should expect, that increasing the cases/group would strengthen the biological significance of the data and augment the number of differentially expressed genes among the clinical groups.
Among those 17 genes, UCP2 was consistently decreased in atherosclerosis vs healthy EEVs and was selected for further validation. UCP2 is an anion transporter protein of the inner mitochondrial membrane with antioxidant activity, that reduces reactive oxygen species (ROS) accumulation, maintains the integrity of the mitochondria, and protects membrane lipids, proteins and DNA from damage, preserving cellular health.22 We were able to corroborate UCP2 expression by conventional retrotranscription and qPCR in unsorted plasma EVs of the same clinical groups in spite of the scarce quantity of mRNA within EVs, and in vitro, the stimulation of ECs with proinflammatory (TNFα, Il-1β), and atherogenic stimuli (oxLDL and hypoxia) resulted in a reduction of UCP2 expression. Our results support previous observations relating a decrease in UCP2 with cardiovascular pathologies and endothelial dysfunction.27,28 In atherosclerotic mice, the reduction of UCP2 activity or its deficiency was associated with a greater number of plaques with a more unstable phenotype29,30 and in humans, the −866 G/A polymorphism in the promoter of the gene was associated with subclinical atherosclerosis.31,32 Our data support a protective role of UCP2 in atherosclerosis, although more extensive studies should be design to unravel the mechanism leading to UCP2 deregulation during arterial remodelling.
ConclusionsOur results suggest a potential utility of the methods described in this paper for EEVs transcriptomic analysis and for the identification of early markers of endothelial dysfunction in atherosclerosis, and indicate an early deregulation of UCP2 during atherogenesis.
FundingThe Foundation for Applied Medical Research, Universidad de Navarra (Spain); Sociedad Española de Arteriosclerosis (Beca FEA/SEA 2019 – Clínico Epidemiológica I); Project “PI21/00622”, funded by Instituto de Salud Carlos III (ISCIII) and co-funded by the European Union. The 8-2021 project has received 50% co-financed aid from the European Regional Development Fund through the ERDF 2014-2020 Operational Program of Navarra. This research was supported by CIBER – Consorcio Centro de Investigación Biomédica en Red – Cardiovascular (CB16/11/00483 and CB16/11/00451), Instituto de Salud Carlos III, Ministerio de Ciencia e Innovación.
Conflict of interestsNone to declare.
We want to particularly acknowledge the patients and the Biobank of the Aragon Health System (PT20/00112) integrated in the Spanish National Biobanks Network for their collaboration. We want to thank Lara Montori and Miriam Belzunce for their technical assistance (Laboratory of Atherothrombosis, Cima Universidad de Navarra).
The following are the supplementary data to this article: