There is little evidence of the association between CETP SNPs and obesity and/or related metabolic parameters.
ObjectiveTo analyze the association of the polymorphism rs1800777 of the CETP gene with anthropometric parameters, lipid profile, metabolic syndrome and its components, and adipokine levels in obese subjects without type 2 diabetes mellitus or hypertension.
DesignA population of 1005 obese subjects was analyzed. Electrical bioimpedance was performed, and blood pressure, presence of metabolic syndrome, dietary intake, physical activity, and biochemical tests were recorded.
ResultsNine hundred and sixty eight patients (96.3%) had the GG genotype, 37 patients the GA genotype (3.7%) (no AA genotype was detected). Fat mass (delta: 4.4±1.1kg; p=0.04), waist circumference (delta: 5.6±2.1cm; p=0.02), and waist to hip ratio (delta: 0.04±0.01cm; p=0.01) were higher in A allele carriers than in non-A allele carriers. HDL cholesterol levels were lower in A allele carriers than in non-A allele carriers (delta: 4.2±1.0mg/dL; p=0.04). In the logistic regression analysis, the GA genotype was associated to an increased risk of central obesity (OR 7.55, 95% CI 1.10–55.70, p=0.02) and low HDL cholesterol levels (OR 2.46, 95% CI 1.23–4.91, p=0.014).
ConclusionThe CETP variant at position +82 is associated to lower HDL cholesterol levels, increased fat mass, and central obesity in obese subjects. These results may suggest a potential role of this variant gene in pathophysiology of adipose tissue.
Existen pocas evidencias en relación a la asociación entre los SNP de CETP y la presencia de obesidad y/o parámetros metabólicos relacionados.
ObjetivoExaminar la asociación del polimorfismo (rs1800777) del gen CETP con parámetros antropométricos, perfil lipídico, presencia de síndrome metabólico y sus diferentes componentes y los niveles de adipocitoquinas en sujetos con obesidad sin diabetes mellitus ni hipertensión.
DiseñoSe analizó una población de 1.005 sujetos con obesidad. Se registró una bioimpedancia, presión arterial, presencia de síndrome metabólico, ingesta dietética, ejercicio físico y parámetros bioquímicos.
ResultadosNovecientos sesenta y ocho pacientes (96,3%) tuvieron el genotipo GG y 37 pacientes presentaron el genotipo GA (3,7%) (no se detectó genotipo AA). La masa grasa (delta: 4,4±1,1kg; p=0,04), circunferencia de la cintura (delta: 5,6±2,1cm; p=0,02), relación cintura-cadera (delta: 0,04±0,01cm; p=0,01) fueron mayores en los portadores del alelo A. El colesterol HDL fue menor en los portadores del alelo A (delta: 4,2±1,0mg/dl; p=0,04). En el análisis de regresión logística la presencia del alelo A se asoció con un mayor riesgo de obesidad central (OR: 7,55; IC 95%: 1,10-55,70; p=0,02) y un mayor riesgo de colesterol HDL bajo (OR: 2,46; IC 95%: 1,23-4,91; p=0,014).
ConclusiónLa variante CETP en la posición +82 se asocia a unos niveles más bajos de colesterol HDL, a un mayor porcentaje de masa grasa y obesidad central en personas con obesidad. Estos resultados podrían sugerir un posible papel de esta variante en la fisiopatología del tejido adiposo.
An inverse and independent association between HDL cholesterol (HDL-C) concentration and risk of cardiovascular disease has been demonstrated.1 HDL concentrations were predictive of cardiovascular events even in statin-treated individuals with LDL cholesterol concentrations<70mg/dl.2 Two proteins that play important roles in HDL metabolism are ATP-binding cassette transporters A1 (ABCA1) and cholesteryl ester transfer protein (CETP). CETP participates in HDL metabolism by facilitating the transfer of cholesteryl esters from HDL to ApoB-containing lipoproteins in exchange for triglycerides being transferred to HDL.3 The relationship of CETP single nucleotide polymorphisms (SNPs) with HDL-cholesterol concentrations has been extensively demonstrated.4–9 A CETP polymorphism (rs1800777) located in the coding region of the gene has been previously studied. The minor allele of this SNP appears at a low frequency in general population (2–7%).10–11 The A allele of this SNP has been associated with lower HDL-cholesterol concentrations10 and higher CETP activity.11 Furthermore, this SNP has been related to increase carotid intimal-medial wall thickness12 and higher coronary calcium.
Although role of low HDL-cholesterol in cardiovascular disease is well known, other factors are strongly involved in the atherosclerotic processes.14 These factors include high blood pressure, high triglyceride levels, hyperglycaemia, and obesity. Many of these risk factors are the ones that make up the so-called syndrome X or metabolic (MS).15–17
Although CETP is important for the metabolism of HDL, and CETP SNPs are known to be associated with differences in HDL-cholesterol concentrations,13 association of CETP SNPS with anthropometric parameters, insulin resistance, metabolic syndrome and adipokine levels have not been previously reported.
In the current investigation, we examined the association of the polymorphism (rs1800777) of CETP gene on obesity anthropometric parameters, lipid profile, metabolic syndrome and adipokines in subjects with obesity.
Subjects and methodsSubjects and recruitmentA population of 1005 obese Caucasian subjects (body mass index ≥30) and non-diabetic patients was cross-sectional analyzed. Subjects were prospectively recruited by consecutive sampling among patients with obesity send from Primary Care Physicians to Hospital Clinico Universitario Valladolid (HCUVA). All participants provided informed consent to a protocol approved by the local ethical review boards. This study was conducted according to the guidelines laid down in the Declaration of Helsinki. All procedures involving patients were approved by the Hospital Clinico Universitario Valladolid (HCUVA) ethics committee. Subjects were excluded if had history of cardiovascular disease during the previous 24 months, history of cancer undergoing active treatment, weight loss of more than 5% of body weight in the past 6 months, total cholesterol≥200mg/dl, triglycerides≥250mg/dl, blood pressure≥140/90mmHg, as well as the use of metformin, sulfonylurea, dypeptidil type IV inhibitors drugs, thiazolidinedions, insulin, glucocorticoids, antineoplasic agents, angiotensin receptor blockers, angiotensin converting enzyme inhibitors, psychoactive medications, estrogens, testosterone, statins and other antidyslipidemic drugs.
ProcedureAll patients with a 2 weeks weight-stabilization period before recruitment were enrolled. Weight, blood pressure, basal glucose, c-reactive protein (CRP), insulin, insulin resistance (HOMA-IR), total cholesterol, LDL-cholesterol, HDL-cholesterol, triglycerides blood and adipokines (leptin, adiponectin, resistin) levels were measured in all subjects. A bioimpedance and a prospective serial assessment of nutritional intake by 3 days written food records were realized. To estimate the prevalence of Metabolic Syndrome, the definitions of the ATPIII was considered.17 The cutoff points for the criteria used are three or more of the following; central obesity (waist circumference >88cm in females and >102cm in males), hypertriglyceridemia (triglycerides >150mg/dl or specific treatment), (HDL cholesterol <50mg/dl in women and <40mg in men), hypertension (systolic BP>130mmHg or diastolic BP>85mmHg or specific treatment) or fasting plasma glucose >110mg/dl or drug treatment for elevated blood glucose. Genotype of CETP receptor gene polymorphism was studied.
Analytical proceduresPlasma glucose levels were determined by using an automated glucose oxidase method (Glucose analyser 2, Beckman Instruments, Fullerton, CA). Insulin was measured by radioimmunoassay (RIA) (RIA Diagnostic Corporation, Los Angeles, CA) with a sensitivity of 0.5mUI/L (normal range 0.5–30mUI/L)18 and the homeostasis model assessment for insulin sensitivity (HOMA-IR) was calculated using these values.19 CRP was measured by immunoturbimetry (Roche Diagnostis GmbH, Mannheim, Germany), with a normal range of (0–7mg/dl) and analytical sensitivity 0.5mg/dl. Serum total cholesterol and triglyceride concentrations were determined by enzymatic colorimetric assay (Technicon Instruments, Ltd., New York, NY, USA), while HDL cholesterol was determined enzymatically in the supernatant after precipitation of other lipoproteins with dextran sulphate-magnesium. LDL cholesterol was calculated using Friedewald formula.20
Adiponectin was measured by ELISA (R&D systems, Inc., Minneapolis, USA) with a sensitivity of 0.246ng/ml and a normal range of 8.65–21.43ng/ml.21 Leptin was measured by ELISA (Diagnostic Systems Laboratories, Inc., TX, USA) with a sensitivity of 0.05ng/ml and a normal range of 10–100ng/ml.22 Resistin was measured by ELISA (Biovendor Laboratory, Inc., Brno, Czech Republic) with a sensitivity of 0.2ng/ml with a normal range of 4–12ng/ml.23
GenotypingOligonucleotide primers and probes were designed with the Beacon Designer 5.0 (Premier Biosoft International®, LA, CA). The polymerase chain reaction (PCR) was carried out with 50ng of genomic DNA, 0.5μL of each oligonucleotide primer (primer forward: 5′-ACGTTGGATGCTCTTCGACATCATCAACCC-3′ and reverse 5′-ACGTTGGATGAATCCTGTCTGGGCCTCTCT-3′ in a 2μL final volume (Termociclador Life Tecnologies, LA, CA). DNA was denaturated at 95°C for 3min; this was followed by 50 cycles of denaturation at 95°C for 15s, and annealing at 61.3°C for 45s). The PCR were run in a 25μL final volume containing 12.5μL of IQTM Supermix (Bio-Rad®, Hercules, CA) with hot start Taq DNA polymerase Hardy Weimberg equilibrium was assessed with a statistical test (Chi-square) to compare our expected and observed counts. The variant were in Hardy-Weinberg equilibrium (p=0.13).
Anthropometric procedures and blood pressureWaist (narrowest diameter between xiphoid process and iliac crest) and hip (widest diameter over greater trochanters) circumferences to derive waist-to hip ratio (WHR) were measured, too. Body weight was measured to an accuracy of 0.1kg and body mass index computed as body weight/(height2). Tetrapolar body electrical bioimpedance was used to determine body composition with an accuracy of 5g.24 An electric current of 0.8mA and 50kHz was produced by a calibrated signal generator (EFG, Akern, It) and applied to the skin using adhesive electrodes placed on right-side limbs. Resistance and reactance were used to calculate total body water, fat and fat-free mass. Blood pressure was measured twice after a 10min rest with a random zero mercury sphygmomanometer (Omrom, Los Angeles, CA, USA), and averaged.
Dietary intake and habitsAll enrolled subjects received instruction to record their daily dietary intake for three days including a weekend day in order to adjust our result by dietary intakes. Handling of the dietary data was by means of a personal computer equipped with personal software, incorporating use of food scales and models to enhance portion size accuracy. Records were reviewed by a dietician and analyzed with a computer-based data evaluation system (Dietsource®, Gen, Swi). This software used National composition food tables as a reference.25 Physical activity (minutes per week) was assessed by the International test of Physical activity.26
Statistical analysisSample size was calculated to detect differences over 2.5mg/dl in HDL-cholesterol with 90% power and 5% significance (n=1000). The results were expressed as average±standard deviation. The distribution of variables was analyzed with Kolmogorov–Smirnov test. Quantitative variables with normal distribution were analyzed with a two-tailed Student's-t test. Non-parametric tests were used in non-normal variables. Qualitative variables were analyzed with the chi-square test, with Yates correction as necessary, and Fisher's test. Logistic regression analyses adjusted by age, sex, dietary intake (kcal/day), enolic habit, smoking habit and exercise were used to calculate OR and 95% confidence interval (CI) to estimate the association of the rs1800777 SNP with the risk of MS and its individual components (A allele carriers vs. non A allele carriers). The statistical analysis was performed for the combined GA and AA as a group and GG genotype as second group, with a dominant model. A p-value under 0.05 was considered statistically significant bilateral. Software package used was SPSS 19.0 (IL, USA).
ResultsOne thousand and five obese subjects gave informed consent and were enrolled in the study. Mean age of the study cohort was 47.3±9.1 years and mean BMI was 36.7±5.1. All subjects were weight stable during the 2 weeks period preceding the study (body weight change, 0.13±0.1kg). Nine hundred and sixty eight patients (96.3%) had the genotype GG and 37 patients GA (3.7%) (no AA genotype was detected). Age was similar in both genotype groups (GG; 47.8±9.6 years vs GA; 47.1±7.8 years: p=0.17). Sex distribution was similar in different genotype groups (GG; 27.3% males vs 72.7% females vs GA; 18.9% males vs 81.1% females: p=0.23).
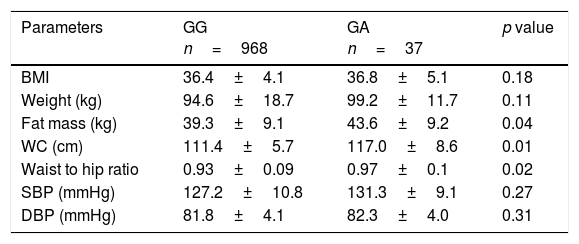
Non significant differences in BMI were found between subjects with the GA and AA genotypes. However, A allele carriers showed higher fat mass (delta: 4.4±1.1kg; p=0.04), waist circumference (delta: 5.6±2.1cm; p=0.02) and waist to hip ratio (delta: 0.04±0.01cm; p=0.01)than non-A allele carriers (Table 1). No significant differences in blood pressure were observed between groups.
Anthropometric variables and blood pressure.
| Parameters | GG n=968 | GA n=37 | p value |
|---|---|---|---|
| BMI | 36.4±4.1 | 36.8±5.1 | 0.18 |
| Weight (kg) | 94.6±18.7 | 99.2±11.7 | 0.11 |
| Fat mass (kg) | 39.3±9.1 | 43.6±9.2 | 0.04 |
| WC (cm) | 111.4±5.7 | 117.0±8.6 | 0.01 |
| Waist to hip ratio | 0.93±0.09 | 0.97±0.1 | 0.02 |
| SBP (mmHg) | 127.2±10.8 | 131.3±9.1 | 0.27 |
| DBP (mmHg) | 81.8±4.1 | 82.3±4.0 | 0.31 |
BMI: body mass index; DBP, diastolic blood pressure; SBP, systolic blood pressure; WC, waist circumference.
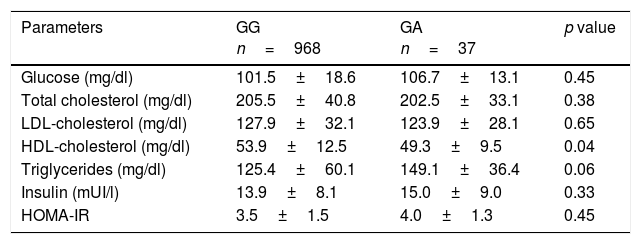
A allele carriers presented with lower HDL-cholesterol levels (delta: 4.2±1.0mg/dl; p=0.04) and non significant statistical trend to higher triglyceride levels (p=0.06). No significant differences between groups in fasting plasmatic glucose, total cholesterol, LDL cholesterol or HOMA-IR were observed (Table 2).
Biochemical parameters (mean±SD).
| Parameters | GG n=968 | GA n=37 | p value |
|---|---|---|---|
| Glucose (mg/dl) | 101.5±18.6 | 106.7±13.1 | 0.45 |
| Total cholesterol (mg/dl) | 205.5±40.8 | 202.5±33.1 | 0.38 |
| LDL-cholesterol (mg/dl) | 127.9±32.1 | 123.9±28.1 | 0.65 |
| HDL-cholesterol (mg/dl) | 53.9±12.5 | 49.3±9.5 | 0.04 |
| Triglycerides (mg/dl) | 125.4±60.1 | 149.1±36.4 | 0.06 |
| Insulin (mUI/l) | 13.9±8.1 | 15.0±9.0 | 0.33 |
| HOMA-IR | 3.5±1.5 | 4.0±1.3 | 0.45 |
HOMA-IR (homeostasis model assessment). HDL: high density lipoprotein; LDL: low density lipoprotein.
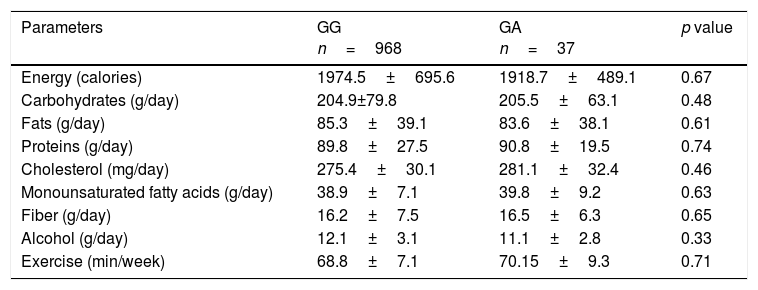
Nutritional intake and physical activity were similar in both groups (Table 3).
Dietary intakes and exercise (mean±SD).
| Parameters | GG n=968 | GA n=37 | p value |
|---|---|---|---|
| Energy (calories) | 1974.5±695.6 | 1918.7±489.1 | 0.67 |
| Carbohydrates (g/day) | 204.9±79.8 | 205.5±63.1 | 0.48 |
| Fats (g/day) | 85.3±39.1 | 83.6±38.1 | 0.61 |
| Proteins (g/day) | 89.8±27.5 | 90.8±19.5 | 0.74 |
| Cholesterol (mg/day) | 275.4±30.1 | 281.1±32.4 | 0.46 |
| Monounsaturated fatty acids (g/day) | 38.9±7.1 | 39.8±9.2 | 0.63 |
| Fiber (g/day) | 16.2±7.5 | 16.5±6.3 | 0.65 |
| Alcohol (g/day) | 12.1±3.1 | 11.1±2.8 | 0.33 |
| Exercise (min/week) | 68.8±7.1 | 70.15±9.3 | 0.71 |
No statistical differences between genotype groups.
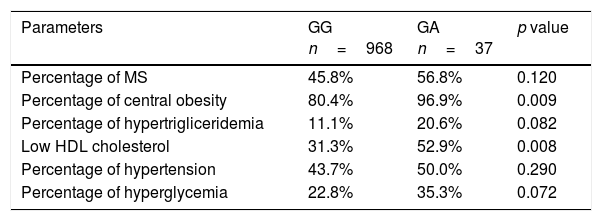
According to the results of anthropometric and biochemical characteristics, the percentage of individuals who had MetS was 46.2% (n=464). The percentage of subjects with MetS or some criteria of MetS (central obesity, hypertriglyceridemia, low-HDL cholesterol, hypertension or hyperglycemia) are shown in Table 4. In the logistic regression A-allele was independently associated with an increased probability of met MS central obesity criteria (OR 7.55, 95% CI 1.10–55.70, p=0.02) and MS low HDL-cholesterol criteria (OR 2.46, 95% CI 1.23–4.91, p=0.014) after adjusting by age, sex, dietary intake (kcal/day), enolic habit, smoking habit and physical activity levels. The association with the other MS criteria was non-significant – hypertriglyceridemia (OR 2.10, 95% CI 0.88–4.89, p=0.09), hyperglycaemia (OR 1.85, 95% CI 0.91–3.79, p=0.09) and hypertension (OR 1.29, 95% CI 0.65– 2.55, p=0.38). Metabolic syndrome as an all entity was not associated with genotype (OR 1.51, 95% CI 0.82–1.12, p=0.23).
Metabolic syndrome (MS) and individual components of MS.
| Parameters | GG n=968 | GA n=37 | p value |
|---|---|---|---|
| Percentage of MS | 45.8% | 56.8% | 0.120 |
| Percentage of central obesity | 80.4% | 96.9% | 0.009 |
| Percentage of hypertrigliceridemia | 11.1% | 20.6% | 0.082 |
| Low HDL cholesterol | 31.3% | 52.9% | 0.008 |
| Percentage of hypertension | 43.7% | 50.0% | 0.290 |
| Percentage of hyperglycemia | 22.8% | 35.3% | 0.072 |
The cutoff points for the criteria of; central obesity (waist circumference >88cm in female and >102 in male), hypertension (systolic blood pressure>130mmHg or diastolic blood pressure>85mmHg or specific treatment), hypertriglyceridemia (triglycerides>150mg/dl or specific treatment) or hyperglycemia (fasting plasma glucose>110mg/dl or drug treatment for elevated blood glucose). MS: metabolic syndrome.
Table 5 shows levels of adipocytokines. No between groups statistical significant differences were detected in leptin, resistin or adiponectin levels.
Serum adipokine levels and C reactive protein (mean±SD).
| Parameters | GG n=968 | GA n=37 | p value |
|---|---|---|---|
| Resistin (ng/dl) | 5.2±1.1 | 5.9±1.3 | 0.67 |
| Adiponectin (ng/dl) | 21.5±10.4 | 13.8±14.4 | 0.45 |
| Leptin (ng/dl) | 62.6±26.4 | 75.5±30.4 | 0.70 |
| CRP (ng/dl) | 5.8±3.8 | 6.5±2.9 | 0.44 |
CRP: C reactive protein. No statistical differences between genotype groups.
The main finding of this study was that the SNP (rs1800777) of the CETP gene was associated not only with HDL-cholesterol levels but also with fat mass and waist circumference in obese subjects.
The main objective of this cross-sectional study was to investigate the association of CETP rs1800777 polymorphism with lipid profile, metabolic syndrome and cardiovascular risk factors. We observed an adverse effect of A allele at position +82 on HDL cholesterol levels and anthropometric parameters. A allele carriers exhibited higher fat mass, waist circumference and waist to hip ratio and lower HDL-cholesterol levels than non A allele carriers. Accordingly A allele carriers showed higher probability of met low HDL-cholesterol and abdominal obesity criteria for MS. No significant association between rs1800777 polymorphism and fasting plasmatic glucose, triglycerides, blood pressure or insulin resistance markers was observed.
In our study frequency of minor allele was very low (3.7%). This low frequency, however, is similar to that have been reported in previous studies (2–7%).10–11
We, as previously others, observed a significant association between rs1800777 polymorphisms and HDL levels but a lack of association with triglycerides or LDL-cholesterol levels. Previous studies demonstrated that common CETP genotypes decrease CETP activity by approximately 5–10% and change HDL-cholesterol levels by 3–5% whereas its association with LDL-cholesterol and triglycerides levels was negligible.26 Our data is also in agreement with a recent published meta-analysis in which the effect of 6 CETP genotypes including rs1800777 was revised (26). This meta-analysis suggested that individuals with minor alleles presented decreased HDL-cholesterol levels. One limitation of this analysis is the lack of control for lifestyle factors in all the including original studies.26 This fact could be a bias in the observed association. Inclusion of environmental determinants of HDL-cholesterol levels (i.e. alcohol, exercise and dietary fat intake) is therefore an important strength of our study which reinforces the association between rs1800777 and HDL cholesterol levels.
Association between rs1800777 and HDL particles subtypes and cardiovascular disease has also been described in cross-sectional studies. For example, Tsai et al. reported that A allele of rs1800777 polymorphism was associated with lower large HDL concentrations and measures of subclinical cardiovascular disease including coronary artery calcium (CAC) and carotid intimal-medial thickness.13,27,28
The relationship between rs1800777SNP and adiposity markers has seldom been reported. We found increased fat mass and increased abdominal obesity in A allele carriers as compared with non A allele carriers. Importantly, this association seems to be independent of BMI. Of note no significant differences in BMI were observed between both groups. As far as we know only one previous study has assessed the relationship between rs1800777 and adiposity markers. This study analyzed four SNPs (one of them rs1800777) and their putative role in a weight loss intervention in adolescents.29 A combined model including this SNP turned up to explain up to 24% of BMI-SD change after 10 weeks of the intervention. Although, study participants were younger than in our study, the authors identified a significant association between rs1800777 SNP and adiposity parameters, both at the beginning and after dietary intervention. Unfortunately the association between rs1800777 SNP and waist circumference was not reported.
The exact molecular mechanism responsible for biological effects of rs1800777 SNP on obesity (fat mass, waist circumference and waist to hip ratio) remains to be elucidated. It could be possible that this SNP influenced visceral adipose tissue deposition through genetic linkage with other genes. However, further studies are needed to confirm the association between rs1800777 SNP and adiposity and to evaluate mechanisms involved in this association.
Finally, the relation of rs1800777 with metabolic syndrome and the different MS components has not been previously reported. As expected according findings discussed above, we identified an increased odds for met the waist circumference and HDL criteria in A-carriers as compared with non-A carriers. Nonetheless, no significant association between rs1800777 and fasting plasmatic glucose, triglycerides or blood pressure was identified.
Our study has several limitations. First, there are many uncontrolled non-genetic factors that could influence the relationship between rs1800777 and anthropometric and metabolic parameters (hormone status, type of exercise, etc.), none of which were taken into account in the present study. Second, HDL-particles subtypes were not analyzed. Third, we only analyzed one SNP of CETP gene. Fourth we selected subjects with obesity without other metabolic co-morbidities. This approach allowed us to exclude subjects on pharmacological treatment for type 2 diabetes, dyslipidemia or blood pressure but make conclusions not applicable to broad obese populations. Finally, our population was a sample of adult obese patients. We cannot exclude the possibility that age and or body mass index range modulate the relation of this genetic variant with MetS and its individual components.
In conclusion, our results show an association between this CETP variant at position +82 and HDL cholesterol, fat mass and central obesity. Our results should be replicated in future studies in other populations.
Compliance with ethical standardsNo funding.
Ethical approvalAll procedures performed in studies involving human participants were in accordance with the ethical standards of the institutional and/or national research committee and with the 1964 Helsinki declaration and its later amendments or comparable ethical standards.
Authors’ contributionD. de Luis designed and wrote the article. R. Aller designed the study and realized statistical analysis. O. Izaola realized anthropometric evaluation and control of dietary intake. D. Primo realized biochemical evaluation and genotype. A. Ortola realized nutritional evaluation. E. Gomez realized nutritional evaluation. J.J. Lopez realized biochemical evaluation.
Informed consentInformed consent was obtained from all individual participants included in the study.
Conflicts of interestThere is no conflict of interest.


