


The aim of this study was to ascertain the prevalence of carbohydrate changes in patients diagnosed with acromegaly, and to evaluate what happens two years after treatment. It was also intended to assess which factors are associated to the occurrence of such changes.
Material and methodsSixty-six patients diagnosed with acromegaly at our center were enrolled and divided into groups with normal glucose metabolism, prediabetes, and diabetes. After 2 years of treatment of acromegaly, prevalence carbohydrate changes was assessed again depending on the patient condition (cured, controlled with medical treatment, or uncontrolled).
ResultsAt the time of diagnosis of acromegaly, 27.3% of the patients had diabetes (n=18), 39.4% had prediabetes (n=26), and 33.3% had no changes (n=22). Significant differences were found in IGF-1 and z-score of IGF-1 (median of 18.1 in diabetics and 10.6 in non-diabetics, p=0.005).
Two years after treatment, there was a significant decrease in the prevalence of diabetes and prediabetes in cured patients (from 29.2% to 8.3% and from 45.8% to 16.7%, respectively, p=0.003), but not in patients controlled with medical treatment or not controlled.
ConclusionAt our center, 66.6% of patients with acromegaly had changes in carbohydrate metabolism at diagnosis, with a prevalence of diabetes of 27.3%. Two years after treatment of acromegaly, prevalence of diabetes and prediabetes decreased in cured patients.
El objetivo de este estudio es conocer la prevalencia de alteraciones hidrocarbonadas en pacientes diagnosticados de acromegalia y evaluar qué ocurre a los 2 años del tratamiento. También se pretende valorar qué factores se asocian a la aparición de estas alteraciones.
Material y métodosSe incluyeron 66 pacientes diagnosticados de acromegalia en nuestro centro. Se clasificó a los pacientes en función del metabolismo glucémico: normal, prediabetes y diabetes. A los 2 años del tratamiento de la acromegalia se analizó de nuevo la prevalencia de alteraciones hidrocarbonadas, en función del estado del paciente (curado, controlado con tratamiento médico o no controlado).
ResultadosAl diagnóstico de acromegalia, el 27,3% de los pacientes tenían diabetes (n=18), el 39,4% prediabetes (n=26) y el 33,3% no presentaba alteraciones (n=22). Se encontraron diferencias significativas en los niveles de IGF-1 y z-score de IGF-1 (mediana de 18,1 en diabéticos y 10,6 en no diabéticos, p=0,005) entre los 3 grupos.
A los 2 años del tratamiento, se observa una importante reducción de la prevalencia de diabetes y prediabetes en los pacientes curados (del 29,2 al 8,3% y del 45,8 al 16,7% respectivamente, p=0,003) pero no en los pacientes controlados con tratamiento médico o no controlados.
ConclusiónEn nuestro centro, el 66,6% de los pacientes con acromegalia presentan alteraciones en el metabolismo hidrocarbonado al diagnóstico, con una prevalencia de diabetes del 27,3%.
A los 2 años del tratamiento de la acromegalia, se objetiva un descenso de la prevalencia de diabetes y prediabetes en el grupo de pacientes curados.
Acromegaly is caused by the chronic excessive and inappropriate production of growth hormone (GH), in most cases secondary to the presence of a hypophyseal adenoma. The disease is commonly associated with alterations in carbohydrate metabolism ranging from altered basal glycemia to diabetes with important insulin requirements.1–3 According to various studies, the prevalence of diabetes in acromegaly varies between 20 and 55%.4–9 Such variability may be due to differences in age, race and the duration of acromegaly prior to diagnosis. In turn, the prevalence of altered basal glycemia and glucose intolerance ranges from 16 to 46%.4–9
Insulin resistance at hepatic and peripheral level generated by GH appears to be the mechanism underlying this blood glucose-elevating effect, along with an increase in glucose production on the part of the liver.10–12 A number of studies have also described a certain degree of insulinopenia that could contribute to the development and maintenance of hyperglycemia.13
Different factors have been associated with the appearance of carbohydrate alterations in patients with acromegaly, though consistent findings have only been obtained in the case of patient age.4,14
Insulin resistance and diabetes are known risk factors for cardiovascular disease, which is more prevalent and causes greater mortality among patients with acromegaly compared with healthy individuals.14–16 On the other hand, the treatment of acromegaly improves glycemic control and reduces cardiovascular risk.17,18
The present study was carried out to determine the prevalence of alterations in carbohydrate metabolism among patients diagnosed with acromegaly in Navarre (Spain), and to assess the factors that favor the appearance of diabetes and prediabetes in these individuals. In addition, an analysis was made of the evolution of these alterations two years after treatment for acromegaly, according to whether cure of the disease was achieved, control was achieved with medical treatment, or the disease was not controlled.
Material and methodsWe included all the patients diagnosed with acromegaly secondary to a GH-secreting hypophyseal adenoma in the Complejo Hospitalario de Navarra during the period 1980–2014. The protocols of our center regarding access to case histories and data publication were followed in carrying out the study.
The diagnosis was established in individuals with compatible clinical manifestations and elevated IGF-1 (compared with an age- and gender-adjusted reference range) and GH levels following an oral glucose tolerance test (OGTT). A GH trough level of over 1ng/ml was considered to be diagnostic of acromegaly.
The carbohydrate alterations were classified according to the findings for basal glycemia, glycemia after OGTT and, in some cases, glycosylated hemoglobin (HbA1c) concentration. The 2010 criteria of the American Diabetes Association (ADA) were used for classification purposes.19 Based on these criteria, we established three groups: no alterations of carbohydrate metabolism, prediabetes and diabetes. The group with no alterations of carbohydrate metabolism included individuals with no history of diabetes, with basal glycemia <100mg/dl and/or glycemia 2h after OGTT <140mg/dl. The group with prediabetes was characterized by basal glycemia 100–125mg/dl, glycemia 2h after OGTT 140–199mg/dl, and/or HbA1c 5.7–6.4%. The group with diabetes was characterized by patients previously diagnosed with diabetes or presenting basal glycemia ≥126mg/dl, glycemia after OGTT ≥200mg/dl, or HbA1c ≥6.5% (all measurements were repeated on two or more occasions).
Other clinical data of interest were obtained from the electronic case history, such as weight, height, the body mass index (BMI), tumor size (maximum diameter as determined by the magnetic resonance imaging study), and the presence of arterial hypertension and dyslipidemia at the time of diagnosis. The patients were considered to be hypertensive if they were receiving antihypertensive treatment. Patients receiving lipid-lowering treatment and those with LDL-cholesterol ≥160mg/dl were classified as dyslipidemic individuals. We also documented the values corresponding to basal GH, GH after OGTT, and IGF-1. The impact of IGF-1 upon the carbohydrate alterations was evaluated by calculating the Z-score, since this parameter takes into account the difference between patient values and normal values according to age and sex.
We evaluated the frequency of carbohydrate alterations two years after initial treatment for acromegaly, based on the 2010 criteria of the ADA.19 The patients were divided into three groups according to the evolution of the background disease: cured, controlled with medical treatment, and uncontrolled. The criteria established by the latest guides were used for this purpose.2
Laboratory methodsThe measurement of GH and IGF-1 levels was carried out by radioimmunoassay up until 2005, and by using chemiluminescence (Siemens Immulite 2000, Deerfield, IL, USA), thereafter.
Statistical analysisThe mean and standard deviation were calculated in the case of quantitative variables, while qualitative variables were reported as percentages. The comparison of quantitative variables in the different carbohydrate alteration groups was carried out using analysis of variance (ANOVA) and the Kruskal-Wallis test in the event of a non-normal distribution or the absence of homogeneity of variance. Qualitative variables in turn were compared using the chi-squared test or the Fisher test if the expected frequency of a postulate was under 5 patients. The McNemar test was used to evaluate the changes in prevalence of the carbohydrate alterations two years after treatment.
The statistical analyses were performed using the SPSS version 20 statistical package.
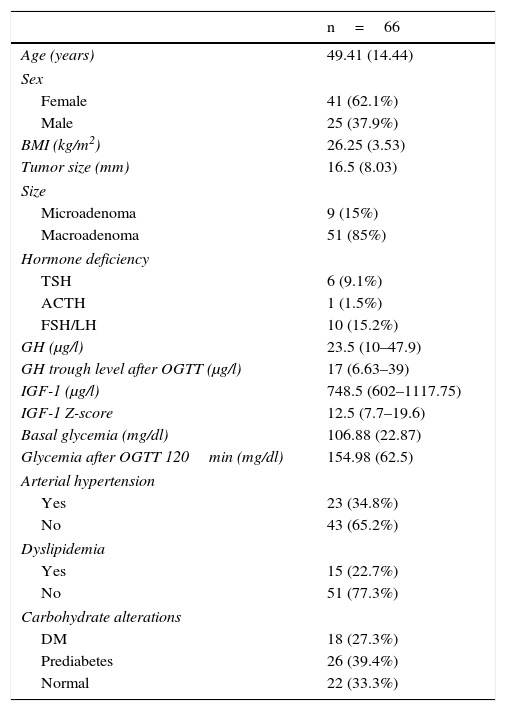
ResultsTable 1 shows the basal characteristics of the 66 patients included in the study. The mean patient age was 49.41±14.44 years, with a predominance of females (62.1%; n=44). The mean tumor size was 16.5±8.03mm, and the great majority of the lesions (85%; n=51) were macroadenomas. The prevalence of glucose metabolic alterations at the time of diagnosis was 66.7% (39.4% presented prediabetes and 27.3% diabetes). In addition, 34.8% of the patients (n=23) were diagnosed with arterial hypertension and 22.7% (n=15) presented dyslipidemia.
Baseline characteristics of the patients diagnosed with acromegaly.
| n=66 | |
|---|---|
| Age (years) | 49.41 (14.44) |
| Sex | |
| Female | 41 (62.1%) |
| Male | 25 (37.9%) |
| BMI (kg/m2) | 26.25 (3.53) |
| Tumor size (mm) | 16.5 (8.03) |
| Size | |
| Microadenoma | 9 (15%) |
| Macroadenoma | 51 (85%) |
| Hormone deficiency | |
| TSH | 6 (9.1%) |
| ACTH | 1 (1.5%) |
| FSH/LH | 10 (15.2%) |
| GH (μg/l) | 23.5 (10–47.9) |
| GH trough level after OGTT (μg/l) | 17 (6.63–39) |
| IGF-1 (μg/l) | 748.5 (602–1117.75) |
| IGF-1 Z-score | 12.5 (7.7–19.6) |
| Basal glycemia (mg/dl) | 106.88 (22.87) |
| Glycemia after OGTT 120min (mg/dl) | 154.98 (62.5) |
| Arterial hypertension | |
| Yes | 23 (34.8%) |
| No | 43 (65.2%) |
| Dyslipidemia | |
| Yes | 15 (22.7%) |
| No | 51 (77.3%) |
| Carbohydrate alterations | |
| DM | 18 (27.3%) |
| Prediabetes | 26 (39.4%) |
| Normal | 22 (33.3%) |
The variables age, BMI, size, basal glycemia and glycemia after OGTT are reported as the mean (standard deviation). The variables GH, GH after OGTT, IGF-1 and IGF-1 Z-score are reported as the median (interquartile range), and the categorical variables as total number (percentage).
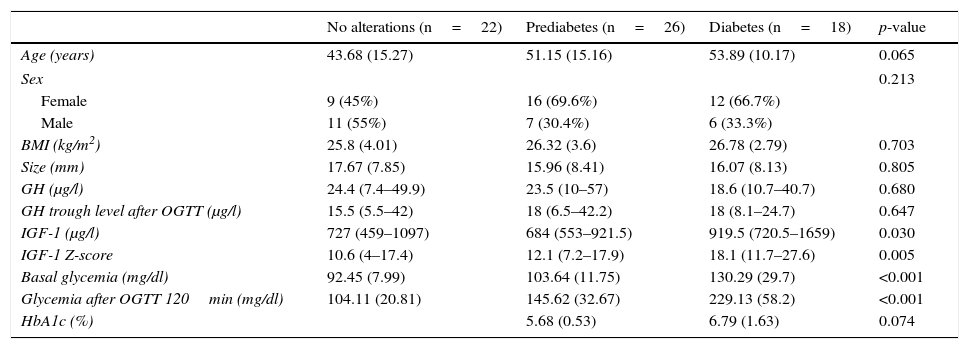
The clinical–laboratory test differences between patients without carbohydrate alterations, with prediabetes and with diabetes are shown in Table 2.
Clinical–laboratory test differences between patients without carbohydrate alterations, with prediabetes and with diabetes.
| No alterations (n=22) | Prediabetes (n=26) | Diabetes (n=18) | p-value | |
|---|---|---|---|---|
| Age (years) | 43.68 (15.27) | 51.15 (15.16) | 53.89 (10.17) | 0.065 |
| Sex | 0.213 | |||
| Female | 9 (45%) | 16 (69.6%) | 12 (66.7%) | |
| Male | 11 (55%) | 7 (30.4%) | 6 (33.3%) | |
| BMI (kg/m2) | 25.8 (4.01) | 26.32 (3.6) | 26.78 (2.79) | 0.703 |
| Size (mm) | 17.67 (7.85) | 15.96 (8.41) | 16.07 (8.13) | 0.805 |
| GH (μg/l) | 24.4 (7.4–49.9) | 23.5 (10–57) | 18.6 (10.7–40.7) | 0.680 |
| GH trough level after OGTT (μg/l) | 15.5 (5.5–42) | 18 (6.5–42.2) | 18 (8.1–24.7) | 0.647 |
| IGF-1 (μg/l) | 727 (459–1097) | 684 (553–921.5) | 919.5 (720.5–1659) | 0.030 |
| IGF-1 Z-score | 10.6 (4–17.4) | 12.1 (7.2–17.9) | 18.1 (11.7–27.6) | 0.005 |
| Basal glycemia (mg/dl) | 92.45 (7.99) | 103.64 (11.75) | 130.29 (29.7) | <0.001 |
| Glycemia after OGTT 120min (mg/dl) | 104.11 (20.81) | 145.62 (32.67) | 229.13 (58.2) | <0.001 |
| HbA1c (%) | 5.68 (0.53) | 6.79 (1.63) | 0.074 | |
The variables age, BMI, size, basal glycemia and glycemia after OGTT are reported as the mean (standard deviation). The variables GH, GH after OGTT, IGF-1 and IGF-1 Z-score are reported as the median (interquartile range), and the categorical variables as total number (percentage).
IGF-1 levels were seen to be significantly higher in the diabetic group than in the other groups (p=0.030). The median IGF-1 concentration in the diabetic patients was 919.5μg/l (interquartile range [IQR] 720.5–1659), which was higher than in the prediabetes group (684μg/l, IQR 553-921.5) and in those without alterations (727μg/l, IQR 459–1097). We also recorded significantly higher (p=0.005) median Z-scores with regard to IGF-1 in the diabetic group (18.1, IQR 11.7–27.6) than in the patients with prediabetes (12.1, IQR 7.2–17.9) and those without alterations (10.6, IQR 4–17.4). However, no differences in basal GH and GH values after OGTT were recorded.
The diabetic patients were older (53.89±10.17 years vs 51.15±15.16 years in the prediabetes group and 43.68±15.27 years in the group without alterations), although the differences were not statistically significant (p=0.065).
We recorded no differences in terms of either the BMI or tumor size.
With regard to treatment, surgery was by far the most frequent choice (90.9% of the cases; n=60), while 9.1% of the patients (n=6) received drug treatment due to the existence of a high surgical risk.
Two years after diagnosis of the disease and following the corresponding treatment, 24 patients (36.4%) were considered to be cured, 19 (28.8%) had IGF-1 levels controlled with drug treatment, and 23 (34.8%) presented uncontrolled disease despite treatment. The changes in the frequency of glucose metabolic alterations in the three subgroups according to the degree of acromegaly control are shown in Fig. 1. The cured patients showed a significant reduction in the prevalence of diabetes and prediabetes two years after diagnosis (from 29.2% to 8.3% and from 45.8% to 16.7%, respectively; p=0.003). The patients with disease controlled by medical treatment showed no significant reduction in the presence of carbohydrate alterations (diabetes decreasing from 21.1% to 10.5% and prediabetes from 36.8% to 31.6%; p=0.392). Similar findings were recorded in the group with active disease after two years (diabetes 30.4%–30.4% and prediabetes 34.8%–39.1%; p=0.532).
Discussion
The present study recorded a high prevalence of glucose metabolic disorders in patients with acromegaly: 27.3% suffered from diabetes and 39.4% presented prediabetes. Different studies have investigated the frequency of diabetes and carbohydrate intolerance in individuals like these, with results similar to our own. In one of the largest studies, the prevalence of diabetes and prediabetes was 31.9% and 40.5%, respectively, in a population of 248 subjects.8 Alexopoulou et al. recorded a prevalence of carbohydrate alterations of 54% (26% prediabetes and 28% diabetes) in a sample of 148 patients.4 Dreval et al. reported a higher frequency of diabetic patients (52.5%).5 This high prevalence may be explained by the older age of the patients involved (56±8.5 years vs 45±20 years in the study of Alexopoulou et al., and 49.41±14.44 years in our own series). The mechanism by which GH produces glucose metabolic alterations has been extensively investigated.10,11 Although GH and not IGF-1 possesses this hyperglycemic capacity, the latter molecule shows the best correlation as a marker of disease activity and the presence of carbohydrate alterations.4,5,9,20–23 In our study, there were no differences between basal GH and GH after OGTT in the different groups, but we did record differences in IGF-1 levels and IGF-1 Z-score. The studies of Alexopoulou et al. and Dreval et al. described a correlation to the IGF-1 Z-score, with no differences regarding basal GH and GH after OGTT.4,5 In the study published by Stelmachowska-Banaś et al.,9 the IGF-1 Z-score showed a stronger correlation to hyperinsulinism and insulin resistance, as it did in the study of Niculescu et al.23 Different studies have found patient age to be correlated to the presence of diabetes in acromegalic individuals.4,8,9 In our study, the patients with diabetes and prediabetes tended to be older, though statistical significance was not reached (p=0.065).
Only a few studies have investigated what happens to glucose metabolism after the treatment of acromegaly.18,24 In our series, the cured patients showed a significant decrease in the prevalence of diabetes and prediabetes two years after diagnosis. In those patients in which the disease was controlled with medical treatment after surgery, a slight decrease in the frequency of carbohydrate alterations was also noted, though without reaching statistical significance. It should be taken into account that most of these patients were receiving treatment in the form of somatostatin analogs, which exert a hyperglycemic effect. The patients with active acromegaly after two years presented a frequency of glucose metabolic disorders similar to that observed at the time of diagnosis. Jonas et al. recorded a similar prevalence of carbohydrate alterations at diagnosis and during follow-up.18 Only the patients that were cured after surgery showed a decrease in basal glycemia. In patients who were cured after surgery, Kinoshita et al. found that insulin resistance only improves if pancreatic beta-cell function is preserved.24 An early diagnosis, therefore, seems to be essential, with patient cure being sought with the initial treatment, in order to correct the glucose metabolic disorders and thereby reduce the excess cardiovascular risk found in these patients.
One of the limitations of our study is a result of its retrospective nature. This meant that we could not obtain data referring to basal glycemia, glycemia after OGTT and HbA1c for all the patients. In addition, we were unable to assess the delay between symptom onset and diagnosis, which could condition the appearance of complications such as glycemic alterations. Finally, it would be interesting to have the insulin and peptide C values in order to better understand the physiopathological mechanism underlying the carbohydrate metabolic disorders in these patients. A possible topic for future studies might be the evaluation of the prevalence of the different cardiovascular risk factors and of established cardiovascular disease according to whether acromegaly has been cured or not.
ConclusionGlucose metabolic disorders are very frequent in patients diagnosed with acromegaly. In this context, IGF-1 is the marker with the best correlation to such disorders.
The curing of acromegaly results in a significant decrease in carbohydrate alterations two years after first treatment, and could, therefore, lessen the cardiovascular risk and the increased mortality associated with this disease.
Financial supportThe authors received no financial support in carrying out the present study.
Conflicts of interestNone.
Thanks are due to all the members of the Department of Endocrinology and Nutrition of Complejo Hospitalario de Navarra for their collaboration in this study.
Please cite this article as: Ernaga Lorea A, Eguílaz Esparza N, Ollero García-Agulló MD, García Mouriz M, Iriarte Beroiz A, Rodríguez Erdozain R. Alteraciones en el metabolismo glucémico antes y después del tratamiento en pacientes con acromegalia. Endocrinol Diabetes Nutr. 2017;64:363–368.
