The purpose was to determine the association of lifestyle (i.e., Mediterranean diet [MD] adherence, physical activity [PA], screen time [ST]) and fitness with abdominal obesity (AO) and excess weight in the Chilean and Colombian schoolchildren.
Research methods & proceduresThis cross-sectional study included 969 schoolchildren, girls (n=441, 5.24±0.80 years old) and boys (n=528, 5.10±0.78 years old) from Chile (n=611) and Colombia (n=358). The body mass index (BMI), waist circumference (WC), waist-to-height ratio (WtHR), MD adherence, PA, ST and cardiorespiratory fitness (CRF) were evaluated. The association of AO and anthropometric variables with lifestyle was estimated through multiple linear regression. To determine the association between AO and lifestyle, a logistic regression and the inclusion of odds ratios (ORs) with 95% confidence intervals (CIs) were used.
ResultsWorse CRF in Chilean children were positively correlated with WC. Excess weight in Chilean and Colombian children was positively associated with an unhealthy lifestyle. In Chilean children unhealthy lifestyle was also associated with AO based on WC≥85th percentile and AO based on WtHR≥85th percentile. In Chilean children, excess weight (BMI≥85th percentile) was positively associated with poor MD adherence.
ConclusionAO and excess weight were associated with an unhealthy lifestyle in Latin-American schoolchildren. Interventions to reduce the prevalence of AO should include promoting healthier lifestyle choices (i.e., increasing PA after school, reducing ST and improving CRF).
El propósito fue determinar la asociación del estilo de vida (es decir, adherencia a la dieta mediterránea [DM], actividad física [AF], tiempo frente a la pantalla [TP]) y aptitud física con obesidad abdominal (OA) y exceso de peso en escolares chilenos y colombianos.
Métodos y procedimientos de investigaciónEste estudio transversal incluyó a 969 escolares, niñas (n=441; 5,24±0,80años) y niños (n=528; 5,10±0,78años) de Chile (n=611) y Colombia (n=358). Se evaluaron el índice de masa corporal (IMC), la circunferencia de la cintura (CC), la relación cintura-altura (RCE), la adherencia a la DM, la AF, la TP y la aptitud cardiorrespiratoria (CRF). La asociación de OA y variables antropométricas con el estilo de vida se estimó mediante regresión lineal múltiple. Para determinar la asociación entre OA y estilo de vida se utilizó una regresión logística y la inclusión de odds ratios (OR) con intervalos de confianza (IC) del 95%.
ResultadosMenor CRF en los niños chilenos se correlacionó positivamente con la CC. El exceso de peso en preescolares chilenos y colombianos se asoció positivamente con un mal estilo de vida (3-5años). Además, en los niños chilenos de 3 a 5años un mal estilo de vida se asoció con AO basado en CC ≥percentil 85 y OA basado en RCE ≥percentil 85. En los niños chilenos, el exceso de peso (IMC ≥percentil 85) se asoció positivamente con una mala adherencia a la DM.
ConclusiónLa OA y el exceso de peso se asociaron con un mal estilo de vida en preescolares latinoamericanos. Las intervenciones para reducir la prevalencia de OA deben incluir la promoción de un estilo de vida saludable (es decir, aumentar la AF después de la escuela, reducir el TP y mejorar la CRF).
The prevalence of childhood obesity is reaching epidemic proportions all over the world even among preschool children,1 and has been declared a global public health problem.2 Childhood obesity has become one of the major concerns in recent years due to its association with future health problems.3 Obesity is a global phenomenon in both developed and undeveloped countries. However, as Mazza and Kovalskys have noted, there is little information regarding this issue in Latin America.4 The high prevalence of obesity in Latin America is basically caused by important changes in food habits and PA patterns and by other sociocultural factors (i.e., a lower educational and socioeconomic level), which have produced a nutritional transition process.5
Likewise, abdominal obesity (AO) is a major clinical and public health issue compared with generalized obesity in children, as AO (i.e., central obesity) is more strongly correlated with cardiometabolic risk (CMR)6 and seems to have increased during the last few decades.7 Moreover, it has been reported that AO in children increases CMR factors such as dyslipidaemia, hypertension and hyperglycaemia.6 Likewise, AO predicts a wide range of adverse health outcomes such as diabetes and cardiovascular diseases.8 Thus, more attention should be paid in epidemiological studies to AO in children, while identifying modifiable lifestyle behaviour linked to AO is necessary for developing preventive strategies.
The decrease in physical activity (PA) and the increase in sedentary behaviour in children have affected the development of healthy children.9 In this sense, a high amount of screen time (ST, the most popular sedentary behaviour) has been associated with a cluster of CMR factors10 such as AO in children.11 Additionally, PA has been indicated as an important factor in preventing CMR,12 and is a modifiable factor that is inversely associated with AO. Thus, if carried out from childhood, it can influence the adoption of an active lifestyle.13
Children's food habits represent one of the main determinant factors that influence the development of obesity.14 There is evidence that adherence to a Mediterranean diet (MD) is associated with positive effects on specific components of well-being.15 Likewise, children's food habits have an influence on health in later life,16 and may be protective factors for well-being in children. Nevertheless, there is a high prevalence of children aged 6–7 years with poor-to-moderate MD adherence.17 Additionally, better MD adherence in preschool children is associated with a lower risk of developing AO in children and adolescents.18
Another relevant factor is fitness in pre-schoolers. During childhood it has different health benefits, especially cardiorespiratory fitness (CRF), which is a basic component of a healthy lifestyle19 and is related to lower CMR.20 It has also been shown that overweight children with high CRF have a healthier cardiovascular profile.21 Moreover, higher levels of CRF substantially reduce CMR in adulthood, even among those with AO in childhood.22 Developing assessments of children's health-related physical fitness at an early stage is a priority,23 since improving physical fitness provides protection against CMR24 and is an important biomarker of health.25 The association between such modifiable behaviour as fitness and lifestyle (i.e., PA, ST and MD adherence) and obesity is well documented in children, but this association remains to be determined in Latin-American children. Therefore, the purpose of this study was to determine the association of lifestyle (i.e., MD adherence, PA and ST) and fitness with AO and excess weight in Chilean and Colombian schoolchildren.
MethodsStudy design and participantsThis cross-sectional study included 969 children, girls (n=441, 5.27±0.71 years old) and boys (n=528, 5.14±0.82 years old) from Chile (n=611) and Colombia (n=358), selected by convenience sampling. Parents and guardians were informed about the study and provided signed written consent for participation. Additionally, all children gave their oral or written assent on the day of the assessment. The investigation complied with the 2013 Helsinki Declaration and was approved by the Ethics Committee (Doctoral Project, Jaen University and Local Ethics Committee).
The inclusion criteria were: (i) presenting informed consent of the parents and assent of the participant, (ii) belonging to educational centres and (iii) being between 3 and 7 years old. The exclusion criteria were having a musculoskeletal disorder or any other known medical condition, which might alter the participant's health and PA levels. Moreover, schoolchildren with physical, sensorial or intellectual disabilities were excluded.
Sociodemographic characteristicsAn ad hoc sociodemographic questionnaire was used; information such as educational level, marital status and socioeconomic background (based on their socioeconomic self-perception) was collected from parents. Moreover, parents completed the information about the preschool children's PA and ST (Krece Plus test).
General obesityThe body mass index (BMI), calculated as the body mass divided by the square of the height in metres (kg/m2), was used to estimate the degree of obesity. Body mass (kg) was measured using a Tanita UM-028 scale (Tokyo, Japan); the children were weighed in their underclothes without shoes. Height (m) was estimated with a Seca® 214 stadiometer (Hamburg, Germany) that was graduated in mm. For the BMI, World Health Organization (WHO) curves were used to identify excess weight, according to sex and age.26
Abdominal obesityWaist circumference (WC) was measured using a Seca® 201 tape measure (Hamburg, Germany) at the height of the umbilical scar.27 The waist-to-height ratio (WtHR) was obtained by dividing the WC by the height. To define AO, four aspects were considered: (i) WC in the 90th percentile of the sample study (≥65cm), (ii) WC≥85th percentile of the sample study (≥63cm), (iii) WtHR in the 90th percentile of the sample study (≥0.59) and (iv) WtHR≥85th percentile (≥0.57) of the sample study.28–30
Food habitsMD adherence of the children was assessed by the Krece Plus test,31 a tool for assessing eating patterns and their relationship with nutritional status based on the MD. The questionnaire has 15 items, and the format assesses a set of items about the food consumed in the diet. Each item has a score of +1 or −1, depending on whether it approximates the ideal of the MD. The maximum score is 11 points and the minimum −5. The total points are added, and according to the score, the nutritional status is classified as follows: (i) low nutritional level: ≤5; (ii) moderate nutritional level: 6–8; or (iii) high nutritional level: ≥9. This questionnaire has been used in Chilean schoolchildren.12
Physical activity patternsLifestyle was evaluated with the Krece Plus test,31 a quick questionnaire that classifies lifestyle according to the daily average of hours spent watching television or playing video games (h/day) and hours of PA after school per week (h/week). Classification is made according to the number of hours used for each point. The total points are added, and the person is classified as having: (i) good lifestyle (men: ≥9, women≥8), (ii) regular lifestyle (men: 6–8, women: 5–7) or (iii) bad lifestyle (men: ≤5, women: ≤4).
Physical fitnessFor the evaluation of physical fitness, leg strength, CRF and handgrip strength were measured.
Lower-body explosive strength was assessed by a standing long jump test (SLJ).32 The SLJ has been used in preschool children33 and consists of jumping a distance with both feet at the same time. For this, the student stands behind the jump line, and with a foot separation equal to the width of their shoulders; the knees are then bent with the arms in front of the body and parallel to the ground. From this position, they swing their arms, push hard and jump as far as possible, making contact with the ground with both feet simultaneously and in a vertical position. This is done twice, and the best result is recorded.
Handgrip strength was used to measure upper body strength through a hand dynamometer (TKK 5101 Grip D; Takei, Tokyo, Japan). The test consists of holding a dynamometer in one hand and squeezing as tightly as possible without allowing the dynamometer to touch the body; force is applied gradually and continuously for a maximum of 3–5s.32 The test was performed twice, and the maximum score for each hand was recorded in kilograms. The average of the scores achieved by the left and right hands was used in the analysis. Higher scores indicate better performance.
CRF was assessed using the 100m×20m test, inspired by the spatial structure of the Léger test.34 The 100m×20m test has been used in preschool children and has been validated.35 Its design takes into account the age of the children, the rules being very simple and the test enjoyable to perform. The materials required are a tape measure to mark the distances of the runway (20m), two boxes, five balloons and a stopwatch. It is a 20m shuttle test, in which participants have to move five balloons from box A, located at one extreme, to box B, located at the opposite extreme. The total distance covered is 200m, timed from the signal “Go” until the participant deposits the last balloon. It is unimportant whether or not the balloon enters the box. If dropped, the participant has to pick it up and continue moving. Supervisors indicate that the balloon has to be held with both hands. Only one attempt is made and running and walking are allowed. The result is recorded in seconds with one decimal place, a slower time indicating a poorer performance.
Statistical analysisStatistical analyses were performed using STATA V.13.0. (StataCorp, College Station, TX, USA). Normal distribution was tested using the Kolmogorov–Smirnov test. For continuous variables, values were presented as means and standard deviations (SDs), whereas for categorical variables, data were presented as proportions. Differences between groups were determined using one-way ANOVA and the χ2 test. The association of AO and anthropometric variables with lifestyle was estimated through multiple linear regression. To determine the association between AO and lifestyle, a logistic regression and the inclusion of odds ratios (ORs) with 95% confidence intervals (CIs) were used. Values of P<0.05 were considered statistically significant.
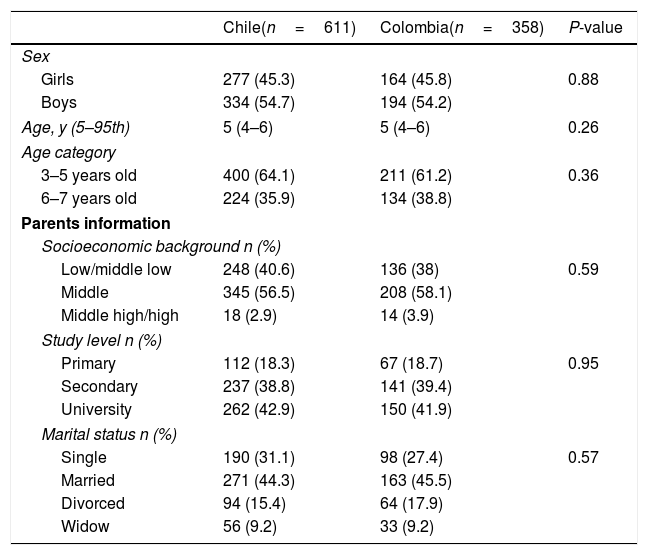
ResultsSociodemographic antecedentsThere were no significant differences between the proportion of girls and boys or the parents’ antecedents (i.e., marital status, study level and socioeconomic background) in the comparison between Chilean and Colombian children (Table 1).
Sociodemographic characteristics of the study sample.
| Chile(n=611) | Colombia(n=358) | P-value | |
|---|---|---|---|
| Sex | |||
| Girls | 277 (45.3) | 164 (45.8) | 0.88 |
| Boys | 334 (54.7) | 194 (54.2) | |
| Age, y (5–95th) | 5 (4–6) | 5 (4–6) | 0.26 |
| Age category | |||
| 3–5 years old | 400 (64.1) | 211 (61.2) | 0.36 |
| 6–7 years old | 224 (35.9) | 134 (38.8) | |
| Parents information | |||
| Socioeconomic background n (%) | |||
| Low/middle low | 248 (40.6) | 136 (38) | 0.59 |
| Middle | 345 (56.5) | 208 (58.1) | |
| Middle high/high | 18 (2.9) | 14 (3.9) | |
| Study level n (%) | |||
| Primary | 112 (18.3) | 67 (18.7) | 0.95 |
| Secondary | 237 (38.8) | 141 (39.4) | |
| University | 262 (42.9) | 150 (41.9) | |
| Marital status n (%) | |||
| Single | 190 (31.1) | 98 (27.4) | 0.57 |
| Married | 271 (44.3) | 163 (45.5) | |
| Divorced | 94 (15.4) | 64 (17.9) | |
| Widow | 56 (9.2) | 33 (9.2) | |
The data shown represent n (proportions). P<0.05 considered statistically significant.
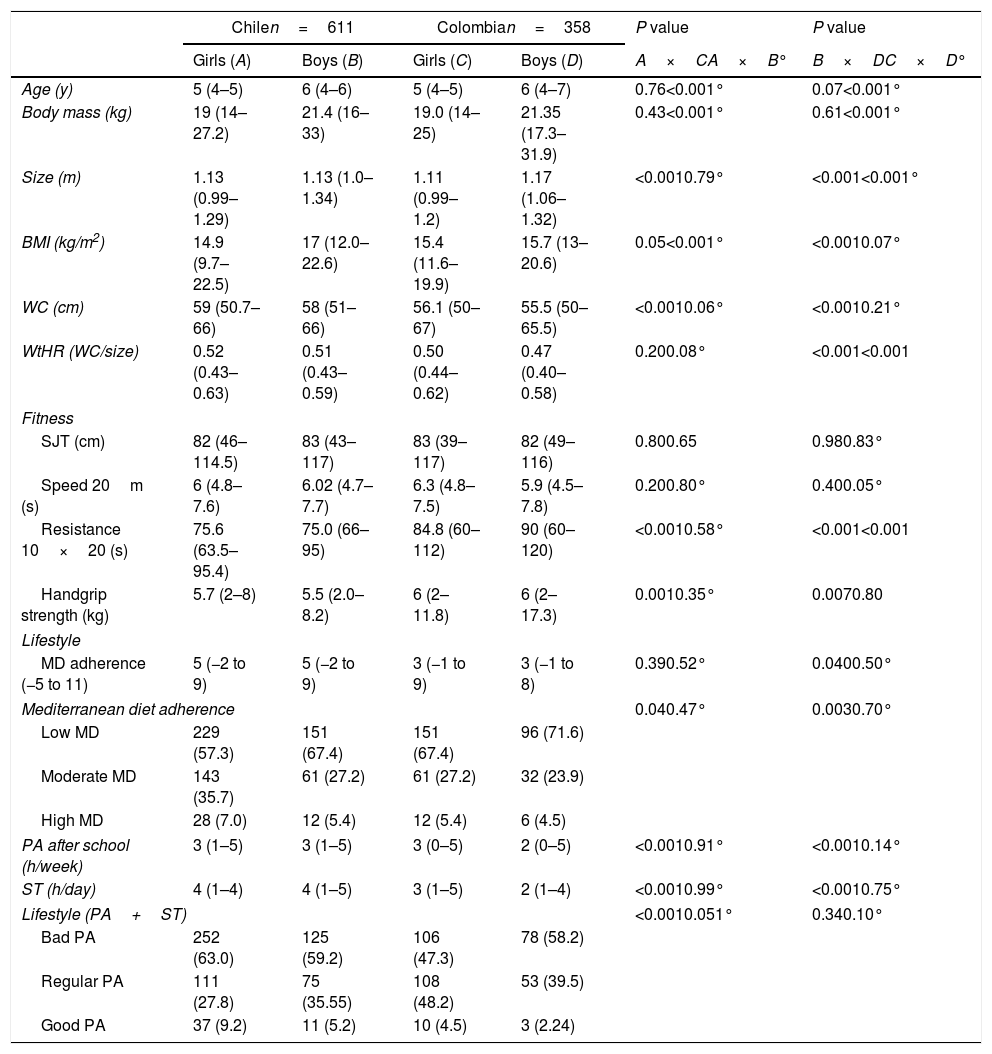
According to the anthropometric parameters, the boys in Chile had a higher BMI (P<0.001), WC (P<0.001) and WtHR (P<0.001) than the Colombian children. In relation to fitness, Chilean children presented better results in the ‘10×20’ resistance test than Colombian children (P<0.001). However, regarding handgrip strength the Chilean children had worse results than the Colombian children (P=0.007). For lifestyle, Chilean children presented higher MD adherence (P=0.040), hours of PA after school per week (P<0.001) and ST per day (P<0.001) than Colombian children. Chilean girls had higher WC (P<0.001) than Colombian girls; likewise, they had better results in the 10×20 resistance test (P<0.001). For lifestyle, the Chilean girls had higher levels of moderate and high MD adherence (P=0.040), hours of PA after school per week (P<0.001) and ST per day than Colombian girls (P<0.001) (Table 2).
Comparison of anthropometric and physical characteristics of the study sample.
| Chilen=611 | Colombian=358 | P value | P value | |||
|---|---|---|---|---|---|---|
| Girls (A) | Boys (B) | Girls (C) | Boys (D) | A×CA×B° | B×DC×D° | |
| Age (y) | 5 (4–5) | 6 (4–6) | 5 (4–5) | 6 (4–7) | 0.76<0.001° | 0.07<0.001° |
| Body mass (kg) | 19 (14–27.2) | 21.4 (16–33) | 19.0 (14–25) | 21.35 (17.3–31.9) | 0.43<0.001° | 0.61<0.001° |
| Size (m) | 1.13 (0.99–1.29) | 1.13 (1.0–1.34) | 1.11 (0.99–1.2) | 1.17 (1.06–1.32) | <0.0010.79° | <0.001<0.001° |
| BMI (kg/m2) | 14.9 (9.7–22.5) | 17 (12.0–22.6) | 15.4 (11.6–19.9) | 15.7 (13–20.6) | 0.05<0.001° | <0.0010.07° |
| WC (cm) | 59 (50.7–66) | 58 (51–66) | 56.1 (50–67) | 55.5 (50–65.5) | <0.0010.06° | <0.0010.21° |
| WtHR (WC/size) | 0.52 (0.43–0.63) | 0.51 (0.43–0.59) | 0.50 (0.44–0.62) | 0.47 (0.40–0.58) | 0.200.08° | <0.001<0.001 |
| Fitness | ||||||
| SJT (cm) | 82 (46–114.5) | 83 (43–117) | 83 (39–117) | 82 (49–116) | 0.800.65 | 0.980.83° |
| Speed 20m (s) | 6 (4.8–7.6) | 6.02 (4.7–7.7) | 6.3 (4.8–7.5) | 5.9 (4.5–7.8) | 0.200.80° | 0.400.05° |
| Resistance 10×20 (s) | 75.6 (63.5–95.4) | 75.0 (66–95) | 84.8 (60–112) | 90 (60–120) | <0.0010.58° | <0.001<0.001 |
| Handgrip strength (kg) | 5.7 (2–8) | 5.5 (2.0–8.2) | 6 (2–11.8) | 6 (2–17.3) | 0.0010.35° | 0.0070.80 |
| Lifestyle | ||||||
| MD adherence (−5 to 11) | 5 (−2 to 9) | 5 (−2 to 9) | 3 (−1 to 9) | 3 (−1 to 8) | 0.390.52° | 0.0400.50° |
| Mediterranean diet adherence | 0.040.47° | 0.0030.70° | ||||
| Low MD | 229 (57.3) | 151 (67.4) | 151 (67.4) | 96 (71.6) | ||
| Moderate MD | 143 (35.7) | 61 (27.2) | 61 (27.2) | 32 (23.9) | ||
| High MD | 28 (7.0) | 12 (5.4) | 12 (5.4) | 6 (4.5) | ||
| PA after school (h/week) | 3 (1–5) | 3 (1–5) | 3 (0–5) | 2 (0–5) | <0.0010.91° | <0.0010.14° |
| ST (h/day) | 4 (1–4) | 4 (1–5) | 3 (1–5) | 2 (1–4) | <0.0010.99° | <0.0010.75° |
| Lifestyle (PA+ST) | <0.0010.051° | 0.340.10° | ||||
| Bad PA | 252 (63.0) | 125 (59.2) | 106 (47.3) | 78 (58.2) | ||
| Regular PA | 111 (27.8) | 75 (35.55) | 108 (48.2) | 53 (39.5) | ||
| Good PA | 37 (9.2) | 11 (5.2) | 10 (4.5) | 3 (2.24) | ||
The quantitative variables shown median (percentiles 5–95), qualitative variables represent n (proportions). P<0.05 considered statistically significant. BMI=body max index, WC=waist circumference, WtHR=waist-to-height ratio, SLJ=standing long jump test, MD=Mediterranean diet, PA=physical activity, ST=screen time.
In Chilean girls, excess weight was present in 36.5%, of which 21.3% fell into the obesity category, while 9.1% of Colombian girls were obese. Similarly, 39.5% of Chilean boys had excess weight, of which 27.2% were obese, while 13.9% of Colombian boys were obese (Fig. 1).
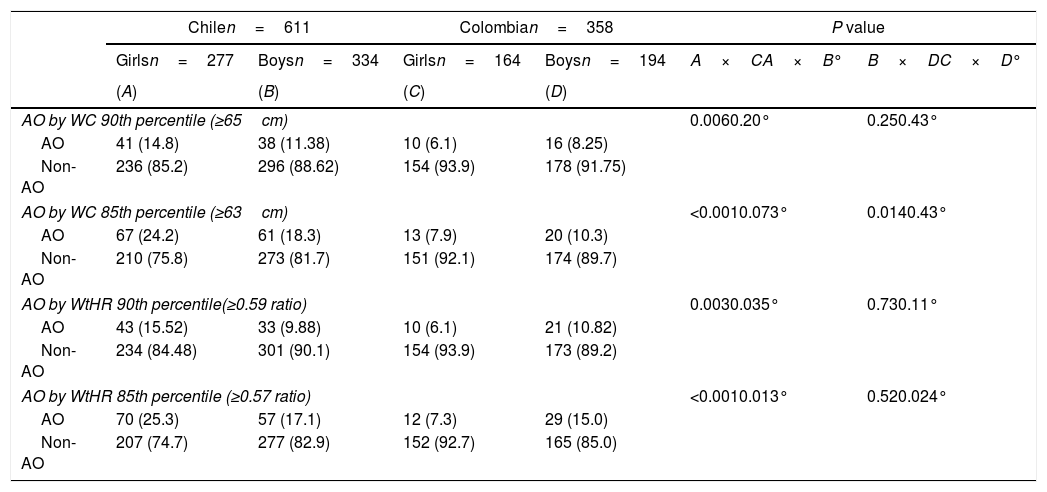
In relation to AO, more Chilean girls (24.2% vs. 7.9%, P<0.001) and boys (18.3% vs. 10.3%, P=0.0014) had a higher AO based on WC≥85th percentile (≥ 63cm) than their Colombian peers. Assessing AO based on WtHR≥85th percentile (≥ 0.57), more Chilean girls (25.3% vs. 7.3%) had AO than Colombian girls and Chilean boys (25.3% vs. 17.1%, P=0.013) (Table 3).
Prevalence of abdominal obesity according to sex and country.
| Chilen=611 | Colombian=358 | P value | ||||
|---|---|---|---|---|---|---|
| Girlsn=277 | Boysn=334 | Girlsn=164 | Boysn=194 | A×CA×B° | B×DC×D° | |
| (A) | (B) | (C) | (D) | |||
| AO by WC 90th percentile (≥65cm) | 0.0060.20° | 0.250.43° | ||||
| AO | 41 (14.8) | 38 (11.38) | 10 (6.1) | 16 (8.25) | ||
| Non-AO | 236 (85.2) | 296 (88.62) | 154 (93.9) | 178 (91.75) | ||
| AO by WC 85th percentile (≥63cm) | <0.0010.073° | 0.0140.43° | ||||
| AO | 67 (24.2) | 61 (18.3) | 13 (7.9) | 20 (10.3) | ||
| Non-AO | 210 (75.8) | 273 (81.7) | 151 (92.1) | 174 (89.7) | ||
| AO by WtHR 90th percentile(≥0.59 ratio) | 0.0030.035° | 0.730.11° | ||||
| AO | 43 (15.52) | 33 (9.88) | 10 (6.1) | 21 (10.82) | ||
| Non-AO | 234 (84.48) | 301 (90.1) | 154 (93.9) | 173 (89.2) | ||
| AO by WtHR 85th percentile (≥0.57 ratio) | <0.0010.013° | 0.520.024° | ||||
| AO | 70 (25.3) | 57 (17.1) | 12 (7.3) | 29 (15.0) | ||
| Non-AO | 207 (74.7) | 277 (82.9) | 152 (92.7) | 165 (85.0) | ||
Data represent n (proportions), P value determined by Chi2. P<0.05 was considered statistically significant. AO=abdominal obesity. WC=waist circumference, WtHR=waist-to-height ratio.
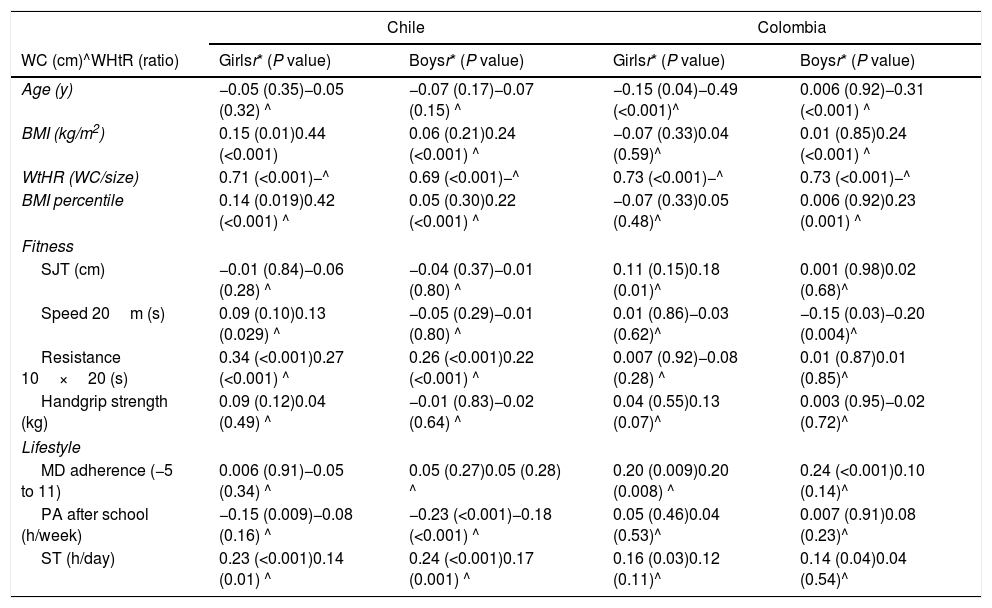
Worse results in the 10×20 resistance test (i.e., CRF) in Chilean girls and boys were positively correlated with WC (girls, r=0.34, P<0.001; boys, r=0.26, P<0.001) and WtHR (girls, r=0.27, P<0.001; boys r=0.22, P<0.001). PA after school was inversely correlated with WC in girls (r=−0.15, P=0.009) and boys (r=−0.23, P<0.001). In Colombian girls (r=0.20, P=0.009) and boys (r=0.24, P<0.001), MD adherence was positively correlated with WC. ST was positively correlated with WC in Chilean girls (r=0.23, P<0.001) and boys (r=0.24, P<0.001). The same relation was found in Colombian girls and boys (r=0.16, P=0.030 and r=0.16, P=0.040, respectively) (Table 4).
Lineal correlation between WC and WtHR with physical factors in Latin-American preschool children.
| Chile | Colombia | |||
|---|---|---|---|---|
| WC (cm)^WHtR (ratio) | Girlsr* (P value) | Boysr* (P value) | Girlsr* (P value) | Boysr* (P value) |
| Age (y) | −0.05 (0.35)−0.05 (0.32) ^ | −0.07 (0.17)−0.07 (0.15) ^ | −0.15 (0.04)−0.49 (<0.001)^ | 0.006 (0.92)−0.31 (<0.001) ^ |
| BMI (kg/m2) | 0.15 (0.01)0.44 (<0.001) | 0.06 (0.21)0.24 (<0.001) ^ | −0.07 (0.33)0.04 (0.59)^ | 0.01 (0.85)0.24 (<0.001) ^ |
| WtHR (WC/size) | 0.71 (<0.001)−^ | 0.69 (<0.001)−^ | 0.73 (<0.001)−^ | 0.73 (<0.001)−^ |
| BMI percentile | 0.14 (0.019)0.42 (<0.001) ^ | 0.05 (0.30)0.22 (<0.001) ^ | −0.07 (0.33)0.05 (0.48)^ | 0.006 (0.92)0.23 (0.001) ^ |
| Fitness | ||||
| SJT (cm) | −0.01 (0.84)−0.06 (0.28) ^ | −0.04 (0.37)−0.01 (0.80) ^ | 0.11 (0.15)0.18 (0.01)^ | 0.001 (0.98)0.02 (0.68)^ |
| Speed 20m (s) | 0.09 (0.10)0.13 (0.029) ^ | −0.05 (0.29)−0.01 (0.80) ^ | 0.01 (0.86)−0.03 (0.62)^ | −0.15 (0.03)−0.20 (0.004)^ |
| Resistance 10×20 (s) | 0.34 (<0.001)0.27 (<0.001) ^ | 0.26 (<0.001)0.22 (<0.001) ^ | 0.007 (0.92)−0.08 (0.28) ^ | 0.01 (0.87)0.01 (0.85)^ |
| Handgrip strength (kg) | 0.09 (0.12)0.04 (0.49) ^ | −0.01 (0.83)−0.02 (0.64) ^ | 0.04 (0.55)0.13 (0.07)^ | 0.003 (0.95)−0.02 (0.72)^ |
| Lifestyle | ||||
| MD adherence (−5 to 11) | 0.006 (0.91)−0.05 (0.34) ^ | 0.05 (0.27)0.05 (0.28) ^ | 0.20 (0.009)0.20 (0.008) ^ | 0.24 (<0.001)0.10 (0.14)^ |
| PA after school (h/week) | −0.15 (0.009)−0.08 (0.16) ^ | −0.23 (<0.001)−0.18 (<0.001) ^ | 0.05 (0.46)0.04 (0.53)^ | 0.007 (0.91)0.08 (0.23)^ |
| ST (h/day) | 0.23 (<0.001)0.14 (0.01) ^ | 0.24 (<0.001)0.17 (0.001) ^ | 0.16 (0.03)0.12 (0.11)^ | 0.14 (0.04)0.04 (0.54)^ |
Data represent r*=Pearson correlation coefficient (P value), P<0.05 considered statistically significant. BMI=body mass index, WC=waist circumference, WtHR=waist-to-height ratio, SLJ=standing long jump test, MD=Mediterranean diet, PA=physical activity, ST=screen time.
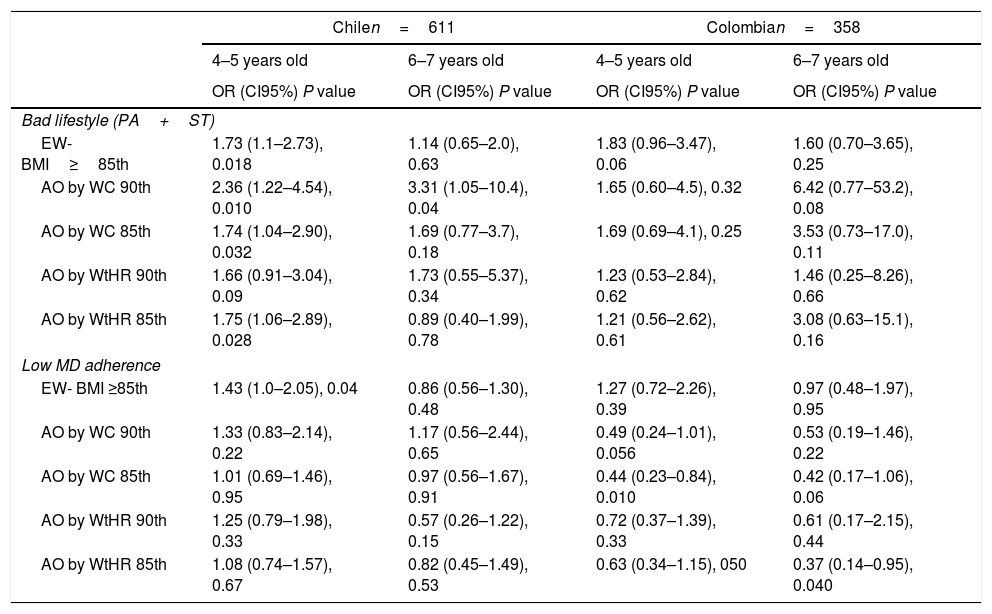
Excess weight in Chilean (OR: 1.73, 95%CI: 1.1–2.73, P=0.018) and Colombian children (OR: 1.83, 95%CI: 0.96–3.47, P=0.06) was positively associated with bad lifestyle. In Chilean children, a bad lifestyle was also associated with AO based on WC in the 90th percentile (OR: 2.36, 95%CI: 1.22–4.54, P=0.010), AO based on WC≥85th percentile (OR: 1.74, 95%CI: 1.04–2.9, P=0.032) and AO based on WtHR≥85th percentile (OR: 1.75, 95%CI: 1.06–2.89, P=0.028). Moreover, in Colombian children, low MD adherence was inversely associated with AO based on WC≥85th percentile (OR: 0.44, 95%CI: 0.23–0.84, P=0.010). By contrast, in Chilean children, excess weight – a BMI≥85th percentile – was positively associated with bad MD adherence (OR: 1.43, 95%CI: 1.0–2.05, P=0.04) (Table 5).
Association between abdominal obesity and lifestyle in Latin-American preschool children.
| Chilen=611 | Colombian=358 | |||
|---|---|---|---|---|
| 4–5 years old | 6–7 years old | 4–5 years old | 6–7 years old | |
| OR (CI95%) P value | OR (CI95%) P value | OR (CI95%) P value | OR (CI95%) P value | |
| Bad lifestyle (PA+ST) | ||||
| EW-BMI≥85th | 1.73 (1.1–2.73), 0.018 | 1.14 (0.65–2.0), 0.63 | 1.83 (0.96–3.47), 0.06 | 1.60 (0.70–3.65), 0.25 |
| AO by WC 90th | 2.36 (1.22–4.54), 0.010 | 3.31 (1.05–10.4), 0.04 | 1.65 (0.60–4.5), 0.32 | 6.42 (0.77–53.2), 0.08 |
| AO by WC 85th | 1.74 (1.04–2.90), 0.032 | 1.69 (0.77–3.7), 0.18 | 1.69 (0.69–4.1), 0.25 | 3.53 (0.73–17.0), 0.11 |
| AO by WtHR 90th | 1.66 (0.91–3.04), 0.09 | 1.73 (0.55–5.37), 0.34 | 1.23 (0.53–2.84), 0.62 | 1.46 (0.25–8.26), 0.66 |
| AO by WtHR 85th | 1.75 (1.06–2.89), 0.028 | 0.89 (0.40–1.99), 0.78 | 1.21 (0.56–2.62), 0.61 | 3.08 (0.63–15.1), 0.16 |
| Low MD adherence | ||||
| EW- BMI ≥85th | 1.43 (1.0–2.05), 0.04 | 0.86 (0.56–1.30), 0.48 | 1.27 (0.72–2.26), 0.39 | 0.97 (0.48–1.97), 0.95 |
| AO by WC 90th | 1.33 (0.83–2.14), 0.22 | 1.17 (0.56–2.44), 0.65 | 0.49 (0.24–1.01), 0.056 | 0.53 (0.19–1.46), 0.22 |
| AO by WC 85th | 1.01 (0.69–1.46), 0.95 | 0.97 (0.56–1.67), 0.91 | 0.44 (0.23–0.84), 0.010 | 0.42 (0.17–1.06), 0.06 |
| AO by WtHR 90th | 1.25 (0.79–1.98), 0.33 | 0.57 (0.26–1.22), 0.15 | 0.72 (0.37–1.39), 0.33 | 0.61 (0.17–2.15), 0.44 |
| AO by WtHR 85th | 1.08 (0.74–1.57), 0.67 | 0.82 (0.45–1.49), 0.53 | 0.63 (0.34–1.15), 050 | 0.37 (0.14–0.95), 0.040 |
The data shown represent OR, (95%CI), P-value. The OR was adjusted by sex. AO=abdominal obesity, WC=waist circumference, WtHR=waist to height ratio, EW=excessive weight.
The purpose of this study was to determine the association of lifestyle (i.e., MD adherence, PA and ST) and fitness with AO and excess weight in Chilean and Colombian children. The main results were: (i) in Chilean and Colombian children, AO was associated with a poor lifestyle, (ii) ST was positively correlated with WC in Chilean and Colombian preschool children, and (iii) worse CRF results (10×20 test) were positively correlated with WC and WtHR in Chilean girls and boys, but not in Colombian children.
In the present study, we found a higher prevalence of AO in Chilean girls (25.3%), than boys and Colombian girls. In a study conducted in 5231 Greek children, the prevalence of AO did not differ between boys and girls at the age of 7 (25.2% and 25.3% respectively), while at the age of 9 more boys than girls had AO (33.2% and 28.2%, respectively).36 In another study evaluating 1433 Portuguese children (6–12 years old), the prevalence of AO based on the measurement of WC was similar in girls and boys; however, according to WtHR, boys had a higher prevalence than girls.37 Another investigation reported a high prevalence of AO in children between 3 and 10 years old, where 30.5% of the children had AO.38 Evidence of the prevalence of AO in children is worrying, as it is a risk factor for cardiovascular diseases and cancer in adults.39 Another study reported that those presenting high WC values are more likely to have hypertension, diabetes, dyslipidaemia and CMR compared with those with normal WC values.40
In Chilean and Colombian children, excess weight (i.e., overweight and obesity) and AO was associated with a bad lifestyle (i.e., low PA after school and high ST). In accordance with our results, a study conducted in Canadian preschool children reported that a healthy lifestyle such as good PA patterns and low sedentary behaviour is significantly associated with healthy BMI z-scores but not with WC.41 Similarly, a longitudinal study demonstrated that an unhealthy lifestyle (i.e., bad food habits and high ST) is associated with high body fat in preschool girls.42 On the other hand, a recent study reported that BMI and WC are not associated with lifestyle (i.e., PA and sedentary behaviour) in preschool children,43 results in discordance with ours. In addition, childhood obesity has re-focused attention on the importance of a healthy lifestyle (i.e., PA and ST) in this age group.44 In this context, another study conducted in school age children and adolescents concluded that obesity in childhood and adolescence should be considered a health problem in Latin American countries.4
In the present study, we found that ST is positively related to WC in Chilean and Colombian children. In accordance with our results, it has been reported that those preschool children exhibiting more sedentary behaviour such as ST are more likely to have more AO.45 Moreover, Wuan et al.46 reported that preschool children who do not meet the ST guidelines are at higher risk for overweight and obesity. Similarly, Li et al.47 reported that ST is independently associated with childhood obesity. In accordance with our results, it has been demonstrated that ST increases the BMI, BMI z-score and AO in European preschool children.48
In the present study, we found that worse CRF (i.e., a slow time in test 10×20) was positively correlated with WC and WtHR in Chilean girls and boys, but not in Colombian children. Another study reported that higher CRF is associated with lower AO in Spanish preschool children.49 Similarly, Martínez et al.50 reported a significant association of the 20m shuttle run test (i.e., CRF) with the BMI and WC in preschool children. Additionally, it has been reported that free fat mass is associated with better CRF in preschool children.51 A longitudinal study reported that a high CRF at 4.5 years old is associated with better corporal composition at 5.5 years old in preschool children.52 Finally, further investigation is needed with the aim of clarifying the effects of physical fitness at preschool age on later health outcomes.52
In Chilean children, AO was positively associated with low MD adherence; by contrast, in Colombian children, low MD adherence had an inverse association with AO. It has been reported that high MD adherence is related to lower WC49 and associated with a lower risk of preschoolers developing overweight, obesity and AO in the future.18 Therefore, MD adherence is a relevant modifiable factor to be targeted in educational strategies aiming to prevent central obesity.49 The evidence shows that Chile has the appropriate characteristics for developing MD adherence. Also, MD adherence is a key tool to protect health and is not exclusive to the countries of the Mediterranean basin. It should be a target of community based interventions to promote health.53
LimitationsThe limitations of the present study include those inherent to its transversal character. Another limitation is the self-reporting of parents in relation to the children's PA and food habits, which could mean that these data are underestimated or overestimated. We recognize the need to investigate possible longitudinal effects and to clarify the direction of the associations and carry out interventions in children's lifestyle.
The strengths of this study are that we examined several variables that affect children's development and have contributed to a better understanding of the serious problem of bad lifestyle in Latin-American children.
ConclusionChilean children have a higher prevalence of AO than their Colombian peers. Moreover, AO and excess weight are associated with a poor lifestyle in children of both countries, and are related to worse CRF results. Therefore, interventions to reduce the prevalence of AO should include promoting a healthy lifestyle (i.e., increasing PA after school, reducing ST and improving CRF) in Latin-American children. Strategies for preventing and reducing children's AO, through an accessible, economical and worldwide effort, should be considered as aids in the development of healthy habits and behaviour in schoolchildren.
Authors’ contributionsFC-N and PD-F contributed to the conception, organization and oversight of the study, the drafting of the analysis plan, writing the original manuscript draft and final approval of the version to be published. DJ-M, CP-V, RB-R and AR-O contributed to writing the original manuscript draft and final approval of the version to be published. IPG-G drafted the analysis plan, wrote the original manuscript draft and gave final approval of the version to be published.
FundingThis research received no external funding.
Conflicts of interestThe authors declare no conflict of interest.
The authors thank the teachers, parents, students and the schools (education centres) that participated in the research.


