


Photoplethysmogram (PPG) signal is a non-invasive optical measurement of changes to tissue blood volume, commonly acquired at the fingertip, wrist, or earlobe using a light source and photodetector.1 PPG provides valuable insights into vascular dynamics and peripheral perfusion, facilitating assessment of cardiovascular parameters such as heart rate, respiratory rate, oxygen saturation, and blood pressure (BP).1,2 Recent advances in processing PPG signals have also introduced algorithms that compute new indexes for non-invasive aortic stiffness assessment—a critical cardiovascular risk indicator influenced by various factors—including type 2 diabetes mellitus (T2DM) and hypertension.2,3 Among these, the photoplethysmographic signal augmentation index (PPGAI) represents the ratio of the “AD” and “AB” features, showing the normalized amplitudes of the finger PPG waveform at specific inflection points before and after the peak maximum, corresponding to the 2nd and 1st valleys of the 2nd derivative signal, respectively. Interestingly, beyond providing information on aortic stiffness, the PPGAI seems to be typically higher in individuals with T2DM vs age-matched healthy individuals.3 However, this insight is based on a limited analysis, suggesting a higher PPGAI trend over aging in individuals with T2DM without comprehensive group comparisons.3 More importantly, there is a lack of information on the influence of BP, which may be the actual factor driving changes in the PPG profile rather than a T2DM-specific effect.2,4 Indeed, individuals with T2DM often experience concurrent hypertension. To address these issues, this study aims to verify whether the PPGAI differs significantly between age-matched individuals with T2DM and healthy controls, irrespective of BP variations, through formal statistical analysis on a new, independent dataset.
This objective was pursued by reprocessing a publicly available dataset—detailed in the reference paper5—comprising biodata, raw PPG signals, and BP scores from 219 individuals with and without T2DM. To minimize confounding related to the limited number of young individuals with T2DM, we focused on subjects aged 40 and older, resulting in a subgroup of 155 healthy individuals (76 men and 79 women) and 36 individuals (18 men and 18 women) diagnosed with T2DM (age, 40–86 years; height, 145–187cm; weight, 36–90kg; systolic BP, 90–182mmHg; diastolic BP, 62–107mmHg; heart rate, 52–106bpm; body mass index, 14.7–37.5kg/m2). Subgroup included normotensive (50 healthy, 9 T2DM), prehypertensive (60 healthy, 18 T2DM), stage 1 hypertensive (28 healthy, 6 T2DM), and stage 2 hypertensive (17 healthy, 3 T2DM) participants.
The dataset included 3 resting PPG recordings, each approximately 2s long.5 An R-based script6 isolated individual PPG waveform cycles, normalized each cycle amplitude (0–100), resampled to 1000 data points, and averaged them, forming a representative PPG waveform for each subject. “AB” and “AD” features were, therefore, estimated followed by computing the PPGAI as previously described.3
We statistically compared the PPGAI, AB, and AD indices with and without normalization for mean BP, between healthy individuals and individuals with T2DM using analysis of covariance with age as a covariate. Additionally, we plotted the PPGAI in both groups across age and compared regression line slopes and intercepts.
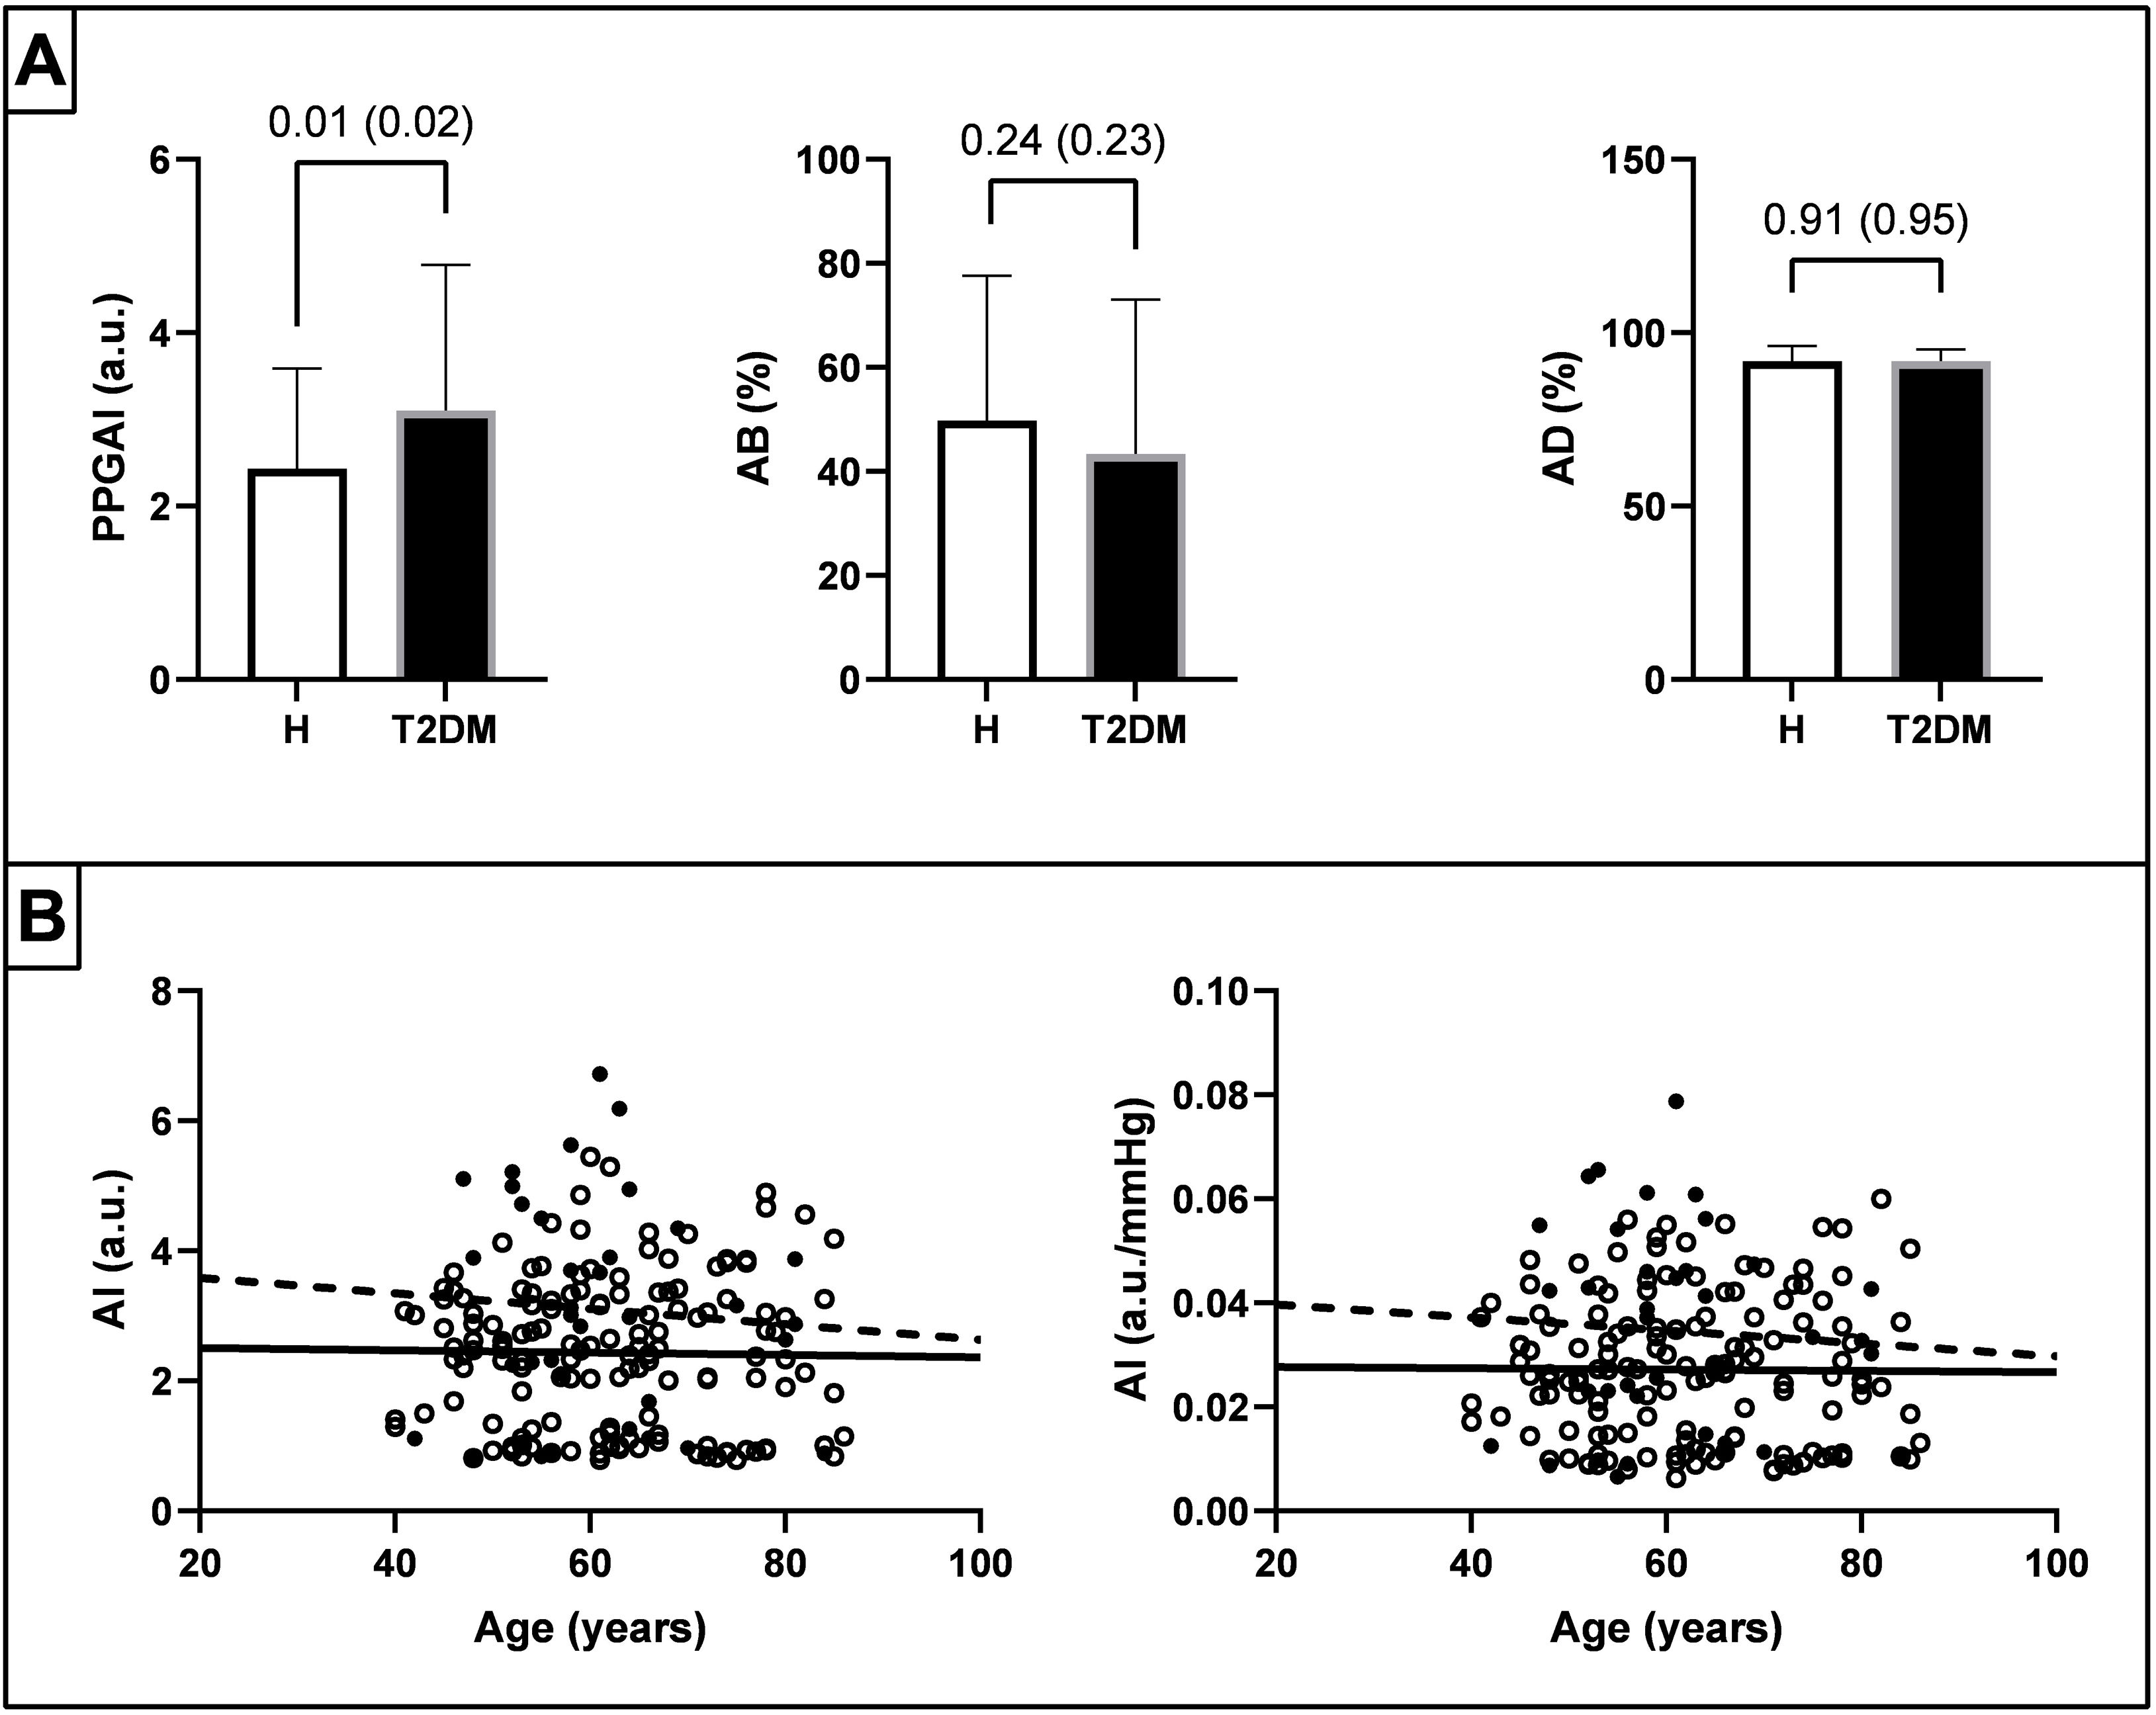
As shown in Fig. 1, the PPGAI was higher (p<0.02) in individuals with T2DM vs healthy subjects considering age as a covariant, both before and after normalization for mean BP, although no differences (p>0.23) were observed in the AB and AD indices. The PPGAI tended to be higher in individuals with T2DM vs healthy individuals throughout life, even after normalization for mean BP. Indeed, while the slopes of the 2 regression lines were similar (p>0.66), the intercept value was higher for individuals with T2DM vs their healthy counterparts (p<0.001).
 and type 2 diabetes mellitus (T2DM) participants. The p-value for the comparison using age as a covariate is indicated before and after (in parentheses) normalizing the indices for mean blood pressure. Panel B shows the scatter plot (healthy individuals: white dots and solid regression line; type 2 diabetes mellitus: black dots and dashed regression line) of PPGAI and PPGAI normalized for mean blood pressure across age.")
Panel A shows the values of PPGAI, AB, and AD indices in healthy (H) and type 2 diabetes mellitus (T2DM) participants. The p-value for the comparison using age as a covariate is indicated before and after (in parentheses) normalizing the indices for mean blood pressure. Panel B shows the scatter plot (healthy individuals: white dots and solid regression line; type 2 diabetes mellitus: black dots and dashed regression line) of PPGAI and PPGAI normalized for mean blood pressure across age.
These results show that the PPGAI could be an easily identifiable biomarker for T2DM, forming the basis for developing a screening tool that leverages simple and cost-effective technology and PPG signal processing. Indeed, individuals diagnosed with T2DM consistently show higher PPGAIs vs age-matched healthy counterparts, regardless of BP values. This suggests specific vascular changes likely associated with T2DM-induced chronic vascular remodeling, as described previously,3,7–9 influencing specific points on the PPG waveform and extending beyond the effects of hypertension.
These conclusions stem from statistical comparisons between healthy individuals and those already diagnosed with T2DM. However, they are constrained by the absence of data on the duration of T2DM at the time of measurement, which limits the ability to assess the time required for PPG profile changes to show. Nevertheless, these findings are significant due to the current lack of established biomarkers in PPG for detecting T2DM and identifying specific points sensitive to the condition. In this context, a critical issue is the delayed awareness of T2DM onset, often occurring years after the disease actual onset. It has been reported that T2DM diagnosis frequently occurs more than 5 years after onset, often coinciding with the manifestation of T2DM-related complications such as retinopathy-induced vision impairment.10 Therefore, although early detection of T2DM is ideal, delayed detection is likewise valuable, as individuals often remain unaware of their condition for extended periods. These outcomes underscore the potential for developing a subsequent T2DM screening technology, possibly integrated into wearable devices including smartwatches and smartphones processing PPG signals.2 These technologies could monitor PPGAI in real-time and longitudinally, capturing data on a metric sensitive to T2DM, and use it as an input into a categorization model to screen for T2DM. Nevertheless, comprehensive data collection is essential to refine a final and functional screening algorithm.
FundingNone declared.
Conflicts of interestNone declared.
Data availabilityThe project reprocesses a publicly available dataset whose source is cited in the text.
