


All-cause mortality and cardiovascular mortality (CVM) risk can be very high in adults with type 2 diabetes mellitus (DM2) with previous cardiovascular disease (CVD). Our objective was to determine this risk among the different clinical spectrum of CVD.
Material and methodsThe DIABET-IC trial is a multicenter, prospective, observational, and analytical study. Consecutive subjects with DM2 attending our outpatients’ clinics were recruited. Data on clinical features, lab test results, and echocardiographic measures were collected.
Patients were categorized depending on the presence and type of CVD: heart failure (HF), coronary artery disease (CAD), cerebrovascular disease (CVD) and peripheral artery disease (PAD).
All-cause mortality and CVM were the dependent variables analyzed. Mortality rate was expressed as deaths per 1000 patients-year. Cox proportional hazards regressions models were used to establish the mortality risk associated with every type of CVD.
ResultsWe studied a total of 1246 patients (mean age, 6.3 (SD, 9.9) years; 31.6%, female) with an initial prevalence of CVD of 59.3%. A total of 122 deaths (46 due to CVD) occurred at the 2.6-year follow-up. All-cause and MCV rates associated with the presence of PAD (85.6/1000 and 33.6/1000, respectively) and HF (72.9/1000 and 28.7/1000 respectively) were the most elevated of all.
In multivariate analysis, HF increased all-cause mortality risk (HR, 1.63; CI 95% 1.03–2.58; P=.037) and the risk of CVM (HR, 3.41; 95% CI, 1.68–6.93; P=.001).
ConclusionsMortality among DM2 patients is highly increased in the presence of HF and PAD. This justifies the screening of these conditions to intensify therapeutic strategies.
El riesgo de mortalidad total y de mortalidad cardiovascular (MCV) de los pacientes con diabetes tipo 2 (DM2) puede ser muy elevado ante la existencia de enfermedad cardiovascular (ECV). Nuestro objetivo fue cuantificar este riesgo considerando las diferentes manifestaciones de ECV.
Materiales y métodosEl estudio DIABET-IC es un estudio multicéntrico, observacional, prospectivo y analítico, con reclutamiento consecutivo de pacientes con DM2 procedentes de consultas externas hospitalarias.
Se recogieron variables clínicas, analíticas y ecocardiográficas, con clasificación de los pacientes en dependencia de la presencia y tipo de ECV: insuficiencia cardiaca (IC), enfermedad arterial coronaria (EACo), enfermedad arterial cerebrovascular (EACe) y enfermedad arterial periférica (EAPe).
Las variables dependientes analizadas fueron mortalidad total y MCV. Se calcularon las tasas por cada 1000 pacientes-año y se realizaron modelos de Cox para determinar el riesgo de mortalidad asociado a cada tipo de ECV.
ResultadosSe incluyeron 1246 pacientes de 67,3 (DE 9,9) años, 31,6% mujeres y con prevalencia inicial de ECV del 59,3%. Durante un seguimiento de 2,6 años, hubo 122 fallecimientos (46 cardiovasculares). Las tasas asociadas a existencia de EAPe (85,6/1000 mortalidad total y 33,6/1000 MCV) e IC (72,9/1000 mortalidad total y 28,7/1000 MCV) fueron las más elevadas.
En análisis multivariante, la IC aumentó el riesgo de mortalidad total (HR 1,63; IC 95% 1,03-2,58; p=0,037) y MCV (HR 3,41; IC 95% 1,68-6,93; p=0,001).
ConclusionesLa mortalidad de los pacientes con DM2 está incrementada, especialmente ante la existencia de IC y EAPe, lo que justifica su cribado para intensificar las medidas terapéuticas.
The presence of diabetes mellitus (DM) increases the risk of mortality.1–3 In a meta-analysis of 97 prospective studies conducted from 1961 through 2007 (Emerging Risk Factors Collaboration), of more than 12 million person-years at the follow-up, the risk of overall mortality and cardiovascular mortality (CVM) was significantly elevated in patients with DM.1 This was observed both in individuals without initial cardiovascular disease (CVD) (HR, 1.80 for overall mortality and HR, 2.32 for CVM), as well as in those with existing CVD (HR, 1.65 for overall mortality and HR, 1.89 for CVM). Data from the UK Biobank2 have demonstrated that, in the absence of prevalent CVD, patients with DM, in an analysis adjusted for other risk factors, have a 50% increased risk of mortality vs the population without DM; however, this risk multiplies by a factor of 3.6 up to 4.9 in the simultaneous presence of diabetes and various signs of CVD. A recent combined analysis from the Emerging Risk Factors Collaboration and the UK Biobank3 has shown that each decade of earlier DM diagnosis increases the risk of overall mortality by 14% and the risk of CVM by 19%.
Specifically, in type 2 DM (T2DM), the application of clinical trial results demonstrating the efficacy of glycemic control,4 blood pressure control,5 lipid control,6 and the simultaneous management of all vascular risk factors7 should have translated into improved patient prognosis.1 Although Data from the Swedish National Diabetes Register confirm a 21% reduction in overall mortality and a 46% reduction in CVM in T2DM patients from 1998 through 2014, this decrease is smaller vs the general population.8
It is necessary to gather updated data on the mortality of patients with diabetes, given the recent availability of glucose-lowering drugs (SGLT2 inhibitors [i-SGLT2] and GLP1 receptor agonists [GLP1-RA]) that can change the prognosis of CVD.9 Although it is widely known that the presence of atherosclerotic cardiovascular disease (ASCVD)10 and heart failure11 increases the risk of overall mortality and CVM, it is essential to quantify the increased risk conferred by each of these complications to effectively stratify patient risk. Identifying T2DM patient groups at the highest risk of death is a priority because, in these patients, an equal relative risk reduction will produce a greater absolute risk reduction, which has been demonstrated in a meta-analysis of i-SGLT2 and GLP1-RA trials, with CVM rates in the placebo groups ranging from 7 up to 125 per 1000 patient-years.12
Our hypothesis was that, at present, the mortality risk of T2DM patients would still be highly variable depending on their initial characteristics. Through the prospective follow-up of a cohort of T2DM patients from outpatient clinics of various Spanish hospitals, our objective was to evaluate the risk of mortality based on the presence and type of initial CVD. Additionally, we analyzed the prevalence of use and clinical efficacy in reducing mortality with the use of i-SGLT2 and GLP1-RA.
Materials and methodsDesignThe DIABET-IC trial was designed as a multicenter, observational, prospective, and analytical study jointly promoted by the Spanish Society of Diabetes and the Spanish Society of Cardiology. It was conducted in 58 hospitals across Spain, with the aim of evaluating the prevalence and incidence of heart failure, as well as the vital prognosis depending on the presence and type of CVD. The incidence data on heart failure will be presented in additional articles.
The planned design was observational and pragmatic, with patient follow-up in a routine clinical practice setting, without specific therapeutic prescription indications. The initial protocol included 1 initial visit and 3 follow-up visits. However, due to the COVID-19 pandemic, the protocol was changed to achieve, at least, the study closure visit in the largest possible number of patients.
The study was conducted following the principles set forth in the Declaration of Helsinki and was approved by Complejo Hospitalario de Toledo Ethics Committee on March 28th, 2018 (identification code 243). All patients signed their informed consent forms prior to their participation in the study.
Inclusion and exclusion criteriaPatients aged 18 years or older with, at least, a 1-year history of T2DM diagnosis according to the American Diabetes Association criteria13 prior to the inclusion visit were included. Patients with and without CVD could be recruited. Exclusion criteria were a diagnosis of T1DM, concomitant participation in any other clinical trial, inability to provide informed consent, stage 5 chronic kidney disease, and an estimated life expectancy of < 3 years due to comorbid conditions.
Patient recruitment was completed consecutively and balanced between in-hospital outpatient endocrinology and cardiology clinics. One endocrinologist and 1 cardiologist jointly evaluated the patients in each participant center.
The initially calculated sample size was 2400 patients to achieve an estimation of the prevalence of heart failure with a precision of ± 1.4%, with a 95% confidence level. For this purpose, 60 hospitals were originally invited to participate, with the first 40 patients from each hospital meeting the inclusion criteria being selected (20 from endocrinology outpatient clinics and 20 from cardiology outpatient clinics).
Dependent variable (endpoint)Each investigator documented, in case of occurrence, both mortality data and whether death was of cardiovascular origin by consulting the patient’s health history. CVM was considered if due to acute coronary syndrome, heart failure, arrhythmic or sudden death, arterial aneurysm rupture, or stroke.
Variables collected at the initial visit- 1
Demographic variables: age and gender.
- 2
Comorbidities and vascular risk factors:
- -
Smoking status classified as current smoker, former smoker, and non-smoker (later grouped into current smoker or non-current smoker).
- -
Hypertension (HTN), defined as confirmed systolic blood pressure (SBP) ≥ 140mmHg, confirmed diastolic blood pressure (DBP) ≥ 90mmHg, or use of antihypertensives.
- -
Dyslipidemia, defined as the use of lipid-lowering agents or total cholesterol levels > 240mg/dL and/or LDL cholesterol > 160mg/dL and/or triglycerides > 200mg/dL and/or HDL cholesterol < 40mg/dL in men vs < 50mg/dL in women.
- -
Cancer diagnosis.
- -
Charlson comorbidity index.
- 3
Initial presence of CVD, defined as the documentation of 1 or more of the following conditions:
- -
Heart failure based on diagnostic criteria from the European Society of Cardiology14 and categorized as heart failure with reduced ejection fraction (HFrEF), with mid-range ejection fraction (HFmEF), or with preserved ejection fraction (HFpEF).
- -
Atherosclerotic cardiovascular disease (ASCVD): presence of coronary artery disease and/or cerebrovascular disease and/or peripheral artery disease. An additional ordinal variable was created with 3 categories: no involvement, involvement of 1 territory, and involvement of > 1 vascular territory.
- -
Coronary artery disease (CAD): documentation of acute myocardial infarction, acute coronary syndrome, coronary revascularization, or coronary stenosis > 50%.
- -
Cerebrovascular disease (CeVD): documentation of ischemic or hemorrhagic stroke or carotid stenosis > 50%.
- -
Peripheral artery disease (PAD): documentation of lower limb artery disease.
- 4
DM-related history: course of the disease, presence of retinopathy, presence of chronic kidney disease (CKD).
- 5
Physical examination: SBP, DBP, weight (kg), height (meters), body mass index (BMI) expressed in kg/m2, waist circumference (cm).
- 6
Lab test results (obtained at each hospital using routine methods): glucose (mg/dL), HbA1c (%), lipid profile including cholesterol, triglycerides, LDL-C, HDL-C, and non-HDL cholesterol (total cholesterol - HDL-C) expressed in mg/dL, estimated glomerular filtration rate (eGFR) using the CKD-EPI formula in mL/min/1.73m2, urinary albumin excretion (UAE) in mg/g of creatinine, hemoglobin (g/dL).
- 7
Electrocardiogram, noting the presence of atrial fibrillation (AF).
- 8
NT-proBNP and echocardiogram, with calculation of left ventricular ejection fraction (LVEF) to determine the presence and classification of heart failure.14 Patients with heart failure were subsequently grouped depending on whether LVEF was < 40% or ≥ 40%.
- 9
Drugs administered at the time of the initial visit completion.
Quantitative variables were expressed as mean and standard deviation (SD) or the median and interquartile range. Qualitative variables were expressed based on their frequency distribution (%).
For the comparison of quantitative variables, the Student t-test for independent samples or the ANOVA test were used, with non-parametric tests being performed if normality assumptions were not met. The comparison of qualitative variables was performed using the chi-square test or Fisher’s exact test.
Patients were followed until their death, study withdrawal, or the final study closure visit scheduled for June 2022. Mortality incidence rates (IR) are expressed per 1000 patient-years. Kaplan-Meier survival curves were created, and mortality rates were compared based on the initial patient characteristics using the log-rank test.
The increased risk of overall mortality and CVM based on initial presence, type of CVD, and number of damaged vascular territories (coded as none, 1, or > 1) was evaluated using univariate and multivariate Cox regression models. Hazard ratios (HR) with their corresponding 95% confidence intervals (CI) are presented. For the statistical analysis, HFmEF and HFpEF categories were grouped due to the limited number of subjects. Multivariate adjustment was performed using statistical criteria (significance of variables in univariate analysis) and their clinical relevance.
P values<0.05 were considered statistically significant.
ResultsFrom May 2018 through March 2020, a total of 1543 patients were evaluated, with the participation of 110 investigators from 58 Spanish hospitals. This analysis includes the 1246 patients for whom mortality information was available at the study closure visit.
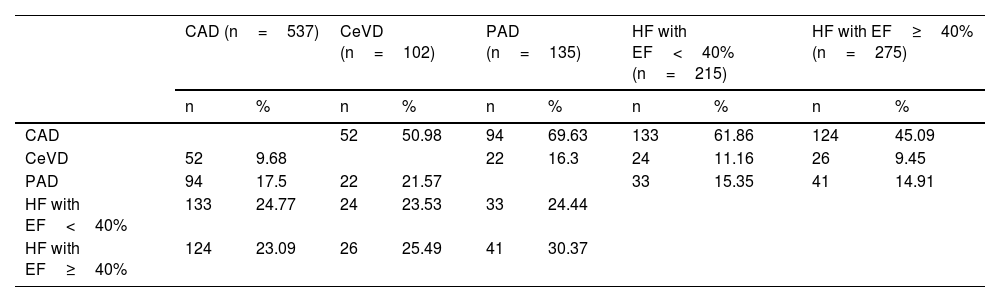
The participants’ mean age was 67.3 years (SD, 9.9), being 31.6%, women. The initial prevalence of total CVD was 59.3%, with the following distribution: heart failure, 39.4% (HFrEF, 17.3%; HFmEF, 8.1%; and HFpEF, 14%), ASCVD, 49.9% (with 10.9% of patients having > 1 vascular territory affected by atherosclerosis); CAD, 43.1%; CeVD, 8.2%; and PAD, 10.8%. Table 1 shows the percentage of patients with a specific type of CVD who simultaneously have another type of CVD. Notably, among patients with PAD, almost 70% had CAD, 16% had CeVD, and 55% had heart failure.
Cross-cardiovascular involvement among vascular territories.
| CAD (n=537) | CeVD (n=102) | PAD (n=135) | HF with EF<40% (n=215) | HF with EF≥40% (n=275) | ||||||
|---|---|---|---|---|---|---|---|---|---|---|
| n | % | n | % | n | % | n | % | n | % | |
| CAD | 52 | 50.98 | 94 | 69.63 | 133 | 61.86 | 124 | 45.09 | ||
| CeVD | 52 | 9.68 | 22 | 16.3 | 24 | 11.16 | 26 | 9.45 | ||
| PAD | 94 | 17.5 | 22 | 21.57 | 33 | 15.35 | 41 | 14.91 | ||
| HF with EF<40% | 133 | 24.77 | 24 | 23.53 | 33 | 24.44 | ||||
| HF with EF≥40% | 124 | 23.09 | 26 | 25.49 | 41 | 30.37 | ||||
CeVD, cerebrovascular disease; CAD, coronary artery disease; PAD, peripheral artery disease; EF, ejection fraction; HF, heart failure; %, percentage of patients with a specific type of CVD who simultaneously have another type of CVD.
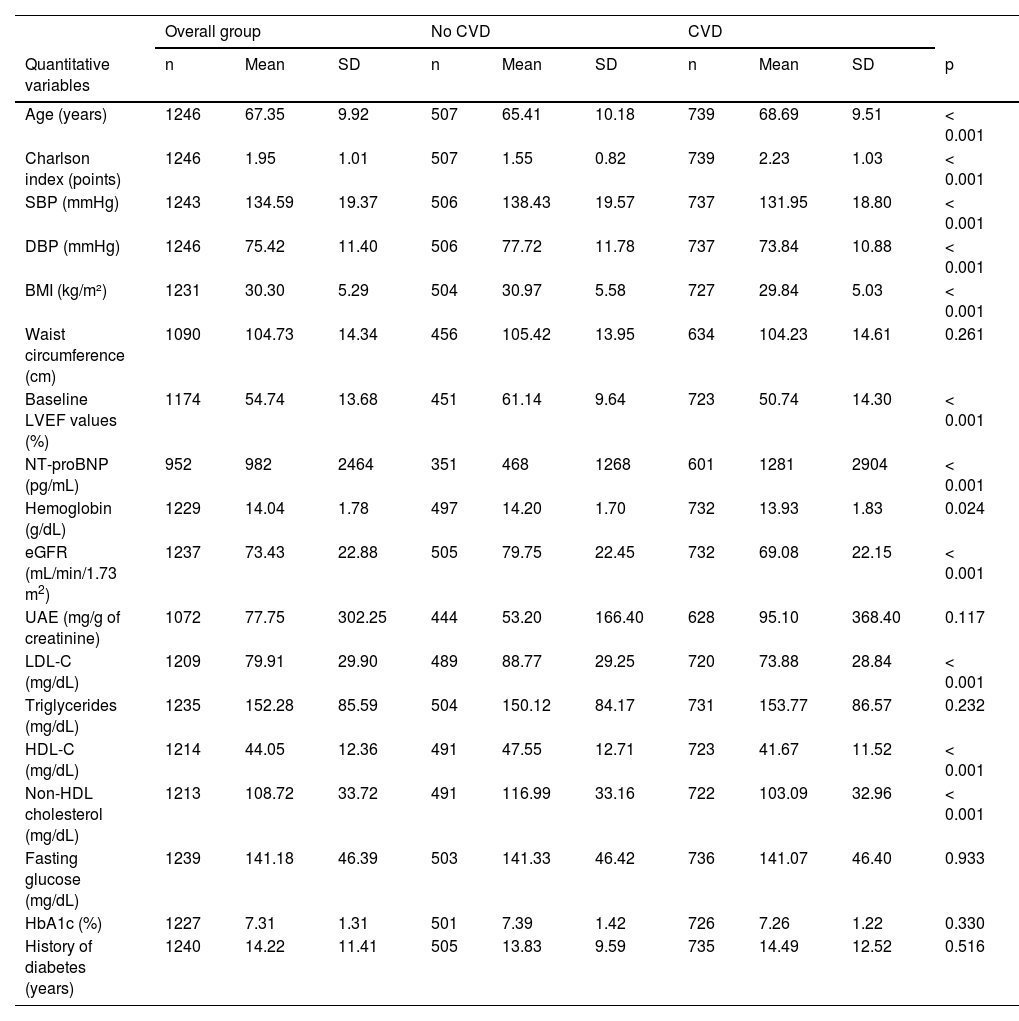
The overall characteristics of the patients and, also, based on whether they showed any signs of CVD are shown in Table 2. As can be seen, patients with CVD were older, had a higher Charlson score, a lower proportion of women, lower BMI, lower eGFR with higher UAE, and higher NT-proBNP levels, along with lower LVEF. Patients with CVD had better control of vascular risk factors, with a lower proportion of active smokers and lower BP and lipid levels (LDL-C and non-HDL cholesterol), which may be justified by the greater use of antihypertensives and lipid-lowering agents. However, only 46.3% of participants with CVD had HbA1c<7%, 43.8% had SBP<130mmHg, and 30.8% had non-HDL cholesterol<85mg/dL. In patients with CVD, there a high use of statins was reported (90.3%), yet the use of ezetimibe (22.3%) and PCSK9 inhibitors (1.3%) was low, despite a high proportion of patients not meeting lipid therapeutic goals. Regarding glucose-lowering treatment, 39.4% of patients with CVD were on i-SGLT2 and 12% on GLP1-RA.
Characteristics of patients based on the initial presence of CVD.
| Overall group | No CVD | CVD | ||||||||
|---|---|---|---|---|---|---|---|---|---|---|
| Quantitative variables | n | Mean | SD | n | Mean | SD | n | Mean | SD | p |
| Age (years) | 1246 | 67.35 | 9.92 | 507 | 65.41 | 10.18 | 739 | 68.69 | 9.51 | < 0.001 |
| Charlson index (points) | 1246 | 1.95 | 1.01 | 507 | 1.55 | 0.82 | 739 | 2.23 | 1.03 | < 0.001 |
| SBP (mmHg) | 1243 | 134.59 | 19.37 | 506 | 138.43 | 19.57 | 737 | 131.95 | 18.80 | < 0.001 |
| DBP (mmHg) | 1246 | 75.42 | 11.40 | 506 | 77.72 | 11.78 | 737 | 73.84 | 10.88 | < 0.001 |
| BMI (kg/m²) | 1231 | 30.30 | 5.29 | 504 | 30.97 | 5.58 | 727 | 29.84 | 5.03 | < 0.001 |
| Waist circumference (cm) | 1090 | 104.73 | 14.34 | 456 | 105.42 | 13.95 | 634 | 104.23 | 14.61 | 0.261 |
| Baseline LVEF values (%) | 1174 | 54.74 | 13.68 | 451 | 61.14 | 9.64 | 723 | 50.74 | 14.30 | < 0.001 |
| NT-proBNP (pg/mL) | 952 | 982 | 2464 | 351 | 468 | 1268 | 601 | 1281 | 2904 | < 0.001 |
| Hemoglobin (g/dL) | 1229 | 14.04 | 1.78 | 497 | 14.20 | 1.70 | 732 | 13.93 | 1.83 | 0.024 |
| eGFR (mL/min/1.73 m2) | 1237 | 73.43 | 22.88 | 505 | 79.75 | 22.45 | 732 | 69.08 | 22.15 | < 0.001 |
| UAE (mg/g of creatinine) | 1072 | 77.75 | 302.25 | 444 | 53.20 | 166.40 | 628 | 95.10 | 368.40 | 0.117 |
| LDL-C (mg/dL) | 1209 | 79.91 | 29.90 | 489 | 88.77 | 29.25 | 720 | 73.88 | 28.84 | < 0.001 |
| Triglycerides (mg/dL) | 1235 | 152.28 | 85.59 | 504 | 150.12 | 84.17 | 731 | 153.77 | 86.57 | 0.232 |
| HDL-C (mg/dL) | 1214 | 44.05 | 12.36 | 491 | 47.55 | 12.71 | 723 | 41.67 | 11.52 | < 0.001 |
| Non-HDL cholesterol (mg/dL) | 1213 | 108.72 | 33.72 | 491 | 116.99 | 33.16 | 722 | 103.09 | 32.96 | < 0.001 |
| Fasting glucose (mg/dL) | 1239 | 141.18 | 46.39 | 503 | 141.33 | 46.42 | 736 | 141.07 | 46.40 | 0.933 |
| HbA1c (%) | 1227 | 7.31 | 1.31 | 501 | 7.39 | 1.42 | 726 | 7.26 | 1.22 | 0.330 |
| History of diabetes (years) | 1240 | 14.22 | 11.41 | 505 | 13.83 | 9.59 | 735 | 14.49 | 12.52 | 0.516 |
| Overall group | No CVD | CVD | |||||
|---|---|---|---|---|---|---|---|
| Quantitative variables | n | % | n | % | n | % | p |
| Sex (% female) | 394 | 31.62 | 217 | 42.80 | 177 | 23.95 | < 0.001 |
| HbA1c < 7% (%) | 555 | 45.23 | 219 | 43.71 | 336 | 46.28 | < 0.001 |
| SBP<130mmHg (%) | 476 | 38.29 | 153 | 30.24 | 323 | 43.83 | < 0.001 |
| Non-HDL cholesterol (mg/dL) | |||||||
| < 85 | 299 | 24.65 | 77 | 15.68 | 222 | 30.75 | < 0.001 |
| 85–99 | 251 | 20.69 | 93 | 18.94 | 158 | 21.88 | |
| 100–130 | 378 | 31.16 | 170 | 34.62 | 208 | 28.81 | |
| > 130 | 285 | 23.50 | 151 | 30.75 | 134 | 18.56 | |
| Current smoker (%) | 127 | 10.19 | 56 | 11.05 | 71 | 9.61 | < 0.001 |
| CKD stage (%) | |||||||
| Stage 1 (≥ 90) | 34 | 8.79 | 17 | 15.18 | 17 | 6.18 | < 0.001 |
| Stage 2 (60–89) | 103 | 26.61 | 40 | 35.71 | 63 | 22.91 | |
| Stage 3 (30–59) | 221 | 57.11 | 50 | 44.64 | 171 | 62.18 | |
| Stage 4 (15–29) | 25 | 6.46 | 5 | 4.46 | 20 | 7.27 | |
| Stage 5 (<15) | 4 | 1.03 | 0 | 0.00 | 4 | 1.45 | |
| UAE (%) | |||||||
| UAE < 30 | 774 | 72.20 | 340 | 76.58 | 434 | 69.11 | 0.021 |
| UAE = [30, 300) | 247 | 23.04 | 84 | 18.92 | 163 | 25.96 | |
| UAE ≥ 300 | 51 | 4.76 | 20 | 4.50 | 31 | 4.94 | |
| Sulfonylurea (%) | 116 | 9.31 | 61 | 12.03 | 55 | 7.44 | 0.006 |
| Metformin (%) | 917 | 73.60 | 389 | 76.73 | 528 | 71.45 | 0.038 |
| i-SGLT2 (%) | 475 | 38.12 | 184 | 36.29 | 291 | 39.38 | 0.271 |
| GLP1-RA (%) | 195 | 15.65 | 106 | 20.91 | 89 | 12.04 | < 0.001 |
| i-DPP4 (%) | 422 | 33.87 | 165 | 32.54 | 257 | 34.78 | 0.413 |
| Pioglitazone (%) | 18 | 1.44 | 12 | 2.37 | 6 | 0.81 | 0.024 |
| Insulin (%) | 525 | 42.13 | 242 | 47.73 | 283 | 38.29 | < 0.001 |
| Mineralocorticoid antagonists (%) | 279 | 22.39 | 45 | 8.88 | 234 | 31.66 | < 0.001 |
| ACEi (%) | 415 | 33.31 | 139 | 27.42 | 276 | 37.35 | < 0.001 |
| ARBs (%) | 436 | 34.99 | 199 | 39.25 | 237 | 32.07 | 0.009 |
| Sacubitril/Valsartan (%) | 147 | 11.77 | 20 | 3.94 | 127 | 17.19 | < 0.001 |
| Beta blockers (%) | 751 | 60.27 | 177 | 34.91 | 574 | 77.67 | < 0.001 |
| Statins (%) | 1,049 | 84.19 | 382 | 75.35 | 667 | 90.26 | < 0.001 |
| Anti-PCSK9 (%) | 12 | 0.96 | 2 | 0.39 | 10 | 1.35 | 0.089 |
| Ezetimibe (%) | 219 | 17.58 | 54 | 10.65 | 165 | 22.33 | < 0.001 |
| Antiplatelet agents (%) | 659 | 52.89 | 177 | 34.91 | 482 | 65.22 | < 0.001 |
UAE, urinary albumin excretion; CKD, chronic kidney disease; FEVI, left ventricular ejection fraction; BMI, body mass index; DBP, diastolic blood pressure; SBP, systolic blood pressure; eGFR, estimated glomerular filtration rate.
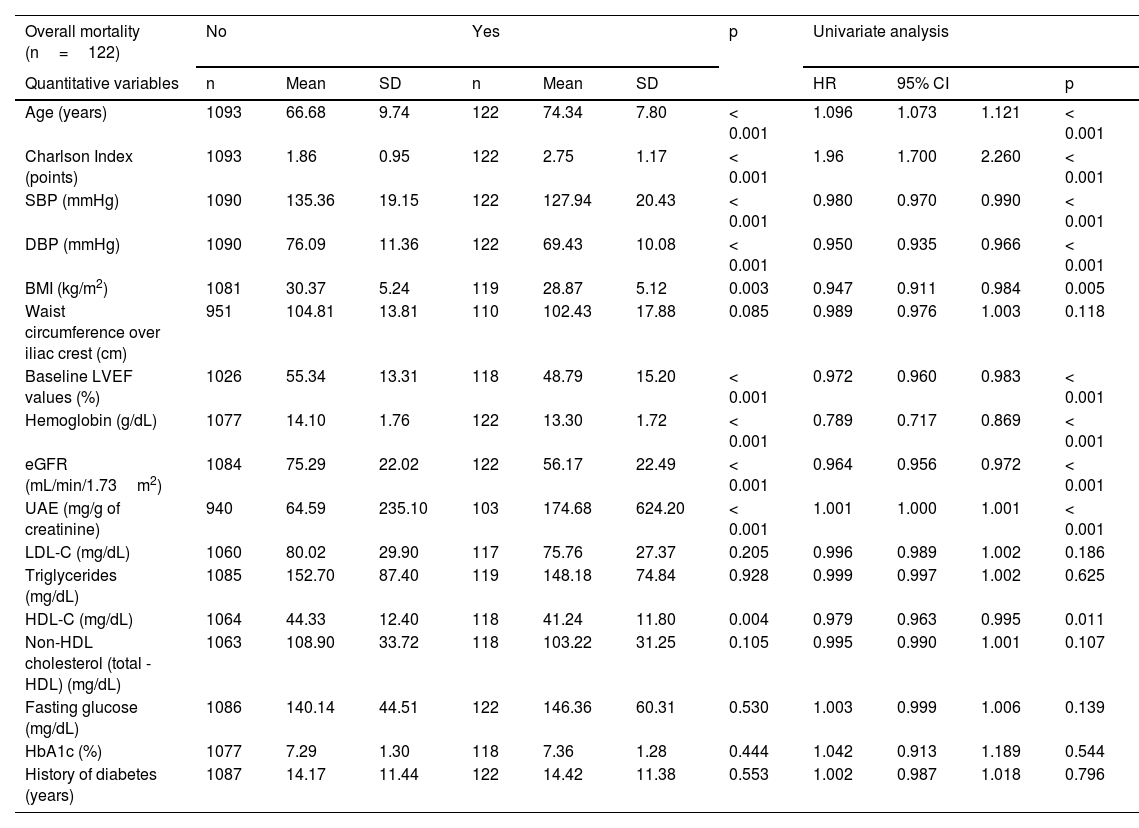
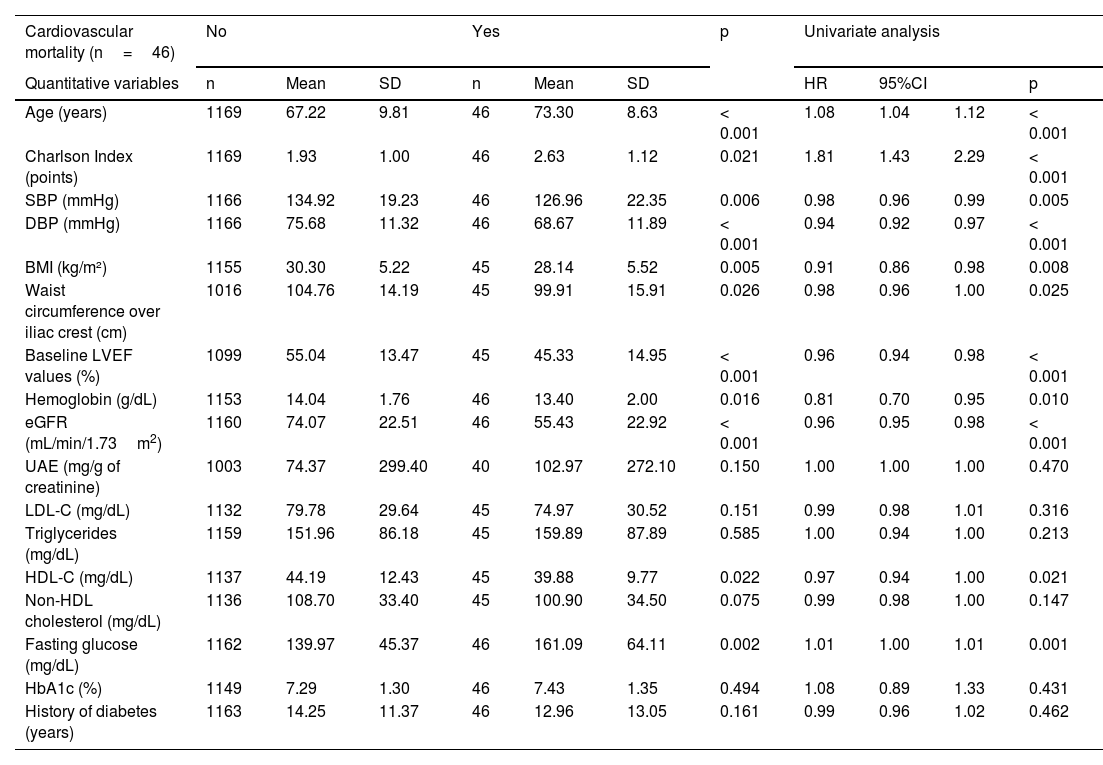
During a mean follow-up of 2.6 years, a total of 122 deaths were reported, 46 of which were due to cardiovascular causes. The characteristics of the participants categorized into those who died or did not and into those who died or did not from cardiovascular causes are summarized in Tables 3 and 4. Patients who died were older, had a higher Charlson score, a higher prevalence of cancer diagnosis, higher UAE levels, and lower BP, BMI, HDL-C, hemoglobin, eGFR, and LVEF levels, as well as higher prevalences of microvascular and macrovascular complications. The pattern was similar in those whose cause of death was cardiovascular.
Initial characteristics of patients based on mortality prognosis with univariate Cox analysis for each variable.
| Overall mortality (n=122) | No | Yes | p | Univariate analysis | |||||||
|---|---|---|---|---|---|---|---|---|---|---|---|
| Quantitative variables | n | Mean | SD | n | Mean | SD | HR | 95% CI | p | ||
| Age (years) | 1093 | 66.68 | 9.74 | 122 | 74.34 | 7.80 | < 0.001 | 1.096 | 1.073 | 1.121 | < 0.001 |
| Charlson Index (points) | 1093 | 1.86 | 0.95 | 122 | 2.75 | 1.17 | < 0.001 | 1.96 | 1.700 | 2.260 | < 0.001 |
| SBP (mmHg) | 1090 | 135.36 | 19.15 | 122 | 127.94 | 20.43 | < 0.001 | 0.980 | 0.970 | 0.990 | < 0.001 |
| DBP (mmHg) | 1090 | 76.09 | 11.36 | 122 | 69.43 | 10.08 | < 0.001 | 0.950 | 0.935 | 0.966 | < 0.001 |
| BMI (kg/m2) | 1081 | 30.37 | 5.24 | 119 | 28.87 | 5.12 | 0.003 | 0.947 | 0.911 | 0.984 | 0.005 |
| Waist circumference over iliac crest (cm) | 951 | 104.81 | 13.81 | 110 | 102.43 | 17.88 | 0.085 | 0.989 | 0.976 | 1.003 | 0.118 |
| Baseline LVEF values (%) | 1026 | 55.34 | 13.31 | 118 | 48.79 | 15.20 | < 0.001 | 0.972 | 0.960 | 0.983 | < 0.001 |
| Hemoglobin (g/dL) | 1077 | 14.10 | 1.76 | 122 | 13.30 | 1.72 | < 0.001 | 0.789 | 0.717 | 0.869 | < 0.001 |
| eGFR (mL/min/1.73m2) | 1084 | 75.29 | 22.02 | 122 | 56.17 | 22.49 | < 0.001 | 0.964 | 0.956 | 0.972 | < 0.001 |
| UAE (mg/g of creatinine) | 940 | 64.59 | 235.10 | 103 | 174.68 | 624.20 | < 0.001 | 1.001 | 1.000 | 1.001 | < 0.001 |
| LDL-C (mg/dL) | 1060 | 80.02 | 29.90 | 117 | 75.76 | 27.37 | 0.205 | 0.996 | 0.989 | 1.002 | 0.186 |
| Triglycerides (mg/dL) | 1085 | 152.70 | 87.40 | 119 | 148.18 | 74.84 | 0.928 | 0.999 | 0.997 | 1.002 | 0.625 |
| HDL-C (mg/dL) | 1064 | 44.33 | 12.40 | 118 | 41.24 | 11.80 | 0.004 | 0.979 | 0.963 | 0.995 | 0.011 |
| Non-HDL cholesterol (total - HDL) (mg/dL) | 1063 | 108.90 | 33.72 | 118 | 103.22 | 31.25 | 0.105 | 0.995 | 0.990 | 1.001 | 0.107 |
| Fasting glucose (mg/dL) | 1086 | 140.14 | 44.51 | 122 | 146.36 | 60.31 | 0.530 | 1.003 | 0.999 | 1.006 | 0.139 |
| HbA1c (%) | 1077 | 7.29 | 1.30 | 118 | 7.36 | 1.28 | 0.444 | 1.042 | 0.913 | 1.189 | 0.544 |
| History of diabetes (years) | 1087 | 14.17 | 11.44 | 122 | 14.42 | 11.38 | 0.553 | 1.002 | 0.987 | 1.018 | 0.796 |
| Overall mortality (n=122) | No | Yes | p | HR | 95%CI | p | |||
|---|---|---|---|---|---|---|---|---|---|
| Qualitative variable | n | % | n | % | |||||
| Sex (% female) | 349 | 31.93 | 35 | 28.69 | 0.465 | 0.893 | 0.603 | 1.322 | 0.572 |
| HTN (%) | 884 | 80.88 | 106 | 86.89 | 0.105 | 1.484 | 0.877 | 2.510 | 0.141 |
| Dyslipidemia (%) | 886 | 81.06 | 99 | 81.15 | 0.982 | 0.918 | 0.583 | 1.446 | 0.712 |
| Smoking (% current smoker) | 108 | 9.88 | 13 | 10.66 | 0.643 | 1.124 | 0.614 | 2.055 | 0.705 |
| Cancer (%) | 77 | 7.04 | 17 | 13.93 | 0.007 | 1.983 | 1.187 | 3.312 | 0.009 |
| Severe hypoglycemia in the last year (%) | 23 | 2.10 | 3 | 2.46 | 0.797 | 1.325 | 0.421 | 4.168 | 0.631 |
| Retinopathy (%) | 145 | 13.30 | 24 | 19.70 | 0.137 | 1.607 | 1.028 | 2.512 | 0.038 |
| i-SGLT2 (%) | 435 | 39.80 | 28 | 22.95 | < 0.001 | 0.473 | 0.310 | 0.722 | 0.001 |
| GLP1-RA (%) | 185 | 16.93 | 4 | 3.28 | < 0.001 | 0.177 | 0.065 | 0.479 | 0.001 |
| Insulin (%) | 449 | 41.08 | 60 | 49.18 | 0.085 | 1.376 | 0.965 | 1.963 | 0.078 |
| Cardiovascular disease (%) | 626 | 57.38 | 97 | 79.51 | < 0.001 | 2.688 | 1.732 | 4.174 | < 0.001 |
| Heart failure (%) | 391 | 35.77 | 89 | 72.95 | < 0.001 | 4.44 | 2.98 | 6.62 | < 0.001 |
| Heart failure (%). The reference category is the absence of heart failure | |||||||||
| Depressed LVEF (%) | 173 | 15.89 | 39 | 31.97 | < 0.001 | 4.332 | 2.723 | 6.892 | < 0.001 |
| Intermediate LVEF (%) | 80 | 7.35 | 15 | 12.30 | 3.491 | 1.896 | 6.429 | < 0.001 | |
| Preserved LVEF (%) | 138 | 12.67 | 35 | 28.69 | 5.105 | 3.171 | 8.219 | < 0.001 | |
| Cerebrovascular disease (%) | 82 | 7.51 | 18 | 14.75 | 0.006 | 2.057 | 1.247 | 3.394 | 0.005 |
| Peripheral artery disease (%) | 104 | 9.52 | 28 | 22.95 | < 0.001 | 2.631 | 1.725 | 4.013 | < 0.001 |
| Coronary artery disease (%) | 459 | 42.07 | 66 | 54.10 | 0.011 | 1.537 | 1.076 | 2.195 | 0.018 |
| Vascular territories affected (%) | < 0.001 | ||||||||
| 0 territories (%) | 561 | 51.37 | 44 | 36.07 | 1 (Ref) | ||||
| 1 territory (%) | 425 | 38.92 | 52 | 42.62 | 1.471 | 0.984 | 2.199 | 0.060 | |
| > 1 territory (%) | 106 | 9.71 | 26 | 21.31 | 2.909 | 1.791 | 4.726 | < 0.001 | |
| Atrial fibrillation (%) | 217 | 19.89 | 53 | 43.44 | < 0.001 | 2.809 | 1.963 | 4.019 | < 0.001 |
| CKD stage (%) | 0.002 | ||||||||
| Stage 1 (≥ 90) | 30 | 9.62 | 4 | 6.15 | 1 (Ref) | ||||
| Stage 2 (60–89) | 94 | 30.13 | 7 | 10.77 | 0.547 | 0.160 | 1.868 | 0.336 | |
| Stage 3 (30–59) | 169 | 54.17 | 44 | 67.69 | 1.690 | 0.607 | 4.704 | 0.315 | |
| Stage 4 (15–29) | 17 | 5.45 | 8 | 12.31 | 2.951 | 0.888 | 9.808 | 0.077 | |
| Stage 5 (< 15) | 2 | 0.64 | 2 | 3.08 | 5.298 | 0.968 | 28.992 | 0.055 | |
| UAE (%) | 0.067 | ||||||||
| UAE < 30 | 687 | 73.09 | 68 | 66.02 | 1 (Ref) | ||||
| UAE = [30, 300) | 215 | 22.87 | 26 | 25.24 | 1.244 | 0.791 | 1.956 | 0.344 | |
| UAE ≥ 300 | 38 | 4.04 | 9 | 8.74 | 2.190 | 1.092 | 4.391 | 0.027 | |
UAE, urinary albumin excretion; CKD, chronic kidney disease; FEVI, left ventricular ejection fraction; HTN, arterial hypertension; BMI, body mass index; DBP, diastolic blood pressure; SBP, systolic blood pressure; eGFR, estimated glomerular filtration rate.
Initial characteristics of patients based on whether they died from cardiovascular causes with univariate Cox analysis for each variable.
| Cardiovascular mortality (n=46) | No | Yes | p | Univariate analysis | |||||||
|---|---|---|---|---|---|---|---|---|---|---|---|
| Quantitative variables | n | Mean | SD | n | Mean | SD | HR | 95%CI | p | ||
| Age (years) | 1169 | 67.22 | 9.81 | 46 | 73.30 | 8.63 | < 0.001 | 1.08 | 1.04 | 1.12 | < 0.001 |
| Charlson Index (points) | 1169 | 1.93 | 1.00 | 46 | 2.63 | 1.12 | 0.021 | 1.81 | 1.43 | 2.29 | < 0.001 |
| SBP (mmHg) | 1166 | 134.92 | 19.23 | 46 | 126.96 | 22.35 | 0.006 | 0.98 | 0.96 | 0.99 | 0.005 |
| DBP (mmHg) | 1166 | 75.68 | 11.32 | 46 | 68.67 | 11.89 | < 0.001 | 0.94 | 0.92 | 0.97 | < 0.001 |
| BMI (kg/m²) | 1155 | 30.30 | 5.22 | 45 | 28.14 | 5.52 | 0.005 | 0.91 | 0.86 | 0.98 | 0.008 |
| Waist circumference over iliac crest (cm) | 1016 | 104.76 | 14.19 | 45 | 99.91 | 15.91 | 0.026 | 0.98 | 0.96 | 1.00 | 0.025 |
| Baseline LVEF values (%) | 1099 | 55.04 | 13.47 | 45 | 45.33 | 14.95 | < 0.001 | 0.96 | 0.94 | 0.98 | < 0.001 |
| Hemoglobin (g/dL) | 1153 | 14.04 | 1.76 | 46 | 13.40 | 2.00 | 0.016 | 0.81 | 0.70 | 0.95 | 0.010 |
| eGFR (mL/min/1.73m2) | 1160 | 74.07 | 22.51 | 46 | 55.43 | 22.92 | < 0.001 | 0.96 | 0.95 | 0.98 | < 0.001 |
| UAE (mg/g of creatinine) | 1003 | 74.37 | 299.40 | 40 | 102.97 | 272.10 | 0.150 | 1.00 | 1.00 | 1.00 | 0.470 |
| LDL-C (mg/dL) | 1132 | 79.78 | 29.64 | 45 | 74.97 | 30.52 | 0.151 | 0.99 | 0.98 | 1.01 | 0.316 |
| Triglycerides (mg/dL) | 1159 | 151.96 | 86.18 | 45 | 159.89 | 87.89 | 0.585 | 1.00 | 0.94 | 1.00 | 0.213 |
| HDL-C (mg/dL) | 1137 | 44.19 | 12.43 | 45 | 39.88 | 9.77 | 0.022 | 0.97 | 0.94 | 1.00 | 0.021 |
| Non-HDL cholesterol (mg/dL) | 1136 | 108.70 | 33.40 | 45 | 100.90 | 34.50 | 0.075 | 0.99 | 0.98 | 1.00 | 0.147 |
| Fasting glucose (mg/dL) | 1162 | 139.97 | 45.37 | 46 | 161.09 | 64.11 | 0.002 | 1.01 | 1.00 | 1.01 | 0.001 |
| HbA1c (%) | 1149 | 7.29 | 1.30 | 46 | 7.43 | 1.35 | 0.494 | 1.08 | 0.89 | 1.33 | 0.431 |
| History of diabetes (years) | 1163 | 14.25 | 11.37 | 46 | 12.96 | 13.05 | 0.161 | 0.99 | 0.96 | 1.02 | 0.462 |
| Cardiovascular mortality (n=46) | No | Yes | p | HR | 95% CI | p | |||
|---|---|---|---|---|---|---|---|---|---|
| Quantitative variables | n | % | n | % | |||||
| Sex (% female) | 374 | 31.99 | 10 | 21.74 | 0.142 | 0.62 | 0.31 | 1.24 | 0.178 |
| HTN (%) | 949 | 81.18 | 41 | 89.13 | 0.173 | 1.84 | 0.73 | 4.65 | 0.200 |
| Dyslipidemia (%) | 946 | 80.92 | 39 | 84.78 | 0.512 | 1.19 | 0.53 | 2.66 | 0.677 |
| Smoking (% current smoker) | 114 | 9.75 | 7 | 15.22 | 0.633 | 1.68 | 0.71 | 3.98 | 0.238 |
| Severe hypoglycemia (%) | 26 | 2.22 | 0 | 0.00 | 0.307 | 0.00 | 0.00 | 0.00 | 0.996 |
| Retinopathy (%) | 160 | 13.70 | 9 | 19.60 | 0.718 | 1.59 | 0.77 | 3.30 | 0.212 |
| i-SGLT2 (%) | 456 | 39.01 | 7 | 15.22 | 0.001 | 0.28 | 0.13 | 0.64 | 0.002 |
| GLP1-RA (%) | 187 | 16.00 | 2 | 4.35 | 0.033 | 0.24 | 0.06 | 0.97 | 0.046 |
| Insulin (%) | 487 | 41.66 | 22 | 47.83 | 0.406 | 1.30 | 0.73 | 2.32 | 0.373 |
| Cardiovascular disease (%) | 683 | 58.53 | 40 | 86.96 | < 0.001 | 4.62 | 1.96 | 10.91 | < 0.001 |
| Heart failure (%) | 445 | 38.07 | 35 | 76.09 | < 0.001 | 5.26 | 2.67 | 10.37 | < 0.001 |
| Depressed LVEF (%) | 192 | 16.48 | 20 | 43.48 | < 0.001 | 6.71 | 3.21 | 14.03 | < 0.001 |
| Intermediate LVEF (%) | 88 | 7.55 | 7 | 15.22 | 4.92 | 1.91 | 12.69 | 0.001 | |
| Preserved LVEF (%) | 165 | 14.16 | 8 | 17.39 | 3.50 | 1.41 | 8.71 | 0.007 | |
| Cerebrovascular disease (%) | 93 | 7.96 | 7 | 15.22 | 0.079 | 2.13 | 0.95 | 4.76 | 0.066 |
| Peripheral artery disease (%) | 121 | 10.36 | 11 | 23.91 | 0.004 | 2.77 | 1.41 | 5.47 | 0.003 |
| Coronary artery disease (%) | 500 | 42.84 | 25 | 54.35 | 0.122 | 1.55 | 0.87 | 2.78 | 0.136 |
| Vascular territories affected (%) | |||||||||
| 0 territories (%) | 591 | 50.60 | 14 | 30.43 | 0.016 | 1 (Ref) | |||
| 1 territory (%) | 454 | 38.87 | 23 | 50.00 | 2.05 | 1.05 | 3.98 | 0.035 | |
| > 1 territory (%) | 123 | 10.53 | 9 | 19.57 | 3.16 | 1.37 | 7.31 | 0.007 | |
| Atrial fibrillation (%) | 252 | 21.59 | 18 | 39.13 | 0.005 | 2.34 | 1.30 | 4.24 | 0.005 |
| CKD stage (%) | |||||||||
| Stage 1 (≥ 90) | 33 | 9.27 | 1 | 4.76 | 0.005 | 1 (Ref) | |||
| Stage 2 (60–89) | 100 | 28.09 | 1 | 4.76 | 0.31 | 0.02 | 5.00 | 0.411 | |
| Stage 3 (30–59) | 199 | 55.90 | 14 | 66.67 | 2.16 | 0.28 | 16.44 | 0.457 | |
| Stage 4 (15–29) | 20 | 5.62 | 5 | 23.81 | 7.48 | 0.87 | 64.10 | 0.067 | |
| Stage 5 (< 15) | 4 | 1.12 | 0 | 0.00 | 0.158 | 0.00 | 0.00 | 0.00 | 0.997 |
| UAE (%) | |||||||||
| UAE < 30 | 730 | 72.78 | 25 | 62.50 | 1 (Ref) | ||||
| UAE = [30, 300) | 230 | 22.93 | 11 | 27.50 | 1.43 | 0.70 | 2.91 | 0.324 | |
| UAE ≥ 300 | 43 | 4.29 | 4 | 10.00 | 2.61 | 0.91 | 7.51 | 0.075 | |
UAE, urinary albumin excretion; ERC, chronic kidney disease; LVEF, left ventricular ejection fraction; HTN, arterial hypertension; BMI, body mass index; DBP, diastolic blood pressure; SBP, systolic blood pressure; eGFR, estimated glomerular filtration rate.
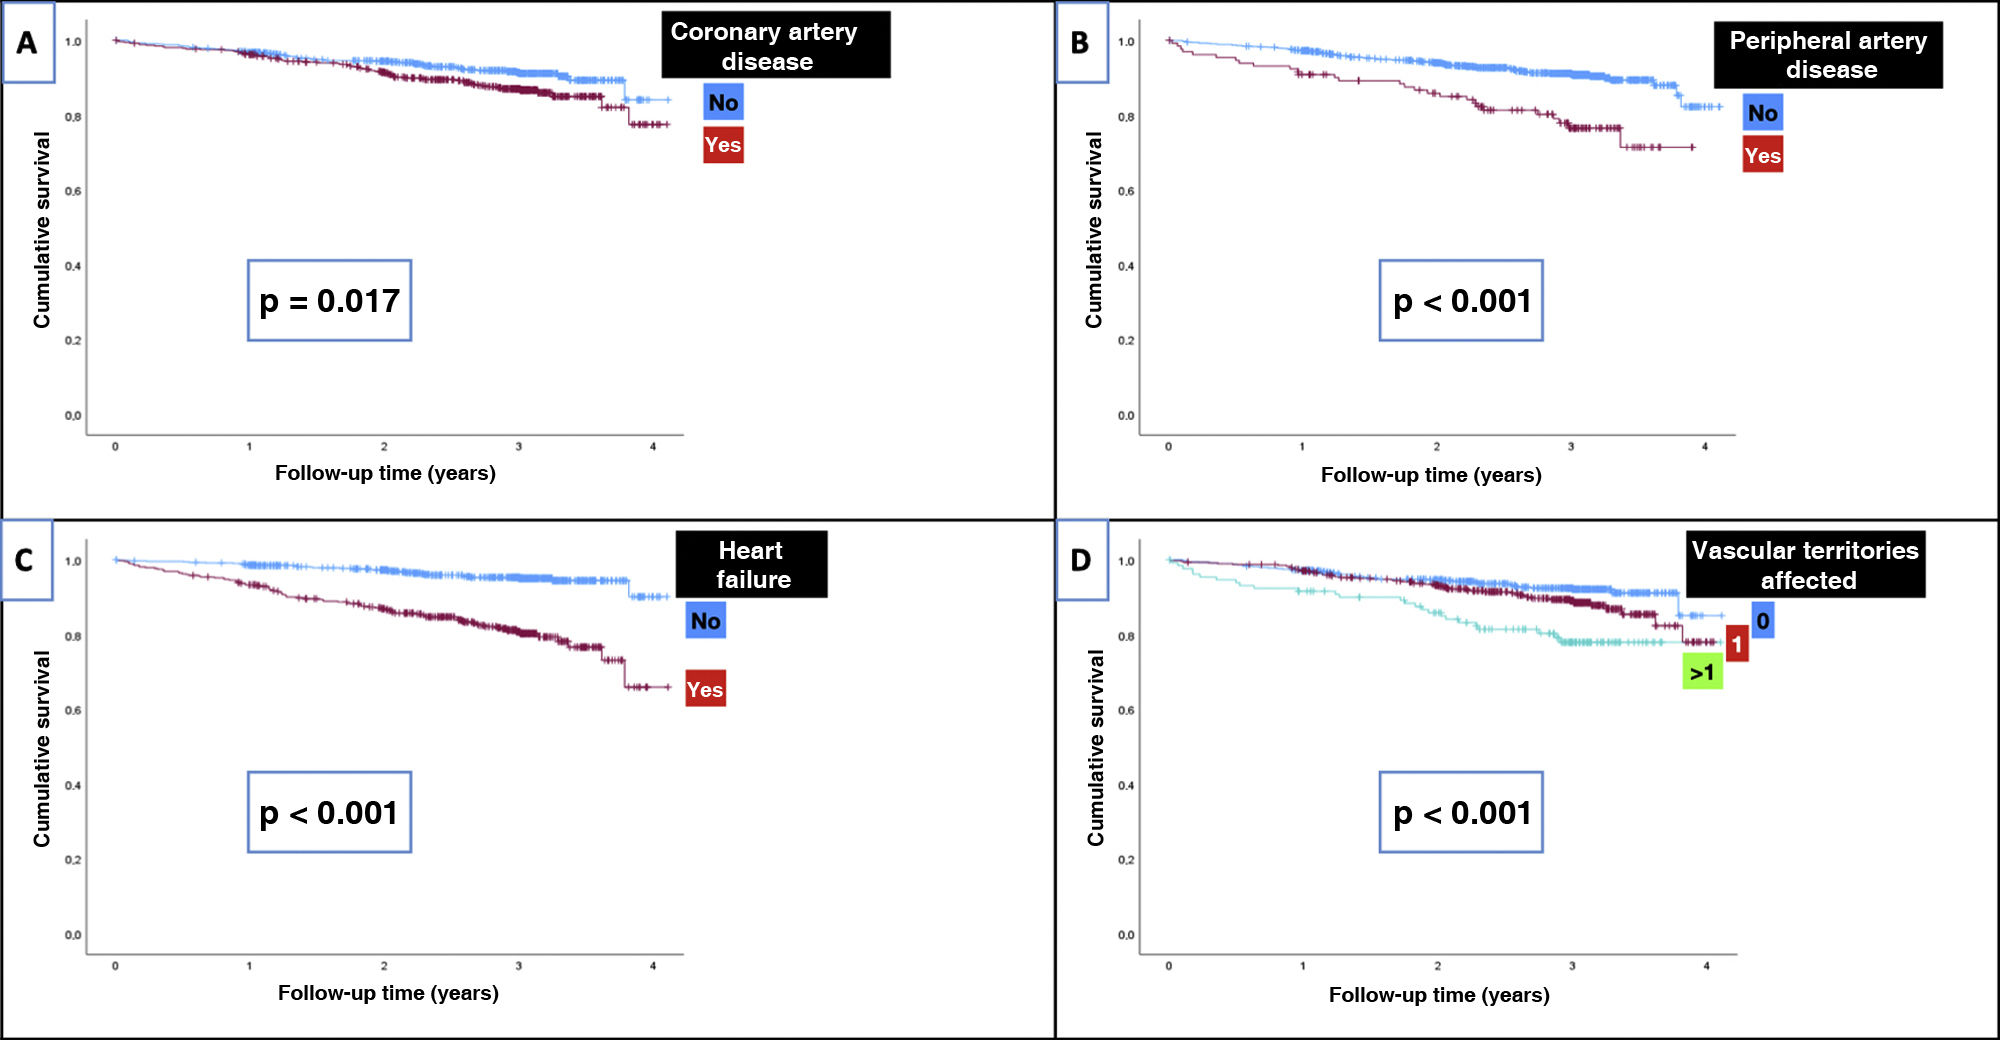
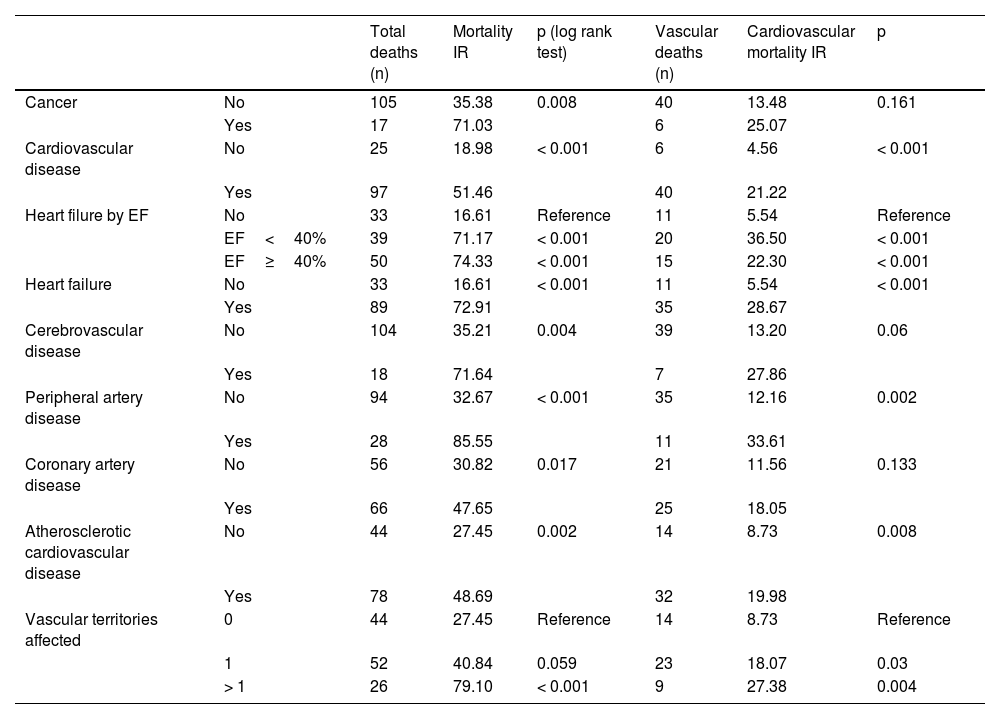
Table 5 shows the IRs of overall and cardiovascular mortality depending on the type of initial CVD, while Fig. 1 shows the survival curves. For comparison purposes, the IR of mortality in patients diagnosed with cancer is also included. Patients without CVD had a mortality IR of 19/1000 and and a CVM IR of 4.5/1000. As expected, any signs of CVD increased the rates of overall mortality and CVM. Specifically, the highest IRs of overall and CVM were reported in patients with PAD (85.6/1000 and 33.6/1000 patient-years, respectively), in those with > 1 vascular territory affected (79.1/1000 and 27.4/1000, respectively), and in those diagnosed with heart failure (72.9/1000 and 28.7/1000, respectively). Notably, the highest IR of CVM was observed in patients with HFrEF (36.5/1000). The IRs were lower in subjects with CAD (47.6/1000 and 18.1/1000 for overall mortality and CVM, respectively).
Incidence rates (IR) per 1000 patient-years for the overall and cardiovascular mortality.
| Total deaths (n) | Mortality IR | p (log rank test) | Vascular deaths (n) | Cardiovascular mortality IR | p | ||
|---|---|---|---|---|---|---|---|
| Cancer | No | 105 | 35.38 | 0.008 | 40 | 13.48 | 0.161 |
| Yes | 17 | 71.03 | 6 | 25.07 | |||
| Cardiovascular disease | No | 25 | 18.98 | < 0.001 | 6 | 4.56 | < 0.001 |
| Yes | 97 | 51.46 | 40 | 21.22 | |||
| Heart filure by EF | No | 33 | 16.61 | Reference | 11 | 5.54 | Reference |
| EF<40% | 39 | 71.17 | < 0.001 | 20 | 36.50 | < 0.001 | |
| EF≥40% | 50 | 74.33 | < 0.001 | 15 | 22.30 | < 0.001 | |
| Heart failure | No | 33 | 16.61 | < 0.001 | 11 | 5.54 | < 0.001 |
| Yes | 89 | 72.91 | 35 | 28.67 | |||
| Cerebrovascular disease | No | 104 | 35.21 | 0.004 | 39 | 13.20 | 0.06 |
| Yes | 18 | 71.64 | 7 | 27.86 | |||
| Peripheral artery disease | No | 94 | 32.67 | < 0.001 | 35 | 12.16 | 0.002 |
| Yes | 28 | 85.55 | 11 | 33.61 | |||
| Coronary artery disease | No | 56 | 30.82 | 0.017 | 21 | 11.56 | 0.133 |
| Yes | 66 | 47.65 | 25 | 18.05 | |||
| Atherosclerotic cardiovascular disease | No | 44 | 27.45 | 0.002 | 14 | 8.73 | 0.008 |
| Yes | 78 | 48.69 | 32 | 19.98 | |||
| Vascular territories affected | 0 | 44 | 27.45 | Reference | 14 | 8.73 | Reference |
| 1 | 52 | 40.84 | 0.059 | 23 | 18.07 | 0.03 | |
| > 1 | 26 | 79.10 | < 0.001 | 9 | 27.38 | 0.004 |

On the univariate analysis, the cardiovascular diseases that most increased the risk of mortality (Table 3) were heart failure (HR, 4.4; p<0.001) and PAD (HR, 2.6; p<0.001). Of note that patients on i-SGLT2 (HR, 0.47; p<0.001) or GLP1-RA (HR, 0.18; p<0.001) had a lower risk of mortality. Regarding CVM, the risk increased significantly with the presence of heart failure (HR, 5.3; p<0.001) and PAD (HR, 2.8; p=0.003), while it was lower in those on i-SGLT2 (HR, 0.28; p=0.002) or GLP1-RA (HR, 0.24; p=0.046).
On the multivariate analysis of the final model chosen for the overall mortality, with the simultaneous inclusion of all affected vascular territories and adjusted for other variables associated with mortality, the only CVD sign that remained statistically significant was heart failure (HR, 1.63; 95% CI, 1.03–2.58; p=0.037). Other factors that increased mortality risk were age (HR₁year: 1.07; 95% CI, 1.04–1.10; p<0.001) and the Charlson index (HR₁point: 1.77; 95% CI, 1.46–2.16); conversely, factors associated with lower risk were eGFR (HR₁mL/min: 0.990; 95% CI, 0.980–0.999; p=0.003), a cancer diagnosis (HR, 0.52; 95% CI, 0.28–0.98; p=0.042), and being on GLP1-RA (HR, 0.29; 95% CI, 0.10–0.78; p=0.014).
In the multivariate analysis of the final model chosen for CVM, with the simultaneous inclusion of all affected vascular territories and adjusted for other variables associated with CVM, the only CVD sign that remained statistically significant was also heart failure (HR, 3.41; 95% CI, 1.68–6.93; p=0.001). Another factor that increased the risk of CVM was age (HR₁year: 1.04; 95% CI, 1.00–1.08; p=0.033); conversely, protective factors were eGFR (HR₁ml/min: 0.98; 95% CI, 0.96–0.99; p=0.008), and at the limit of statistical significance, female gender (HR, 0.50; 95% CI, 0.25–1.01; p=0.053) and being oni-SGLT2 (HR, 0.44; 95% CI, 0.19–1.01; p=0.052).
DiscussionIn our study, through the prospective follow-up of a cohort of T2DM patients recruited in the hospital setting over 2.6 years, and with a high prevalence of CVD, we found that the IRs of overalll mortality and CVM vary depending on the type of initial CVD. The highest IRs and the greatest risk increase were reported in patients with heart failure, PAD, and atherosclerotic involvement of > 1 vascular territory. In the adjusted analysis for potential confounding factors, the only CVD that increased risk significantly was heart failure. Of note that all mortality IRs, except for those associated with CAD, were higher compared with having a cancer diagnosis.
The risk of overall mortality, and specifically CVM, is variable in patients with DM, which is clinical practice guidelines15,16 recommend careful vascular risk stratification for each patient to determine the type of treatment and the intensity of therapeutic goals. There is limited data in literature comparing the mortality risk of different CVD signs. In a retrospective study based on primary care databases in the UK,17 the risk of CVM was higher in patients with multiple cardiovascular comorbidities. In a recent Danish population study,18 with over 150,000 T2DM patients analyzed in a 10-years follow-up, the highest mortality risk was associated with heart failure development (RR, 3), an intermediate risk was associated with PAD and CeVD (RR, 2.3 and 2.2, respectively), and a lower risk was reported with CAD (RR, 1.3); however, they did not provide any other information on other risk factors or microvascular involvement. These data are entirely comparable to those found in our study in the univariate mortality analysis.
The recognition of heart failure as a DM-related complication, due to the detrimental effect of hyperglycemia and insulin resistance, has increased in recent years and been the subject of reviews11 and consensus documents.19 T2DM can promote the development of both HFpEF (more common in the early stages of the disease) and HFrEF (more common in patients with CAD).11 Mortality risk seems to be higher in patients with HFrEF,20 which is proportional to the degree of LVEF reduction. In our study, we found that while the IRs of overall mortality were similar, the IRs of CVM were higher in patients with heart failure if LVEF was <40%.
The presence of PAD significantly increases the likelihood of other ASCVD signs and heart failure, making it a marker of polyvascular disease.21 A large epidemiological study confirmed the association of PAD with other forms of ASCVD and heart failure, as well as a significant increase in CVM risk (HR, 1.86).22 Our work confirmed that patients with PAD had a high prevalence of other ASCVD signs and heart failure, justifying the highest IRs of overall mortality and one of the highest IRs of CVM, only surpassed by patients with HFrEF.
The higher risk conferred by the presence of heart failure and PAD is associated with the fact that these may currently be the most frequent initial CVD entities, in addition to PAD being the atherosclerotic disease most closely associated with DM.23 In fact, in recent decades, the form of ASCVD that has experienced the greatest reduction in IRs has been CAD; this reduction has also been accompanied by a decrease in the absolute number of cases, which has not been achieved for PAD or CeVD.24 Therefore, recent clinical practice guidelines recommend having a high index of suspicion when screening for heart failure16,25 and PAD.16
The latest epidemiological data from Spain26 confirm a favorable trend in reducing mortality in T2DM patients. The overall trend towards a reduction in CVM rates may be due to better preventive and therapeutic strategies.8,27 The demonstration of the specific benefit of i-SGLT2 and GLP1-RA9 makes them unanimously recommended in the presence of CVD in T2DM patients.15,16 In our study, although not specifically designed for this, we saw an improvement in the prognosis of patients treated in these therapeutic groups. Moreover, we saw room for improvement, as only 39% of patients with CVD were on i-SGLT2 and 12% on GLP1-RA. These results may serve to promote the use of cardioprotective drugs, aiming to ensure that no patient who could benefit from them is deprived of their prescription.28 Additionally, the added benefit of the simultaneous use of several therapeutic groups should be considered.29 Furthermore, we also found in our work that lipid-lowering treatment needs to be intensified to reach the goals set by the clinical guidelines.15
The present study has the advantage of including a sample of T2DM patients with a high prevalence of CVD, recruited in hospitals representative of the entire national territory. Epidemiological, clinical, and analytical data were available. Additionally, patients had been jointly evaluated in cardiology and endocrinology clinics, so echocardiographic data were available for almost 90% of the cohort. Therefore, the IRs described in various situations can be considered accurate.
However, there are important limitations that should be taken into consideration. Firstly, the sample and follow-up were smaller than initially projected due to restrictions imposed by the COVID-19 pandemic; therefore, the statistical power may be limited for performing multivariable regression models and subgroup analyses, which means that results should be interpreted with caution. For example, the increased mortality risk conferred by cancer in the univariate analysis was reversed in the multivariate analysis, which could be justified by the simultaneous inclusion of the Charlson index and the competitive risk of CVM. Secondly, patients were recruited at a hospital setting, so the CVD prevalences are not representative of the entire T2DM patient population. Finally, treatment was prescribed at the responsible physician’s discretion, so efficacy data regarding mortality risk reduction for some drugs may be partially biased (indication bias) and should be considered as hypothesis-generating rather than definitive.
In conclusion, the residual risk of overall mortality and CVM in T2DM patients with CVD can be very high. This is especially evident in subjects with heart failure, PAD, and atherosclerotic involvement of multiple vascular territories. The presence of heart failure independently triples the risk of CVM, while the increased risk associated with PAD can be explained by its frequent association with heart failure and polyvascular involvement. Therefore, we believe it is necessary to detect these conditions in T2DM patients to optimize vascular risk factor management and increase the use of glucose-lowering drugs with the potential to improve disease prognosis.
FundingThis work was funded by a grant awarded to the Spanish Society of Diabeetes and the Spanish Society of Cardiology by Boehringer Ingelheim.
Conflicts of interestNone declared.
The following is Supplementary data to this article:
