


Antimicrobial stewardship programs (ASPs) monitor antimicrobial consumption and implement interventions in order to improve their use. Here, we analyze the trends in antimicrobial consumption at hospitals participating in the VINCat Program over a 15-year period in Catalonia, Spain.
MethodsWe conducted a time-series analysis of systemic antimicrobial consumption in both adult and pediatric populations across 72 acute care centers. The annual measurement of systemic antibiotic and antifungal use was conducted using defined daily dose (DDD) in adults and days of therapy (DOT) in children. To analyze trends in antimicrobial use, we considered the annual consumption defined in DDD or DOT per 100 patient-days.
ResultsOverall adult consumption (2008–2022) of antimicrobials, antibiotics, and antifungals averaged 73.54, 70.08, and 3.46 DDD/100 patient-days respectively. There was a significant increase in overall antimicrobial (rho=0.554; p=0.035) and also in antifungal (rho=0.657; p=0.01) consumption during the study period. Antibiotic consumption showed an upward trend in the first period followed by an unchanged consumption in the following years (rho=0.482; p=0.071). Penicillins were the most frequently used (33.5%), followed by cephalosporins (18.2%), quinolones (13.9%), and other systemic antibacterials (10.8%) and antifungals (4.7%). Pediatric consumption was analyzed between 2020 and 2022. Overall, antimicrobial, antibiotic, and antifungal use in this population averaged 60.04, 53.47, and 6.57DOT/100 patient-days respectively. As in adults, in children penicillins were the most used family (34.3%); within this group, penicillin combinations with beta-lactamase inhibitors (21.1%) were the most used, followed by cephalosporins (19.3%).
ConclusionsParticipation on the VINCat Program was high at both adult and pediatric hospitals. Fifteen-year trends showed a significant increase in overall antimicrobial consumption in adults.
Los programas de optimización de uso de antimicrobianos (PROA) monitorizan el consumo e implementan intervenciones para mejorar su uso. Aquí, analizamos las tendencias en el consumo de antimicrobianos en los hospitales participantes en el Programa VINCat durante un periodo de 15 años en Cataluña, España.
MétodosAnálisis de series temporales del consumo de antimicrobianos sistémicos en población adulta y pediátrica en 72 centros de agudos. Se usó la metodología de dosis diaria definida (DDD) en adultos y los días de terapia (DOT) en niños. El cálculo de las tendencias de consumo anual se expresó en DDD o DOT por 100 estancias.
ResultadosEl consumo general en adultos (2008-2022) de antimicrobianos, antibióticos y antifúngicos fue de una media de 73,54, 70,08 y 3,46 DDD/100 estancias, respectivamente. Se observó un incremento significativo en el uso de antimicrobianos (rho=0,554; p=0,035) y antifúngicos (rho=0,657; p=0,01) durante todo el estudio. El consumo de antibióticos aumentó en el primer período, seguido de un consumo constante en los siguientes años (rho=0,482; p=0,071). Las penicilinas fueron las más utilizadas (33,5%), seguidas por las cefalosporinas (18,2%), las quinolonas (13,9%), otros antibacterianos (10,8%) y antifúngicos (4,7%). El consumo pediátrico se analizó entre 2020 y 2022. El uso de antimicrobianos, antibióticos y antifúngicos en esta población fue de 60,04, 53,47 y 6,57 DOT/100 estancias, respectivamente. Las penicilinas fueron la familia más utilizada (34,3%); especialmente, las combinaciones de penicilinas con inhibidores de betalactamasas (21,1%), seguidas de las cefalosporinas (19,3%).
ConclusionesLa participación en el Programa VINCat fue elevada en los hospitales de adultos y pediátricos. Las tendencias de quince años mostraron un aumento significativo del consumo global de antimicrobianos en adultos.
Antimicrobial resistance has been defined by the World Health Organization (WHO) as a global crisis. In 2019, 1.27 million deaths were attributed directly to multidrug-resistant bacteria worldwide.1,2 Addressing the emergence of life-threatening multidrug-resistant bacteria requires prioritizing infection prevention and optimizing antimicrobial use through antimicrobial stewardship programs (ASPs).3,4 Identifying antimicrobial consumption and providing feedback to prescribing teams is essential for implementing effective ASP strategies. Furthermore, surveillance of antimicrobial consumption, both in hospitals and in the community, is a key issue for healthcare systems across European Union member states and associated countries in their attempts to meet the EU's target of reducing antimicrobial consumption by 20% by 2030.5
In 2007, the Catalan Healthcare Service launched the VINCat Program in Catalonia, a region of Spain with a population of eight million. The VINCat Program aims to prevent healthcare-associated infections (HAIs) and to enhance antimicrobial utilization. The structure of the program has been previously detailed elsewhere6 and encompasses various surveillance indicators focused on HAI prevention. The program has systematically monitored adult antimicrobial consumption in healthcare settings since 2008, extending to pediatric antimicrobial consumption in healthcare settings and adult and pediatric primary care settings in 2020 and, finally, to long-term care facilities in 2022. Comparative annual data between centers is provided to each center as benchmarking of antimicrobial consumption among similar care settings has been considered an effective strategy for improving antibiotic prescribing practices and for curbing the emergence of multidrug-resistant microorganisms.
In 2008, the VINCat ASP monitored hospital consumption in the adult population. By 2022, the VINCat ASP had expanded to a team network of more than 500 multidisciplinary professionals involving infectious diseases specialists, pharmacists, microbiologists, nurses, pediatricians, surgeons, and intensivists from 72 hospitals (59 public and 13 private) (supplementary Fig. S1). The ASP currently includes indicators and interventions specific to the adult and pediatric hospital setting7,8 and receives financial from the Catalan HealthCare Department.
In 2012, data on antibiotic consumption in the adult population from 46 hospitals on the VINCat Program were published.9 The main findings indicated a 4.49% increase in overall antimicrobial consumption between 2007 and 2009, particularly in carbapenems, cephalosporins, and monobactams. The present report aims to explore trends in antimicrobial use in adult hospitals in Catalonia over a 15-year period and hospital pediatric antimicrobial use during 2020–2022.
MethodsStudy settingWe conducted a time-series analysis of systemic antimicrobial consumption in both adult and pediatric populations across 72 acute care centers affiliated with the VINCat Program. In 2008 participation in antimicrobial consumption surveillance was voluntary for all adult hospital centers but it became mandatory in 2011. Participating hospitals include both public and private institutions. In 2020, the surveillance of antibiotic consumption at pediatric centers was introduced.
The VINCat Program categorizes adult acute care hospitals into four groups based on hospital complexity and bed count: Group I (>500 beds), Group II (200 to <500 beds), Group III (<200 beds), and Group IV (onco-hematology hospitals). Hospital services are classified according to their activity as intensive care units (ICU), medical and surgical services. Pediatric hospitals are classified into four levels based on complexity: Level I (general pediatric ward with or without surgery and emergency services), Level II (general pediatric ward, emergency services, non-urgent pediatric surgery, and Neonatal Intensive Care Unit [NICU]), Level IIIa (specialized pediatric ward, pediatric surgery, NICU, and Pediatric Intensive Care Unit [PICU]), and Level IIIb (specialized pediatric ward, pediatric surgery, NICU, PICU, and pediatric oncology-hematology and transplant services).
Antimicrobial use measurementThe annual measurement of systemic antibiotic and antifungal use at adult acute care hospitals was conducted using the defined daily dose (DDD) calculation method defined by the WHO.9,10 The Pharmacy Departments at the participating hospitals reported the antimicrobial units dispensed to hospitalized patients aged ≥18 years. DDDs were calculated using updated 2022 WHO values and analyzed both overall and for medical, surgical, and ICU services.
Due to limitations in the use of DDDs for pediatric populations, the days of therapy (DOT) indicator was adopted to systemically measure antimicrobial use at pediatric acute care hospitals. This methodology has been described elsewhere.11 Pharmacy services reported the annual number of DOTs for each antimicrobial for hospitalized patients <18 years, overall and according to medical, surgical, NICU, and PICU services.
Inclusion–exclusion criteria was detailed in the VINCat Program manual.12 Data were collected and standardized per 100 patient-days (PD). All hospital teams underwent appropriate training before and during the surveillance study, ensuring uniform data collection according to pre-established criteria. All data shown has been anonymized.
Both DDDs and DOTs were analyzed overall, and by service, antimicrobial family and individual antimicrobial. Additionally, the 2021 update of the AWaRe classification of antibiotics developed by the WHO Expert Committee of Selection and Use of Essential Medicines was applied.13 This classification categorizes antibiotics into Access, Watch, and Reserve groups, considering their impact on antimicrobial resistance.
Statistical analysisTo analyze trends in antimicrobial consumption we considered the annual consumption defined in DDD per 100PD. Additionally, we defined three periods (2008–2012, 2013–2017 and 2018–2022) to better display the data in the tables. To assess the strength and direction of the monotonic relationship in antimicrobial consumption over the 15 years, we conducted a Spearman correlation (rho). A significance level of 0.05 was applied to all statistical tests. Additionally, we applied LOESS smoothing to the graphs to provide a clearer depiction of data trends. The results were analyzed using the statistical software R v4.2.2, developed by The R Foundation in Vienna, Austria.
ResultsHospital antimicrobial consumption in adults, 2008–2022Hospital participationSurveillance of hospital antimicrobial consumption started in 2008 at 45 centers, 8 from Group I, 13 from Group II and 25 from Group III. Participation has risen steadily, with 66 centers contributing data in 2022: 9 from Group I, 16 from Group II, 38 from Group III, and 3 from Group IV.
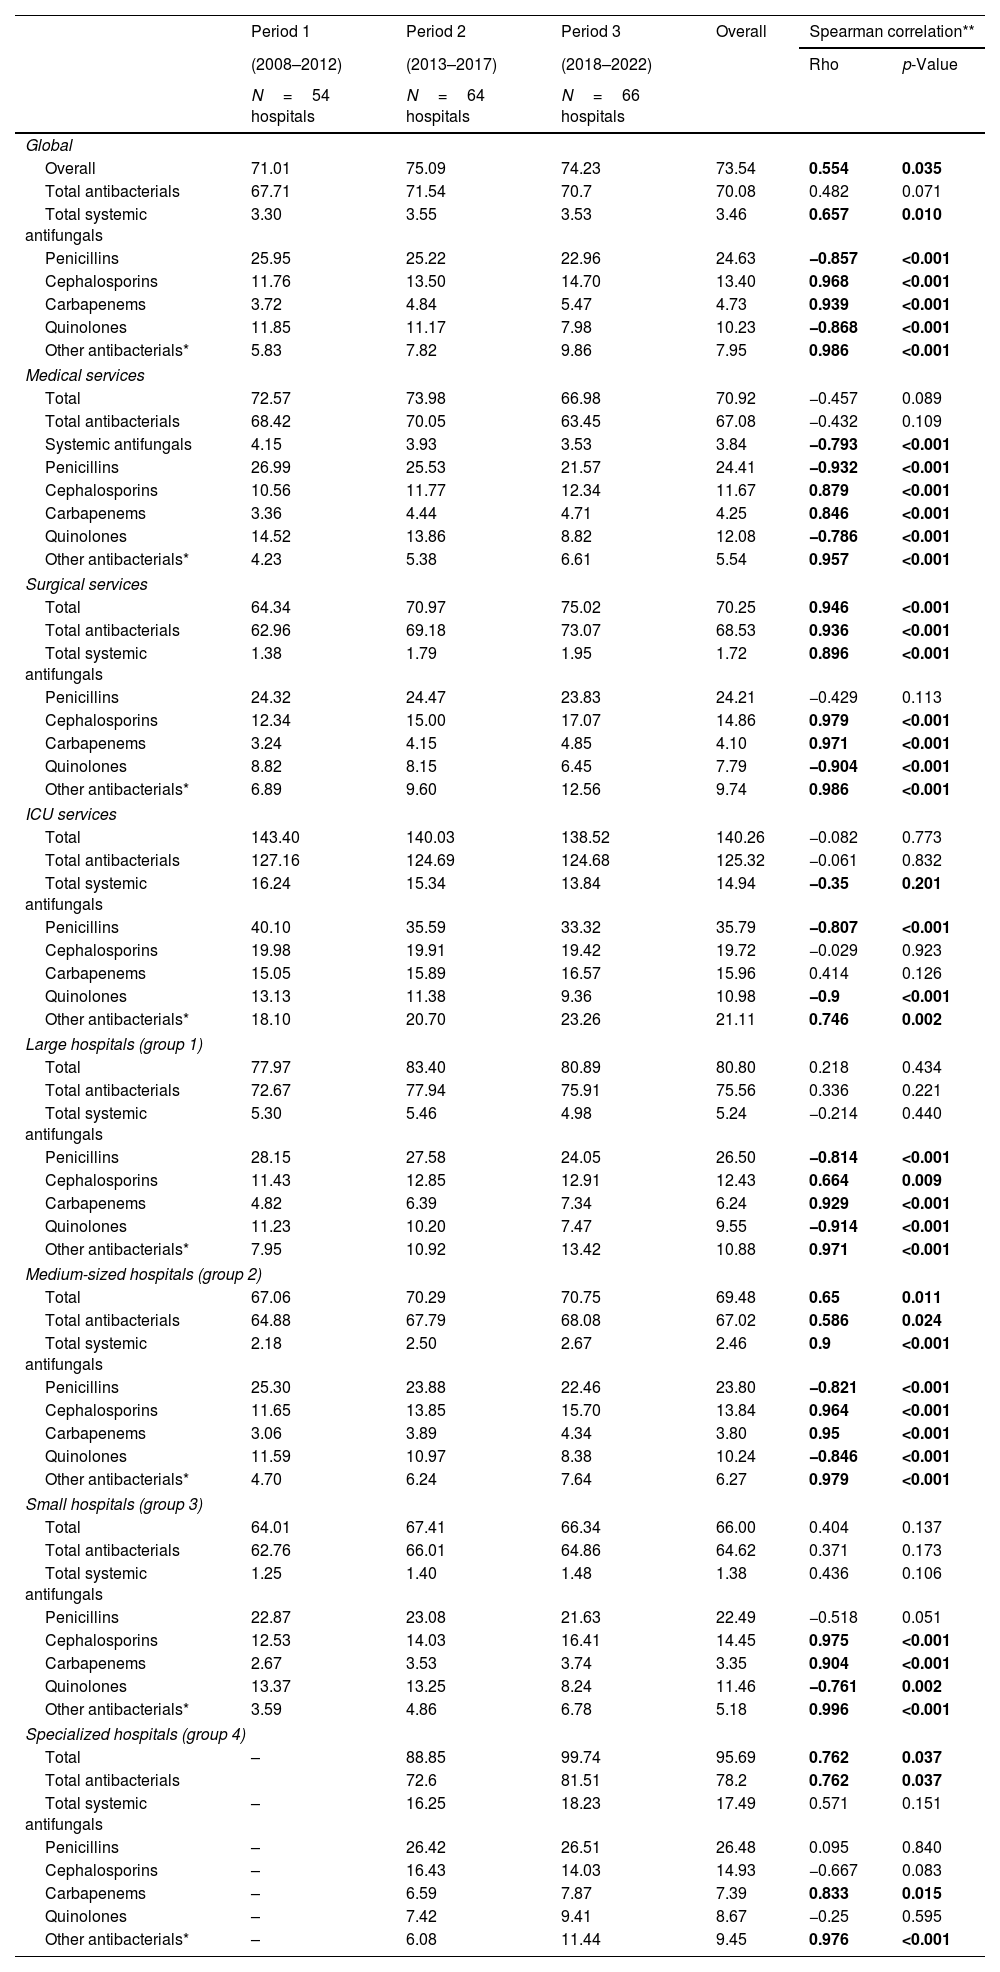
Antimicrobial consumption in hospitalized adult patientsFrom 2008 to 2022, the overall consumption of antimicrobials, antibiotics, and antifungals averaged 73.54 DDD/100PD, 70.08 DDD/100PD, and 3.46 DDD/100PD respectively (Table 1). The highest consumption was identified in ICUs and in onco-hematology hospitals. Table 1, Fig. 1 and supplementary Fig. S2 illustrate trends in overall antimicrobial consumption and specific antimicrobial families according to service and hospital group across the three established periods. Data on antimicrobial consumption according to subfamily and main antimicrobial are shown in supplementary Tables S1 and S2.
Trends in hospital antimicrobial consumption in adult patients by periods (DDD per 100 patient-days).
| Period 1 | Period 2 | Period 3 | Overall | Spearman correlation** | ||
|---|---|---|---|---|---|---|
| (2008–2012) | (2013–2017) | (2018–2022) | Rho | p-Value | ||
| N=54 hospitals | N=64 hospitals | N=66 hospitals | ||||
| Global | ||||||
| Overall | 71.01 | 75.09 | 74.23 | 73.54 | 0.554 | 0.035 |
| Total antibacterials | 67.71 | 71.54 | 70.7 | 70.08 | 0.482 | 0.071 |
| Total systemic antifungals | 3.30 | 3.55 | 3.53 | 3.46 | 0.657 | 0.010 |
| Penicillins | 25.95 | 25.22 | 22.96 | 24.63 | −0.857 | <0.001 |
| Cephalosporins | 11.76 | 13.50 | 14.70 | 13.40 | 0.968 | <0.001 |
| Carbapenems | 3.72 | 4.84 | 5.47 | 4.73 | 0.939 | <0.001 |
| Quinolones | 11.85 | 11.17 | 7.98 | 10.23 | −0.868 | <0.001 |
| Other antibacterials* | 5.83 | 7.82 | 9.86 | 7.95 | 0.986 | <0.001 |
| Medical services | ||||||
| Total | 72.57 | 73.98 | 66.98 | 70.92 | −0.457 | 0.089 |
| Total antibacterials | 68.42 | 70.05 | 63.45 | 67.08 | −0.432 | 0.109 |
| Systemic antifungals | 4.15 | 3.93 | 3.53 | 3.84 | −0.793 | <0.001 |
| Penicillins | 26.99 | 25.53 | 21.57 | 24.41 | −0.932 | <0.001 |
| Cephalosporins | 10.56 | 11.77 | 12.34 | 11.67 | 0.879 | <0.001 |
| Carbapenems | 3.36 | 4.44 | 4.71 | 4.25 | 0.846 | <0.001 |
| Quinolones | 14.52 | 13.86 | 8.82 | 12.08 | −0.786 | <0.001 |
| Other antibacterials* | 4.23 | 5.38 | 6.61 | 5.54 | 0.957 | <0.001 |
| Surgical services | ||||||
| Total | 64.34 | 70.97 | 75.02 | 70.25 | 0.946 | <0.001 |
| Total antibacterials | 62.96 | 69.18 | 73.07 | 68.53 | 0.936 | <0.001 |
| Total systemic antifungals | 1.38 | 1.79 | 1.95 | 1.72 | 0.896 | <0.001 |
| Penicillins | 24.32 | 24.47 | 23.83 | 24.21 | −0.429 | 0.113 |
| Cephalosporins | 12.34 | 15.00 | 17.07 | 14.86 | 0.979 | <0.001 |
| Carbapenems | 3.24 | 4.15 | 4.85 | 4.10 | 0.971 | <0.001 |
| Quinolones | 8.82 | 8.15 | 6.45 | 7.79 | −0.904 | <0.001 |
| Other antibacterials* | 6.89 | 9.60 | 12.56 | 9.74 | 0.986 | <0.001 |
| ICU services | ||||||
| Total | 143.40 | 140.03 | 138.52 | 140.26 | −0.082 | 0.773 |
| Total antibacterials | 127.16 | 124.69 | 124.68 | 125.32 | −0.061 | 0.832 |
| Total systemic antifungals | 16.24 | 15.34 | 13.84 | 14.94 | −0.35 | 0.201 |
| Penicillins | 40.10 | 35.59 | 33.32 | 35.79 | −0.807 | <0.001 |
| Cephalosporins | 19.98 | 19.91 | 19.42 | 19.72 | −0.029 | 0.923 |
| Carbapenems | 15.05 | 15.89 | 16.57 | 15.96 | 0.414 | 0.126 |
| Quinolones | 13.13 | 11.38 | 9.36 | 10.98 | −0.9 | <0.001 |
| Other antibacterials* | 18.10 | 20.70 | 23.26 | 21.11 | 0.746 | 0.002 |
| Large hospitals (group 1) | ||||||
| Total | 77.97 | 83.40 | 80.89 | 80.80 | 0.218 | 0.434 |
| Total antibacterials | 72.67 | 77.94 | 75.91 | 75.56 | 0.336 | 0.221 |
| Total systemic antifungals | 5.30 | 5.46 | 4.98 | 5.24 | −0.214 | 0.440 |
| Penicillins | 28.15 | 27.58 | 24.05 | 26.50 | −0.814 | <0.001 |
| Cephalosporins | 11.43 | 12.85 | 12.91 | 12.43 | 0.664 | 0.009 |
| Carbapenems | 4.82 | 6.39 | 7.34 | 6.24 | 0.929 | <0.001 |
| Quinolones | 11.23 | 10.20 | 7.47 | 9.55 | −0.914 | <0.001 |
| Other antibacterials* | 7.95 | 10.92 | 13.42 | 10.88 | 0.971 | <0.001 |
| Medium-sized hospitals (group 2) | ||||||
| Total | 67.06 | 70.29 | 70.75 | 69.48 | 0.65 | 0.011 |
| Total antibacterials | 64.88 | 67.79 | 68.08 | 67.02 | 0.586 | 0.024 |
| Total systemic antifungals | 2.18 | 2.50 | 2.67 | 2.46 | 0.9 | <0.001 |
| Penicillins | 25.30 | 23.88 | 22.46 | 23.80 | −0.821 | <0.001 |
| Cephalosporins | 11.65 | 13.85 | 15.70 | 13.84 | 0.964 | <0.001 |
| Carbapenems | 3.06 | 3.89 | 4.34 | 3.80 | 0.95 | <0.001 |
| Quinolones | 11.59 | 10.97 | 8.38 | 10.24 | −0.846 | <0.001 |
| Other antibacterials* | 4.70 | 6.24 | 7.64 | 6.27 | 0.979 | <0.001 |
| Small hospitals (group 3) | ||||||
| Total | 64.01 | 67.41 | 66.34 | 66.00 | 0.404 | 0.137 |
| Total antibacterials | 62.76 | 66.01 | 64.86 | 64.62 | 0.371 | 0.173 |
| Total systemic antifungals | 1.25 | 1.40 | 1.48 | 1.38 | 0.436 | 0.106 |
| Penicillins | 22.87 | 23.08 | 21.63 | 22.49 | −0.518 | 0.051 |
| Cephalosporins | 12.53 | 14.03 | 16.41 | 14.45 | 0.975 | <0.001 |
| Carbapenems | 2.67 | 3.53 | 3.74 | 3.35 | 0.904 | <0.001 |
| Quinolones | 13.37 | 13.25 | 8.24 | 11.46 | −0.761 | 0.002 |
| Other antibacterials* | 3.59 | 4.86 | 6.78 | 5.18 | 0.996 | <0.001 |
| Specialized hospitals (group 4) | ||||||
| Total | – | 88.85 | 99.74 | 95.69 | 0.762 | 0.037 |
| Total antibacterials | 72.6 | 81.51 | 78.2 | 0.762 | 0.037 | |
| Total systemic antifungals | – | 16.25 | 18.23 | 17.49 | 0.571 | 0.151 |
| Penicillins | – | 26.42 | 26.51 | 26.48 | 0.095 | 0.840 |
| Cephalosporins | – | 16.43 | 14.03 | 14.93 | −0.667 | 0.083 |
| Carbapenems | – | 6.59 | 7.87 | 7.39 | 0.833 | 0.015 |
| Quinolones | – | 7.42 | 9.41 | 8.67 | −0.25 | 0.595 |
| Other antibacterials* | – | 6.08 | 11.44 | 9.45 | 0.976 | <0.001 |
 of systemic antimicrobials at adult hospitals, 2008–2022.")
There was a significant overall increase in antimicrobial consumption between 2008 and 2022 (rho=0.554; p=0.035) (Fig. 1). Consumption rose by 9.4% between 2008 and 2022. That was mainly caused by an upward trend in antifungal use during the whole period (rho=0.657; p=0.01). In contrast, we observed an increasing trend in antibiotic consumption in the first period followed by a maintained consumption in the second and third periods; therefore, global antibiotic use was not statistically significant (rho=0.482; p=0.071).
According to antibiotic class, penicillins were the most used (33.5%) over the study period, followed by cephalosporins (18.2%), quinolones (13.9%), and other systemic antibacterials (10.8%) and antifungals (4.7%). However, penicillin use presented significant reductions over the period: (−0.857; p<0.001) overall, (−0.932; p<0.001) at medical services, (−0.807; p<0.001) in the ICU, (−0.814; p<0.001) in Group I and (−0.821; p<0.001) in Group II centers (Table 1). Amoxicillin/clavulanic acid was the most consumed antibiotic both overall and at all services, while piperacillin/tazobactam consumption increased both overall and in medical and surgical services (supplementary Table S2).
Cephalosporins rose from third place in the 2008–2012 period to second in the 2018–2022 period, with an overall increase of 37.9%. Their highest consumption was recorded in ICU services and Group IV hospitals. Third-generation cephalosporins, especially ceftriaxone, were the most used overall (7.49 DDD/100PD), at medical services (8.72 DDD/100PD), in the ICU (13.69 DDD/100PD) (supplementary Table S1). In surgical services, first-generation cephalosporins (cefazolin) were the most used (6.33 DDD/100PD) (supplementary Table S2).
Quinolones fell from second to third place among the most used antibiotic families, with a significant overall reduction (rho=−0.868; p<0.001). This reduction was observed for both levofloxacin and ciprofloxacin (supplementary Table S2). The decreasing trend was statistically significant across all services and hospital groups with the exception of Group IV.
Carbapenems experienced the greatest increase across all settings, recording a rise of 131.6% and presenting a statistically significant upward trend in all types of hospital. Carbapenems accounted for 6.4% of overall consumption, with the highest rates observed in Group I and IV hospitals and ICU services, with 11.4% of antimicrobial consumption (Table 1).
The consumption of antibiotics classified as “other antibacterials” represented 10.8% of the total, with significant increases both overall and in all settings. Daptomycin (rho=1; p<0.001), teicoplanin (rho=0.978; p<0.001), and linezolid (rho=0.975; p<0.001) recorded the largest increases. Their highest rates of consumption were observed in Group I hospitals and ICU services, where they represented the third and second most used group respectively (Table 1).
The highest consumption of antifungals was observed in ICUs and in Group IV hospitals. Antifungals presented significant increases in overall consumption, and in surgical services and Group II hospitals. Group I hospitals showed a non-significant decrease in antifungal consumption (Table 1).
Regarding the WHO's AWaRe classification, the “Watch” category was the most frequently prescribed, with an average use of 35.68 DDD/100PD, followed by “Access” (31.28 DDD/100PD) and “Reserve” (3.33 DDD/100PD, Fig. 2). Both “Watch” and “Reserve” antibiotics presented significant increases, while the use of “Access” antibiotics fell over time.
Pediatric hospital antimicrobial consumption 2020–2022Participation of systemic antibiotics at adult hospitals according to AWARE classification, 2008–2022.")
The surveillance of pediatric hospital consumption of systemic antimicrobials began in 2020 and incorporated 17 centers (two Level IIIb, six Level II, and nine Level I). In 2022, the number had risen to 33 centers (two Level IIIb, five Level IIIa, ten Level II, sixteen Level I).
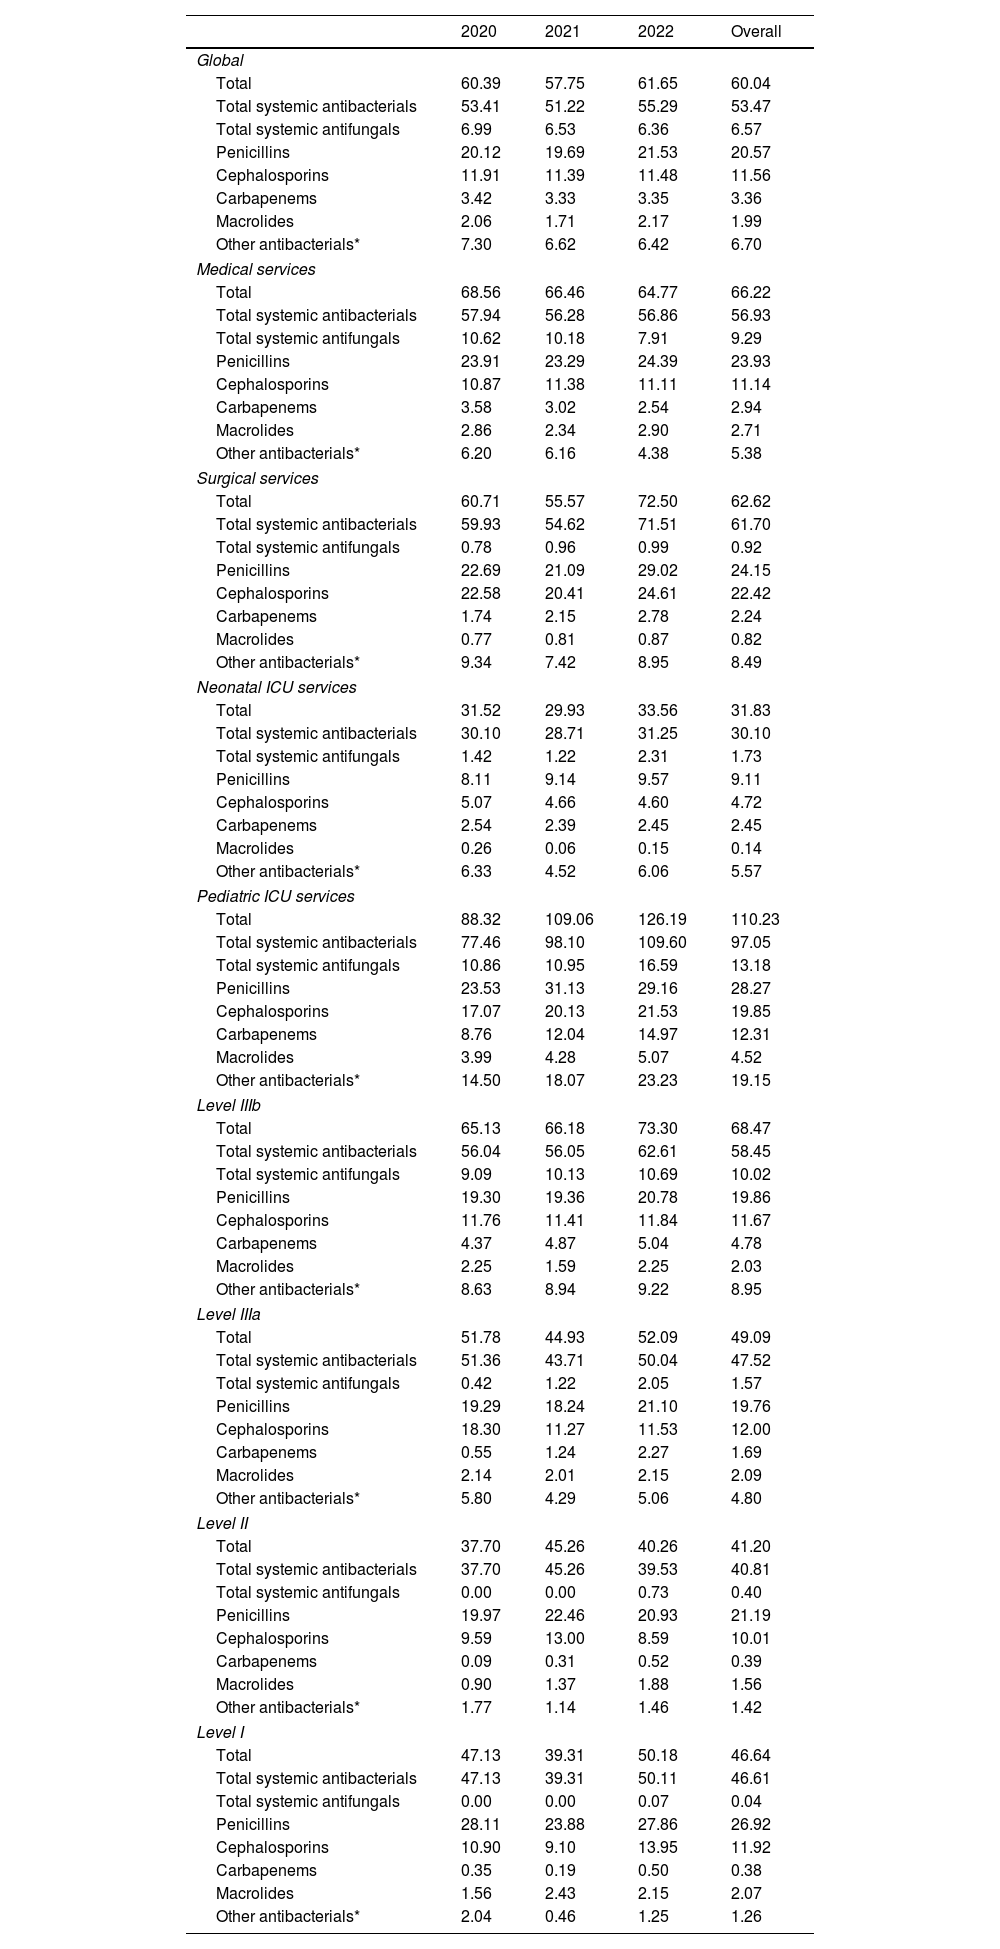
Antimicrobial consumption in pediatric hospitalized patientsTable 2 shows the evolution of pediatric hospital consumption between 2020 and 2022. Antimicrobials, antibiotics, and antifungals presented DOT/100PD rates of 60.04, 53.47, and 6.57 respectively.
Trends in hospital antimicrobial consumption in pediatric patients, 2020–2022 (DOT/100 bed-days).
| 2020 | 2021 | 2022 | Overall | |
|---|---|---|---|---|
| Global | ||||
| Total | 60.39 | 57.75 | 61.65 | 60.04 |
| Total systemic antibacterials | 53.41 | 51.22 | 55.29 | 53.47 |
| Total systemic antifungals | 6.99 | 6.53 | 6.36 | 6.57 |
| Penicillins | 20.12 | 19.69 | 21.53 | 20.57 |
| Cephalosporins | 11.91 | 11.39 | 11.48 | 11.56 |
| Carbapenems | 3.42 | 3.33 | 3.35 | 3.36 |
| Macrolides | 2.06 | 1.71 | 2.17 | 1.99 |
| Other antibacterials* | 7.30 | 6.62 | 6.42 | 6.70 |
| Medical services | ||||
| Total | 68.56 | 66.46 | 64.77 | 66.22 |
| Total systemic antibacterials | 57.94 | 56.28 | 56.86 | 56.93 |
| Total systemic antifungals | 10.62 | 10.18 | 7.91 | 9.29 |
| Penicillins | 23.91 | 23.29 | 24.39 | 23.93 |
| Cephalosporins | 10.87 | 11.38 | 11.11 | 11.14 |
| Carbapenems | 3.58 | 3.02 | 2.54 | 2.94 |
| Macrolides | 2.86 | 2.34 | 2.90 | 2.71 |
| Other antibacterials* | 6.20 | 6.16 | 4.38 | 5.38 |
| Surgical services | ||||
| Total | 60.71 | 55.57 | 72.50 | 62.62 |
| Total systemic antibacterials | 59.93 | 54.62 | 71.51 | 61.70 |
| Total systemic antifungals | 0.78 | 0.96 | 0.99 | 0.92 |
| Penicillins | 22.69 | 21.09 | 29.02 | 24.15 |
| Cephalosporins | 22.58 | 20.41 | 24.61 | 22.42 |
| Carbapenems | 1.74 | 2.15 | 2.78 | 2.24 |
| Macrolides | 0.77 | 0.81 | 0.87 | 0.82 |
| Other antibacterials* | 9.34 | 7.42 | 8.95 | 8.49 |
| Neonatal ICU services | ||||
| Total | 31.52 | 29.93 | 33.56 | 31.83 |
| Total systemic antibacterials | 30.10 | 28.71 | 31.25 | 30.10 |
| Total systemic antifungals | 1.42 | 1.22 | 2.31 | 1.73 |
| Penicillins | 8.11 | 9.14 | 9.57 | 9.11 |
| Cephalosporins | 5.07 | 4.66 | 4.60 | 4.72 |
| Carbapenems | 2.54 | 2.39 | 2.45 | 2.45 |
| Macrolides | 0.26 | 0.06 | 0.15 | 0.14 |
| Other antibacterials* | 6.33 | 4.52 | 6.06 | 5.57 |
| Pediatric ICU services | ||||
| Total | 88.32 | 109.06 | 126.19 | 110.23 |
| Total systemic antibacterials | 77.46 | 98.10 | 109.60 | 97.05 |
| Total systemic antifungals | 10.86 | 10.95 | 16.59 | 13.18 |
| Penicillins | 23.53 | 31.13 | 29.16 | 28.27 |
| Cephalosporins | 17.07 | 20.13 | 21.53 | 19.85 |
| Carbapenems | 8.76 | 12.04 | 14.97 | 12.31 |
| Macrolides | 3.99 | 4.28 | 5.07 | 4.52 |
| Other antibacterials* | 14.50 | 18.07 | 23.23 | 19.15 |
| Level IIIb | ||||
| Total | 65.13 | 66.18 | 73.30 | 68.47 |
| Total systemic antibacterials | 56.04 | 56.05 | 62.61 | 58.45 |
| Total systemic antifungals | 9.09 | 10.13 | 10.69 | 10.02 |
| Penicillins | 19.30 | 19.36 | 20.78 | 19.86 |
| Cephalosporins | 11.76 | 11.41 | 11.84 | 11.67 |
| Carbapenems | 4.37 | 4.87 | 5.04 | 4.78 |
| Macrolides | 2.25 | 1.59 | 2.25 | 2.03 |
| Other antibacterials* | 8.63 | 8.94 | 9.22 | 8.95 |
| Level IIIa | ||||
| Total | 51.78 | 44.93 | 52.09 | 49.09 |
| Total systemic antibacterials | 51.36 | 43.71 | 50.04 | 47.52 |
| Total systemic antifungals | 0.42 | 1.22 | 2.05 | 1.57 |
| Penicillins | 19.29 | 18.24 | 21.10 | 19.76 |
| Cephalosporins | 18.30 | 11.27 | 11.53 | 12.00 |
| Carbapenems | 0.55 | 1.24 | 2.27 | 1.69 |
| Macrolides | 2.14 | 2.01 | 2.15 | 2.09 |
| Other antibacterials* | 5.80 | 4.29 | 5.06 | 4.80 |
| Level II | ||||
| Total | 37.70 | 45.26 | 40.26 | 41.20 |
| Total systemic antibacterials | 37.70 | 45.26 | 39.53 | 40.81 |
| Total systemic antifungals | 0.00 | 0.00 | 0.73 | 0.40 |
| Penicillins | 19.97 | 22.46 | 20.93 | 21.19 |
| Cephalosporins | 9.59 | 13.00 | 8.59 | 10.01 |
| Carbapenems | 0.09 | 0.31 | 0.52 | 0.39 |
| Macrolides | 0.90 | 1.37 | 1.88 | 1.56 |
| Other antibacterials* | 1.77 | 1.14 | 1.46 | 1.42 |
| Level I | ||||
| Total | 47.13 | 39.31 | 50.18 | 46.64 |
| Total systemic antibacterials | 47.13 | 39.31 | 50.11 | 46.61 |
| Total systemic antifungals | 0.00 | 0.00 | 0.07 | 0.04 |
| Penicillins | 28.11 | 23.88 | 27.86 | 26.92 |
| Cephalosporins | 10.90 | 9.10 | 13.95 | 11.92 |
| Carbapenems | 0.35 | 0.19 | 0.50 | 0.38 |
| Macrolides | 1.56 | 2.43 | 2.15 | 2.07 |
| Other antibacterials* | 2.04 | 0.46 | 1.25 | 1.26 |
Penicillins were the most frequently used family, accounting for 34.3%, with combinations of penicillins and beta-lactamase inhibitors (21.1%) being the most used within this group, followed by cephalosporins (19.3%), especially third-generation cephalosporins (11.2%), and other systemic antibacterials (11.2%) and antifungals (10.9%). Amoxicillin/clavulanic acid was the most commonly used antibiotic overall (8.19 DOT/100PD), followed by ampicillin (4.62 DOT/100PD), piperacillin/tazobactam (4.59 DOT/100PD), and vancomycin (4.02 DOT/100PD) (supplementary Tables S3 and S4).
The most frequently used antimicrobials at pediatric medical services were amoxicillin/clavulanic acid (8.31 DOT/100PD), piperacillin/tazobactam (6.20 DOT/100PD), and ampicillin (4.70 DOT/100PD). At pediatric surgical services, the most used antimicrobials were amoxicillin/clavulanic acid (19.52 DOT/100PD), cefoxitin (8.32 DOT/100PD), and cefazolin (6.79 DOT/100PD). At NICUs, ampicillin (7.24 DOT/100PD), vancomycin (5.07 DOT/100PD), and gentamicin (4.70 DOT/100PD) were the most used. Finally, at PICUs, the most used antimicrobials were vancomycin (13.55 DOT/100PD), amoxicillin/clavulanic acid (12.55 DOT/100PD), and meropenem (11.94 DOT/100PD) (supplementary Table S3).
Antimicrobial use varied according to hospital level (Fig. 3). At Level IIIb centers, penicillins comprised 29.0% of antibiotic consumption, followed by cephalosporins (17.0%), systemic antifungals (14.6%), and other antibacterials (13.1%). At Level IIIa hospitals, penicillins accounted for 40.3% of total consumption, cephalosporins 24.4% and other antibacterials 13.1%. Notably, at Level II and I hospitals, penicillin and cephalosporin use amounted to 75.7% and 83.3% of total consumption respectively.
Discussion
This study represents the second analysis conducted by the VINCat Program of hospital antimicrobial consumption at adult and pediatric hospitals in Catalonia, Spain. Participation in the study has steadily increased over the years.
The data reveals a progressive rise in overall antimicrobial usage among hospitalized adults, accompanied by a shift in prescription patterns based on service type and hospital group/level. The DDD/PD values for antimicrobials at Catalan hospitals were lower than in other countries, such as Denmark, which reported values of 127.89 DDD/100PD in 2022,14 and the Netherlands, 85.79 DDD/100PD in 2020,15 but higher than in Belgium16 and elsewhere.
Compared to the first period, there was a 5.7% and 4.5% increase in overall antimicrobial consumption in the second and third periods, respectively. Some of the increase may be explained through the sustained increase of antifungals consumption over the years. Similar increases have been observed elsewhere in Europe, although the percentages vary from country to country. Regarding antibiotics, the unchanged consumption in the last 10 years may indicate a positive impact of the presence of antimicrobial stewardship committees since 2012 in all hospitals. However, we did not observe a reduction that could be attributed to the increase in hospitalized patients’ complexity, differences in the antimicrobial stewardship interventions and policies, COVID-19 pandemic17,18 and time availability of the ASP members in each center.19 Previous experiences showed the success of ASP in Spain with a reduction in antibiotic use without a negative impact on clinical outcomes,20 but this program may not have the same results in other countries and regions where the consumption of antimicrobials is more moderate as in our scenario. New feasible ASP interventions are needed to optimize antimicrobial prescription and, thus, improve patient outcomes, prevent adverse events and reduce antimicrobial resistance.
Penicillins accounted for 33.5% of the overall antimicrobial consumption, followed by cephalosporins (18.2%) and quinolones (13.9%). This distribution is comparable to that observed in other countries, although the proportion of penicillin use was slightly lower than in analyses from non-coincident periods (Denmark 56%, the Netherlands 35.2%, and Belgium 49.2%). Notably, there has been a change in the antibiotic spectrum used over the study period, with quinolones falling from second place in 2008 to fourth if we include the category of other antibiotics. The figure for quinolone use in the 2018–2022 period, at 7.98 DDD/PD, was similar to those described for other countries in 2016.16 This reduction can be attributed to policies on antimicrobial use implemented in both hospital and community settings. Although we did not analyze its impact on local antimicrobial resistance, the reduction in quinolones may come with benefits as they are associated with increased risk of antimicrobial resistance, serious adverse effects21 an Clostridioides difficile infection.22
Among cephalosporins, an increase in the use of the third-generation variety was mainly observed at hospitals in Groups II and III (Table 1). This can be attributed to the higher consumption of ceftriaxone, which in our setting presented a more frequent use than in Denmark (in 2022, 1.52 DDD/100PD) but similar to data published in the Netherlands (in 2020, 9.93 DDD/100PD). There is some concern about carbapenems, included in the “Watch” group, since their use has increased over the years. The increase in carbapenem treatments may be reflective of an increase in the incidence of β-lactam-resistant infections, such as those caused by extended spectrum β-lactamase (ESBL)-producing organisms23 to which they are considered the first-line therapy and the impact of COVID-19 pandemic. The CARBA-MAP study24 revealed a worrisome increase in the incidence of carbapenemase-producing Enterobacterales and carbapenem-resistant Pseudomonas aeruginosa in Spain, and evidence showed that meropenem was associated with resistance emergence.25 Our meropenem use is higher than in other European countries.26 Therefore, ASP actions should be strengthened in hospital settings, especially in the intensive care units.
The rise in antibiotic usage for treating infections caused by Gram-positive cocci deserves mention. This increase was especially notable in ICU services, where cloxacillin and daptomycin emerged as the two most frequently prescribed antibiotics for Gram-positive infections. Despite this escalation, the use of vancomycin has not declined and in fact has remained stable over the past eight years. This pattern is not unique to our setting but is observed across various regions and healthcare facilities.
Our findings show that the overall escalation in antimicrobial consumption is linked to its use in surgical services, where it has exhibited an upward trend over the past decade. The rise in surgical services primarily stems from the increased use of carbapenems and antibiotics targeting Gram-positive microorganisms. Various interventions aimed at optimizing antibiotic treatment in surgical services have been documented in the literature.27,28 In this context, the PROA VINCat group introduced the 7VINCut intervention designed to reduce the proportion of patients receiving treatment for longer than seven days in the surgical services, and has obtained favorable initial results. However, we did not observe a global decrease in antimicrobial use and its impact on consumption within these services requires further evaluation.8
Antimicrobial use was substantially higher at ICU services. This can be attributed to the presence of more severe and complex diagnoses with a higher risk of infection in the ICU setting. At ICU services, meropenem was the most used antibiotic in 2022, followed by amoxicillin/clavulanic acid and piperacillin/tazobactam, whose consumption has remained steady over the last 15 years. Additionally, over the last two years, there has been a notable increase in antimicrobial use at ICU services. Available evidence showed that COVID-19 pandemic changed the prevalence of sepsis in the ICU and increased the consumption of agents with activity against multidrug-resistant strains.17 The disruption of certain infection control measures and ASP during the pandemic could explain these results. Prior to the COVID-19 pandemic, ASP in ICU had a positive impact on antimicrobial prescription and incidence of infections caused by multidrug-resistant microorganisms.29 Innovative long term ASP strategies coupled with infection prevention and control strategies should be implemented.
In 2021, The VINCat Pediatric PROA SHARP Survey was conducted, revealing that 20% of hospitals had pediatric PROA in operation, 42% were included in adult PROA, and 46% carried out pediatric PROA activities but not as part of an established program.7 Presently, owing to the efforts of various centers in adapting consumption measurement units to DOT/100PD, 33 hospitals participate in the VINCAT-PROA pediatric program, encompassing more than 75% of pediatric hospitalization beds in Catalonia. This holds significant importance considering that antimicrobials constitute the primary therapeutic group used in pediatrics, with approximately 40% of hospitalized pediatric patients receiving antimicrobials, as observed in the European hospitalized children point prevalence of antibiotic study.30
In our registry, the overall antimicrobial consumption was 60.04 DOT/100PD. This value was lower than those reported in most unicentric/multicentric studies with antimicrobial prescriptions for infections in a pediatric hospital.31,32 The most frequently used drug classes included combinations of penicillins, including beta-lactamase inhibitors, and third-generation cephalosporins, followed by penicillins with extended spectrum and glycopeptides across all hospital levels. Previous studies have also highlighted a high frequency of use of these classes in children hospitalized for infections.33
Some differences are observed between different hospitals levels, reflecting variations in the clinical complexity of patients treated at each hospital. Thus, the utilization of carbapenems, glycopeptides, quinolones, sulfonamides, and trimethoprim is concentrated in Level IIIB hospitals, where patients undergoing solid organ transplantation, oncology-hematology, and ICU services are treated. Similarly, Level IIIB hospitals were majority prescribers of systemic antifungals, employed for prophylaxis or treatment of infections affecting neonates and immunocompromised patients. These results regarding the use of systemic antifungals similar to other studies.34
Finally, it is noteworthy that hospitals at levels I and II exhibit a higher consumption of penicillins and cephalosporins, indicating a reasonable overall antimicrobial utilization profile corresponding to the complexity of care provided to pediatric patients at the hospital levels.
Our study has certain limitations. First, the ATC/DDD methodology itself implies some limitations as DDD assume routine dosing that may not be the recommended doses in patients with obesity or who have central nervous system infections, when high doses are needed, and biases against combination therapy. And it may be inaccurate in certain patients such as those with renal impairment. Second, the large number of participating centers and the changes they have undergone during the study period may create confounding elements. However, the classification of the hospitals and the robustness of having 15 years of consumption helps to mitigate such confounding elements. We did not analyzed changes in demographic data and underlying diseases of adult hospitalized as well specific antimicrobial strategies and policies implemented in each center to correlate with change in antibiotic consumption. Fourth, lack of microbiological data or resistance trends to correlate with antibiotic utilization. Fifth, data were annually provided although it is not the gold standard for benchmarking purposes. Finally, the statistical analysis was selected considering the number of data collected although it do not consider the presence of temporal autocorrelation.
In conclusion, we achieved a high level of participation in both adult and pediatric hospitals. Fifteen-year trends showed an increase in overall antimicrobial consumption in adult hospitals, where the rising use of carbapenems and other antibiotics is a matter of concern. The highest consumption was identified in ICUs and in onco-hematology hospitals. Antimicrobial consumption in pediatric hospitals showed that penicillins were the most frequently used antibiotics, but differences in prescribing patterns were observed according to hospital level.
FundingThe VINCat Programme is supported by public funding from the Catalan Health Service, Department of Health, Generalitat de Catalunya.
Conflicts of interestAll authors declare no conflict of interest relevant to this article.
Data availabilityRestrictions apply to the availability of these data, which belong to a national database and are not publicly available. Data was obtained from VINCat and are only available with the permission of the VINCat Technical Committee.
By alphabetical order: Alba María Martínez, Albert Planas, Alejandro Sanjuan, Ana Ayestarán, Ana Montero, Anna Capella, Anna Gòmez, Anna Murgadella, Antonia Balet, Antonio Martinez, Begoña Pascual, Borja Guarch Ibañez, Camila Valls, Carla Codina, Carlos Segui, Carme Ortiz Castellón, Carmen Muñoz, Carmina Fernández, Cecilia Mariño, Clara Sebastián, Daniel Echeverría-Esnal, Daniel Serrano, Daria Ayago, David Campany, Edurne Fernández, Elisabet Farré, Elisenda Flotats, Elvira Ramió, Eneritz Velasco, Ester Valls, Esther Julian, Eugènia Òdena, Fatima Artime, Gemma Enrique-Tarancon, Gemma Garreta, Glòria Molas, Irina Aguilar, Isabel Frigola, Isabel Martinez, Iván Javier, Josep De La Flo, Josep M. Badía, Josep Torrent, Juan González, Juan Serrais, Julen Montoya, Julia Bodega, Laia Lopez, Laura Borras, Laura Canadell, Laura Gratacos, Leo Munell, Lucía Boix, Ludivina Ibañez, M. Teresa Barrera, M.ª Dolores Garcia, M.ª José Fraile, Maite Bosch, Mar Pineda, Marcel La Camps, María Alcalde, Maria Del Mar Laya, Maria Dolors Borrell, Maria Goretti López, Maria José Fortuny, Maria Pilar Gracia, Maria Priegue, Marina Del Temple, Marissa Graño, Marlene Àlvarez, Marta Hueto, Marta Isern, Marta Martí, Marta Martín, Marta Munné, Melisa Barrantes, Mercè Espona, Mercè Santó, Miguel Almansa, Mireia Fuster, Mireia Martinez, Mireia Mensa, Mohamed Sufian Al-Dirra Taha, Montiel Faus, Montse Tuset, Montserrat Carrascosa, Montserrat Navarro, Montserrat Rodriguez, Natalia Carrasco, Nuri Quer, Nuria Bosacoma, Núria Gotanegra, Nuria Miserachs, Nuria Pi, Núria Solé, Olga Curiel, Paula Arcenillas, Pepa Boada, Pere Sala Castellví, Pilar Capdevila, Pilar Marcos, Pilar Taberner, Ramón Garcia, Raquel Aguilar, Rebeca Recha, Rocio Gil, Romina Conti, Rosa Madridejos, Rosa Morera, Sandra Fontanals, Sara Oduber, Sara Ortonobes, Silvia Armengol, Silvia Serdà, Susana Terré, Usúe Manso, Verónica Aguilera, Virginia Gol and Virginia Maria.
The following are the supplementary data to this article:
Evolution of hospital consumption (DDD/100 patient-days) of the main subfamilies of antimicrobials for systemic use in adult patients.
Evolution of hospital consumption (DDD/100 patient-days) of the main antimicrobials for systemic use in adult patients.
Evolution of hospital consumption (DOT/100 patient-days) of the main subfamilies for systemic use in pediatric patients.
Evolution of hospital consumption (DOT/100 patient-days) of the main antimicrobials for systemic use in pediatric patients.