


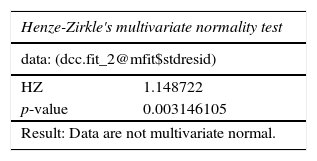
This paper analyzes the relationship between the production of agricultural foods (cereals and vegetable oils) and the production of energy by using food. The observed increase in economic activities that use energy has had an impulse in the energy industry with higher prices. These prices make profitable the biofuel production, and this encourage the use of cereals for biofuel production, affecting the whole food chain. This research demonstrates that the agricultural foods and energy production system has been in place at least since 2000 and that it remains active or latent depending on the price of energetics. The paper also shows that the temperature variations do not lead the system to an adjustment. To do, this research uses the econometric technique of Dynamic Conditional Correlation, and a new tool, phase synchronization. The use of the latter avoid making assumptions on the distribution or stability of the involved variables.
Este trabajo analiza la relación entre la producción de alimentos y la producción de energía mediante el uso de alimentos. El aumento observado en las actividades económicas que utilizan energía ha tenido un impulso en la industria energética con precios más altos. Estos precios hacen rentable la producción de biocombustibles, lo que promueve el uso de cereales aceitosos para la producción de biocombustibles, afectando a toda la cadena alimentaria. Esta investigación demuestra que el sistema de alimentos y energía ha estado en vigor al menos desde el 2000 y que permanece activo o latente dependiendo del precio de la energía. El documento también muestra que las variaciones de temperatura no llevan al sistema a un ajuste. Para ello, esta investigación utiliza la técnica econométrica de correlación condicional dinámica y una nueva herramienta, la sincronización de fase. El uso de esta última evita hacer suposiciones sobre la distribución o la estabilidad de las variables involucradas.
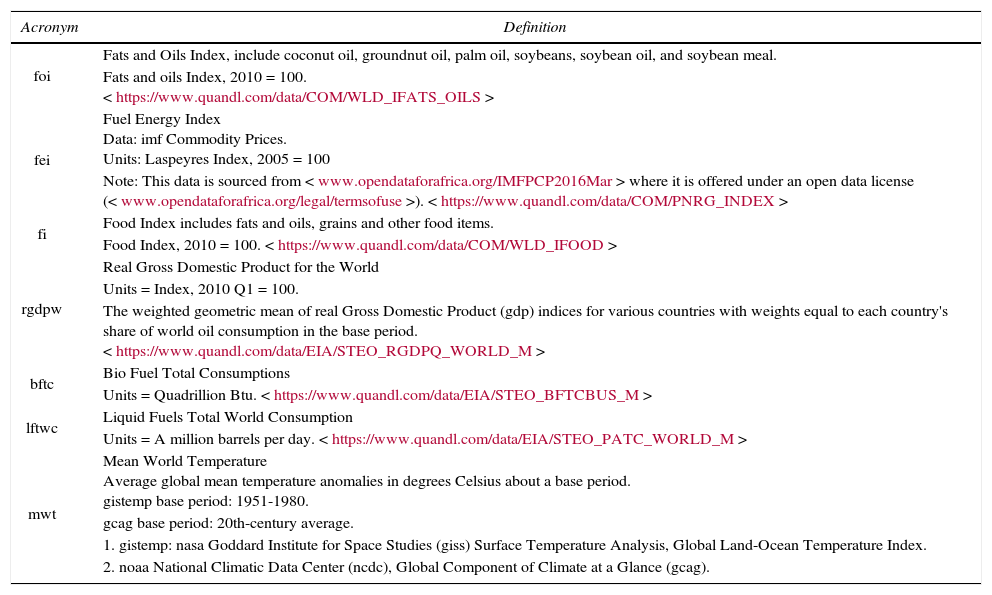
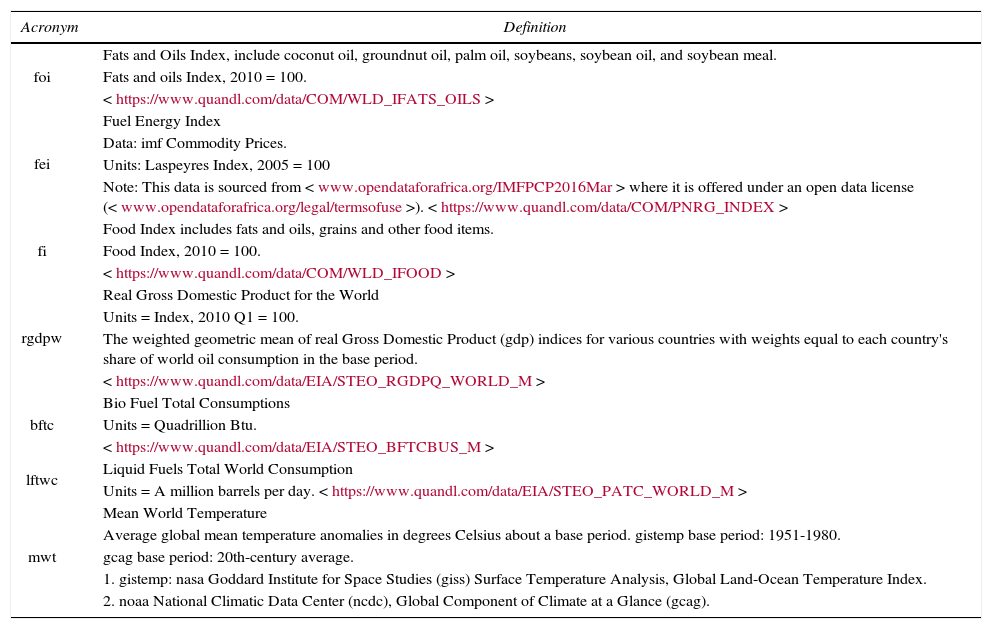
This index includes prices of coal and oil, it is buid by the International Monetary Fund. It can be retrieved from <https://www.quandl.com/data/COM/PNRG_INDEX>.
This index includes prices from fats, oils, grains and other foods. It can be retrieved from <https://www.quandl.com/data/COM/WLD_IFOOD>.
This index includes coconut oil, groundnut oil, palm oil, soybeans, soybean oil and soybean meal. It can be retrieved from <https://www.quandl.com/data/COM/WLD_IFATS_OILS>.
This includes gasoline, diesel, oil and other fuels in liquid form.
The second generation of technology for biofuel production uses biological wastes, foliage, and other crop residuals to create the ethanol or the biodiesel. These processes are still in the research phase and, for the moment; they are not economically feasible.
Theoretically, the growing plants used for making the fuel captures all the carbon that will be released when the fuel is used and the carbon released while raising the crop.
The R code, the data, and all the test's results are available to any interested lector by email.
As an example, consider the deterministic function f(x) = cos (x), which has a cycle each 2π steps on its domain (all the real line).
In the case of the f(x) = cos (x) function, the time difference (t–t1 and t2–t1 respectively) between the first and the second cycles (k1 and k2 respectively) will be constant.
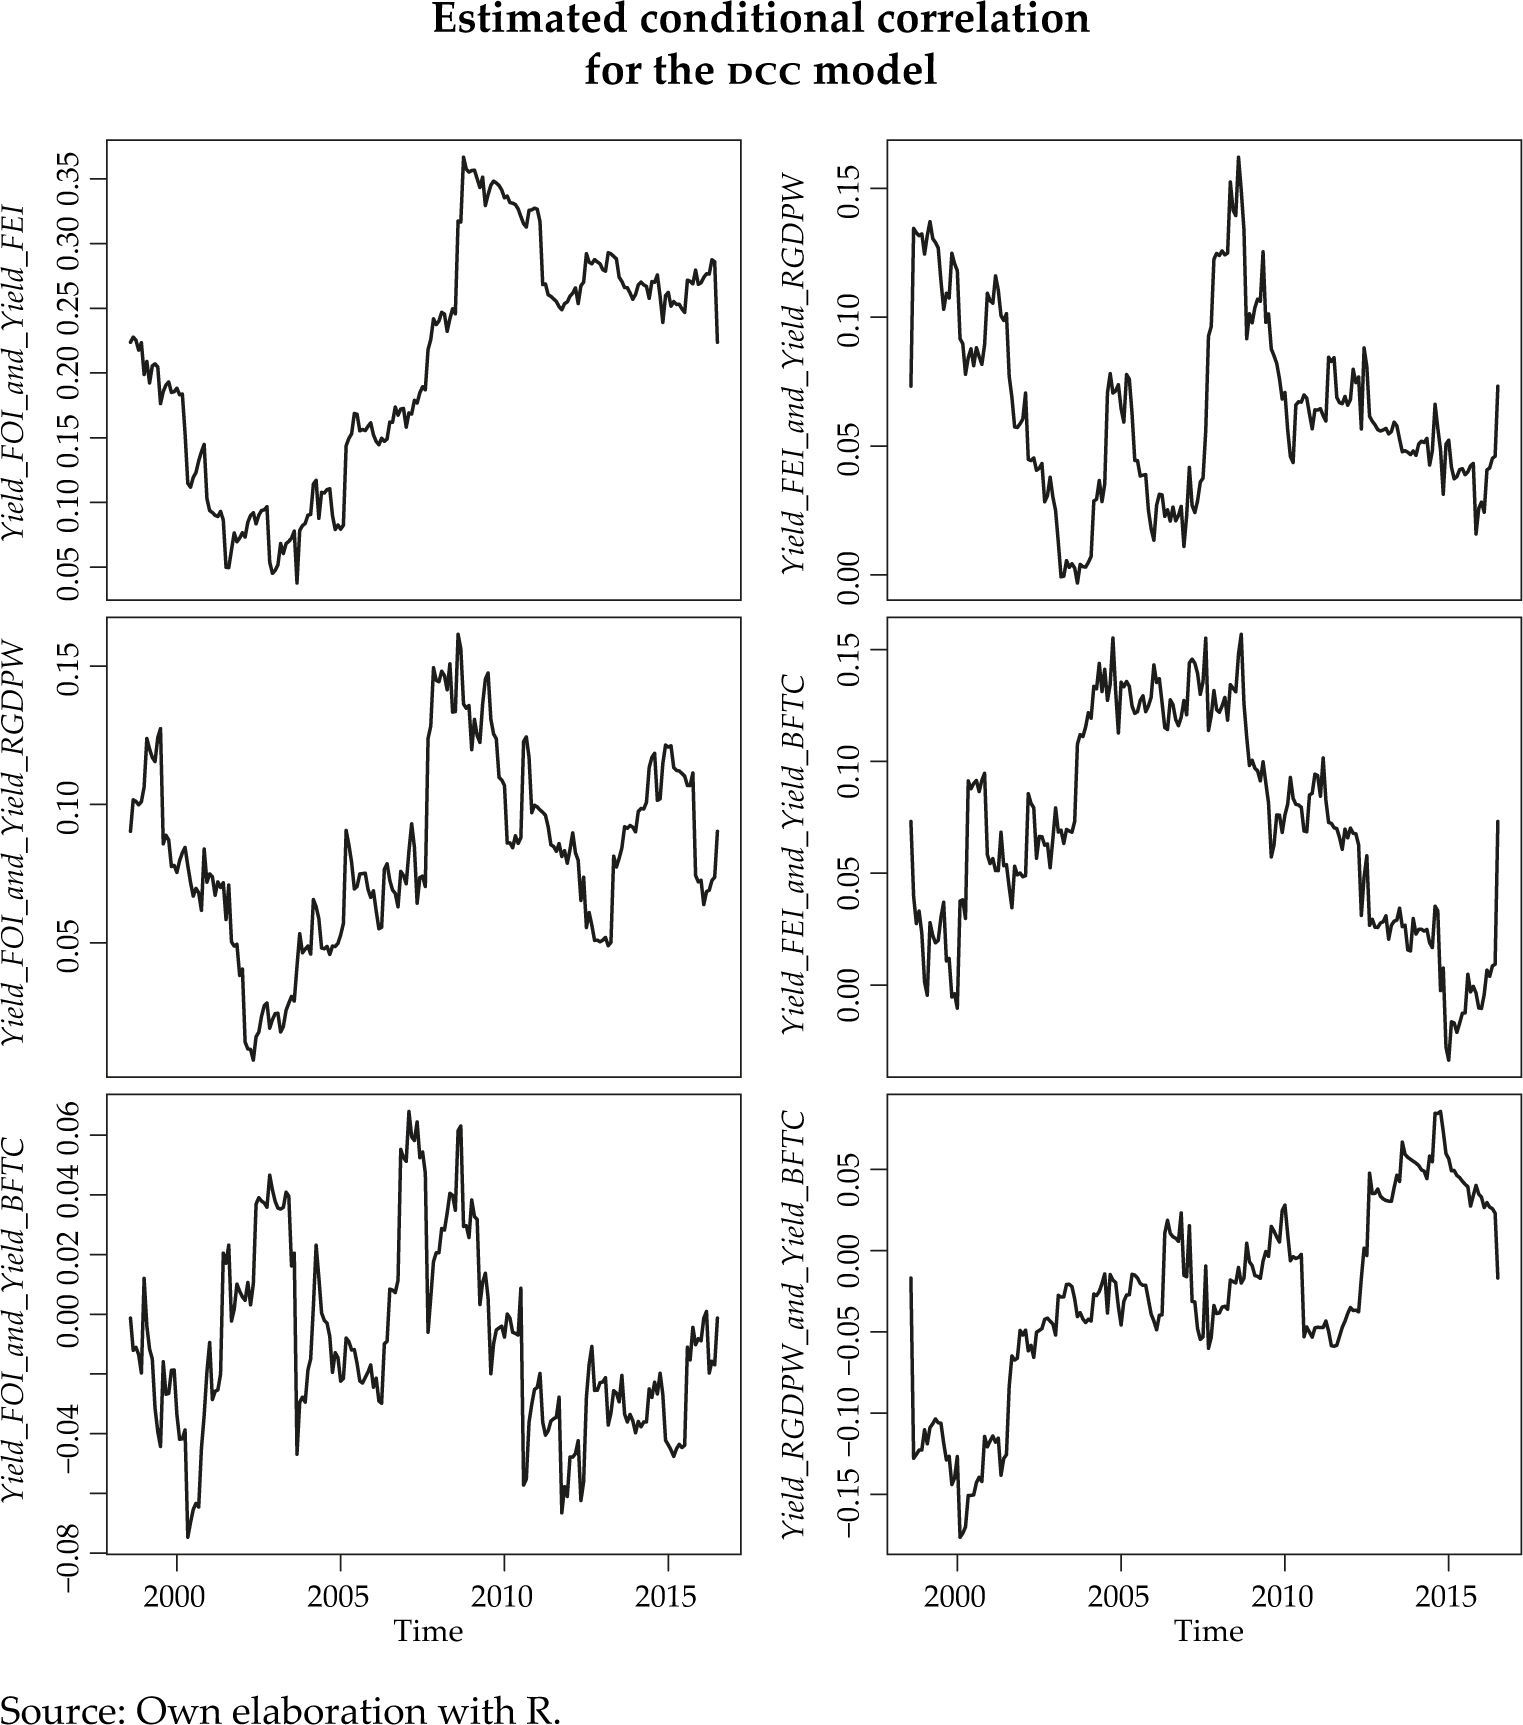
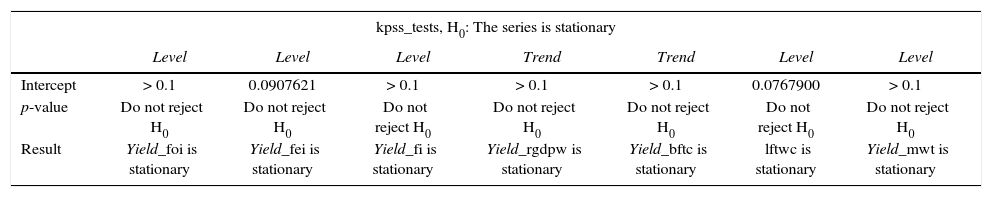
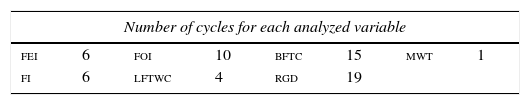
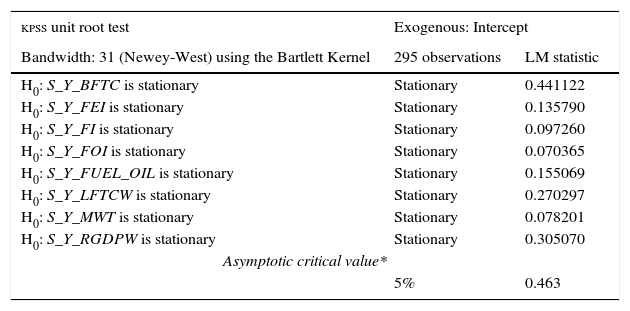
Biofuel Total Consumption, bftc; Liquid Fuels Total World Consumption, lftwc; Food Index, fi, and Fuel Energy Index, fei.
After the Main Editor of Investigación Económica saw the referees’ reports and the debate in their comments, he asked the referees to write a response to the paper “The nonlinear relation between biofuels and food prices”, written by Cruz Aké (2017), to encourage a deeper debate on this current topic.
Mexico imported 6,778 billions of USD in cereals on 2016 (inegi, 2017).
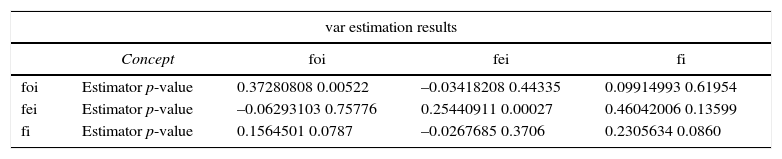
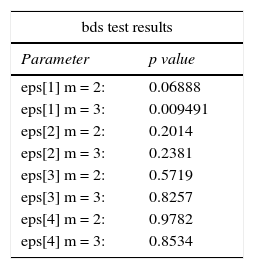
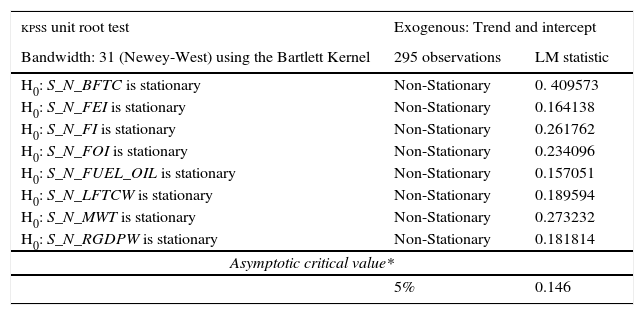
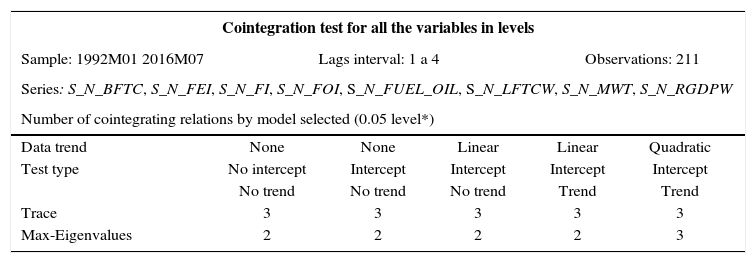
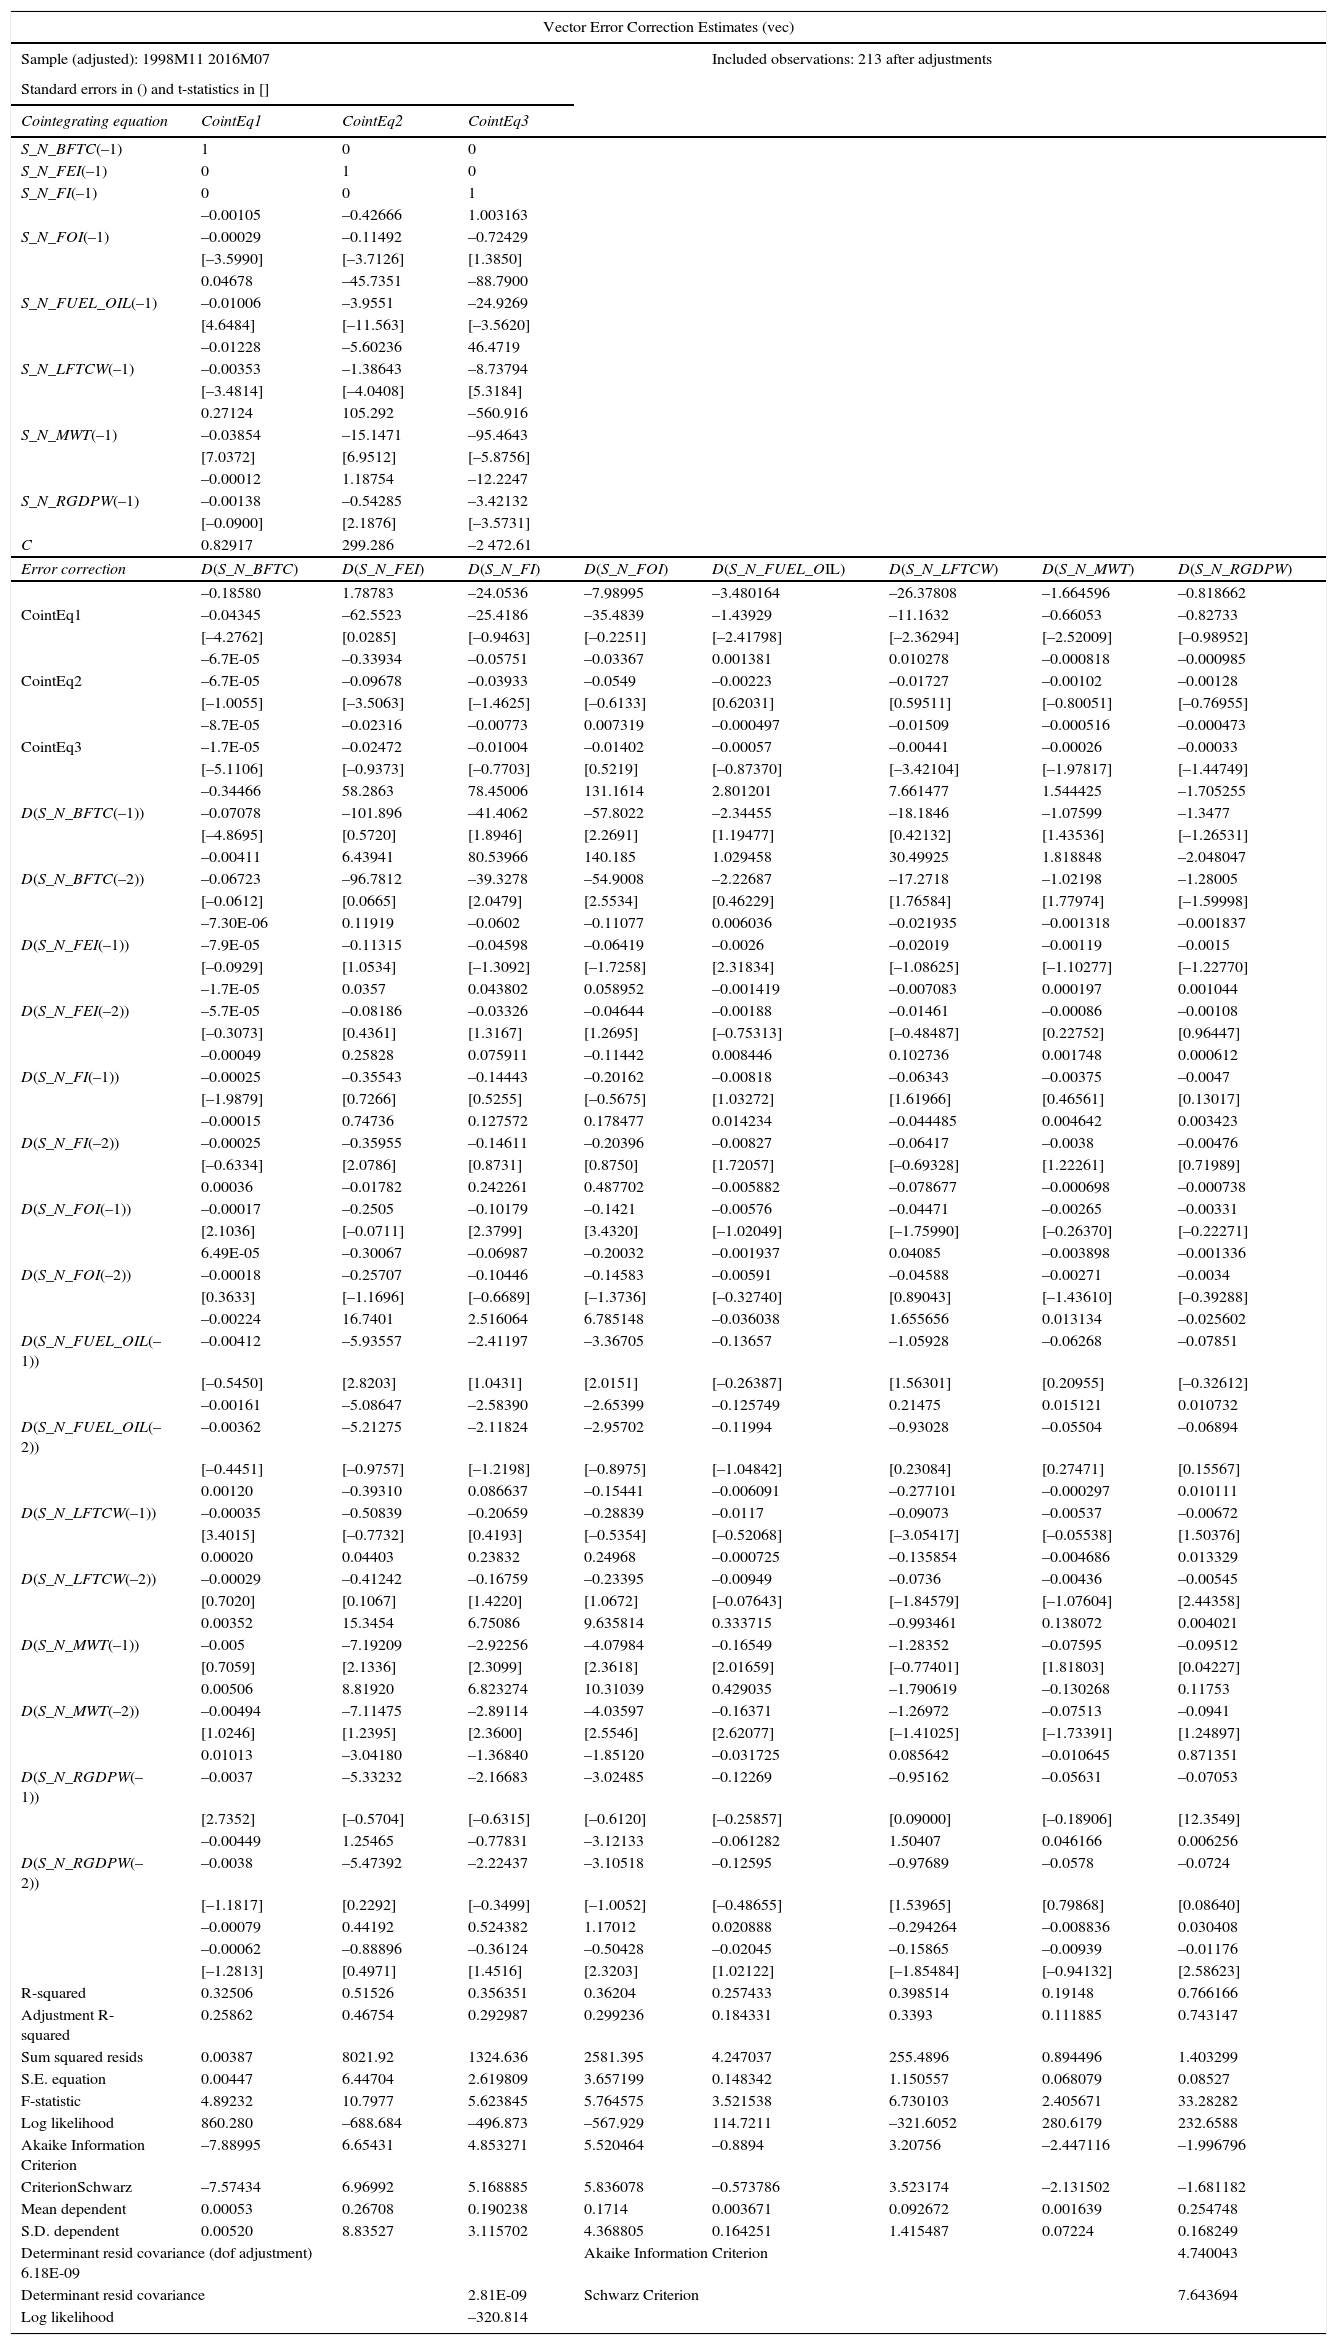
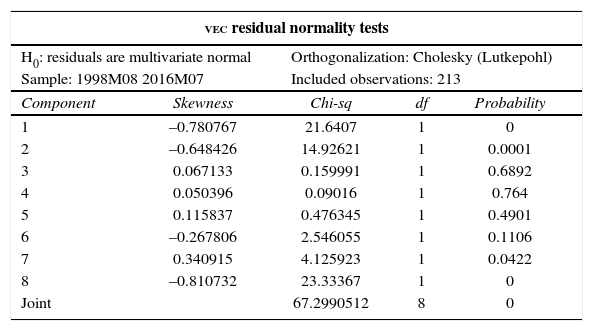
We also tried the 2 cointegrating equations approach, but the 3 cointegration equations approach provides better results.
The measurement is a weighted index that uses the country's fuel consumption to weight up the importance of each country in the index.