


To use a risk scale or predictive model outside the population of origin, it is necessary to evaluate the predictive indicators through external validation. The aim was to validate the FAscore, originally constructed in hypertensive patients in primary care in the Valencian Region, in an external cohort with hypertension in primary care in the Basque Country.
MethodsA retrospective cohort study was designed to perform an external validation of the FAscore app in patients affiliated with 26 health centers in the municipality of Bilbao. The area under the ROC curve and predictive indicators were calculated with their 95% confidence intervals.
ResultsThirty-six thousand eight hundred nine patients were included: 53.6% (n=19,719) were women, the mean age was 75.1 years, 41.8% (n=15,381). Over the four-year follow-up period, 1420 patients were diagnosed with AF (cumulative incidence 3.9%). The median risk estimated by FAscore was 4.5%, and the 5th, 25th, 75th, and 95th percentiles were 1.0%, 2.5%, 6.1%, and 14.8%, respectively. The ROC curve for the risk estimated by FAscore and the cases of atrial fibrillation observed was AUC 0.715 (95% CI 0.703–0.727). The 5% risk cutoff provides a sensitivity of 70.8%, specificity of 61.0%, positive predictive value of 6.8%, negative predictive value of 98.1%, and positive and negative likelihood ratios of 1.82 and 0.48, respectively.
ConclusionThis study reports on the external validation of the atrial fibrillation risk scale in hypertensive patients, which shows an acceptable predictive capacity. The best-performing risk cutoff, providing good predictive indicators, can be set at 5%.
Para utilizar una escala de riesgo fuera de la población de origen es necesario evaluar los indicadores predictivos mediante una validación externa. El objetivo fue validar el FAscore en una cohorte externa con hipertensión en atención primaria en el País Vasco.
MétodosEstudio de cohorte retrospectivo para validación externa de la aplicación FAscore en pacientes de 26 centros de salud en el municipio de Bilbao. Se calculó área bajo la curva ROC e indicadores predictivos con sus intervalos de confianza al 95% (IC 95%).
ResultadosSe incluyeron 36.809 pacientes: el 53,6% (n=19.719) eran mujeres y la edad promedio fue de 75,1 años (41,8%; n=15.381). Durante el periodo de seguimiento de 4 años se diagnosticó fibrilación auricular en 1.420 pacientes (incidencia acumulativa 3,9%). La mediana del riesgo estimado por el FAscore fue del 4,5% y los percentiles 5, 25, 75 y 95 fueron 1,0%, 2,5%, 6,1% y 14,8%, respectivamente. La curva ROC para el riesgo estimado por el FAscore y los casos de fibrilación auricular observados fue de AUC 0,715 (IC 95%: 0,703-0,727). El punto de corte del 5% de riesgo proporciona una sensibilidad del 70,8%, una especificidad del 61,0%, un valor predictivo positivo del 6,8%, un valor predictivo negativo del 98,1% y razones de probabilidad positiva y negativa de 1,82 y 0,48, respectivamente.
ConclusiónLa validación externa de la escala de riesgo muestra una capacidad predictiva aceptable. El punto de corte de riesgo que mejor funciona se puede establecer en el 5%.
Atrial fibrillation (AF) is the most common chronic arrhythmia in adults. Currently, the estimated prevalence worldwide is around 2–4%, but this figure is expected to double or even triple by 2060 due longer life expectancies and improved detection of the condition.1 In Spain, the reported prevalence of AF varies by study, but it is estimated at 4.4% in people over 40 years of age,2 9% in those over 50,3 and 5–15% in those over 80.4 AF is thus an important health problem and one of the leading reasons to seek health care in Western countries.5
The risk of AF increases with age and is associated with different risk factors, such as smoking, alcohol, obesity, hypertension, diabetes, and previous heart disease.6 The European Heart Rhythm Association (EHRA)/European Association of Cardiovascular Prevention and Rehabilitation (EACPR) considers that AF leads to increased morbidity as well as a 40–90% rise in mortality from stroke, dementia, heart failure, and acute myocardial infarction (AMI).7
Even if AF is not specifically associated with any concomitant condition or underlying morbidity, in most cases there is some relevant history of disease. Several pathological processes affect the atrium, including collagen, lipid, and amyloid deposits that contribute to the genesis and perpetuation of AF,8 a phenomenon known as atrial cardiomyopathy.9 Several studies point to the fundamental role of arterial hypertension as a risk factor for AF, which may be behind up to 14% of all cases. Hypertension is present in around 70% of patients with AF, and anywhere from 49% to 90% of participants in randomized trials.10,11 On the other hand, comorbidities such as diabetes can complicate the effects of anticoagulation therapy or control strategies, increasing the risk of adverse cardiovascular events and death.12 Similarly, hypertension may increase the risk of stroke or systemic embolism.13
In recent years, several community-based predictive models for AF have been developed, such as the Cohorts for Heart and Aging Research in Genomic Epidemiology (CHARGE-AF)14; the Framingham Heart Study risk for Atrial Fibrillation (FHS-AF)15; and Congestive Heart Failure, Hypertension, Age, Diabetes, Previous Stroke (CHA2DS2-VASc),16 with predictive C-index values of around 0.70.
In a recent study,17 our research group fitted a predictive model for the appearance of AF at four years in patients over 40 years of age with hypertension, based on four predictors: body mass index (BMI), age, sex, and a diagnosis of heart failure. The study included patients who attended primary care in the Valencian Region from 2008 to 2012. The resulting predictive model was a multivariable Cox model, adjusted for a population of 12,206 patients, with an incidence of AF of 3.2% at a mean follow-up of three years and four years at most; it yielded an acceptable predictive capacity (C-index 0.69 estimated by cross-validation). Using this model as a basis, a point-based risk scale was constructed based on the Sullivan et al.’s approach,18 and an application for Android mobile devices called FAscore was developed. The app calculates four-year AF risk using four predictor questions, does not store any patient information, is free, and can be downloaded from the Google Play Store.
To use a risk scale or predictive model outside the population of origin, it is necessary to evaluate the predictive indicators through external validation. The differential characteristics of patients in each region of Spain can affect the prevalence of AF and the behavior of predictive models. Thus, the aim of this study was to validate the FAscore, originally constructed in hypertensive patients in primary care in the Valencian Region, in an external cohort of patients with hypertension in primary care in the Basque Country.
Material and methodsThis retrospective cohort study was designed to perform an external validation of the FAscore app in patients affiliated with 26 health centers in the municipality of Bilbao (Basque Country, Spain), covering a total population of 342,484 inhabitants as of 1 January 2023, according to census data. The study took place between September and December 2023, complies with the principles of the Declaration of Helsinki, and was approved by the Office for Responsible Research of Miguel Hernández University (Alicante, Spain; authorization code AUT.DMC.JAQR.230912). Since this was a clinical history review study, the need for informed consent was waived.
The study included people aged 40 years or older, with a diagnosis of hypertension (International Classification of Diseases, 10th revision [ICD-10] I10-I15) recorded in their medical records before 31 December 2019, and registered with the public primary care health centers of Bilbao. Patients with a diagnosis of AF or cardiovascular event (ICD-10: I20–I25, I60–I69) before the diagnosis of hypertension and the start of follow-up were excluded, as were patients aged 95 years or older (the maximum age envisaged in the risk scale). The outcome variable was the occurrence of AF (ICD-10 diagnosis: I48) over follow-up, from 1 January 2016 (or date of hypertension diagnosis if this was after 1 January 2016) to 31 December 2019 (four years’ maximum follow-up).
Patients electronic medical records were reviewed to collect the variables necessary to calculate AF risk using the FAscore risk scale (at the date nearest the beginning of follow-up): sex (male/female), age (years), BMI (kg/m2), and diagnosis of heart failure (ICD-10 I50, yes/no). In addition, information was collected on other variables: diagnosis of dyslipidemia (ICD-10 E78, yes/no), treatment for hypertension with angiotensin-converting enzyme (ACE) inhibitors or angiotensin II receptor antagonists (ARA-II) (yes/no), systolic and diastolic blood pressure (mmHg), albumin (g/dL), creatinine (mg/dL), total cholesterol (mg/dL), basal glucose (mg/dL), high-density lipoprotein (HDL) cholesterol (mg/dL), and triglycerides (mg/dL).
Statistical analysisA descriptive analysis of the variables was performed by calculating absolute and relative frequencies of categorical variables, and the mean, standard deviation (SD), and range of quantitative variables.
The risk of AF occurrence at four years was calculated using the FAscore risk point scale, entering in the baseline values of the study variables to obtain the risk, expressed as a percentage and illustrated with a histogram. External validation of the FAscore consisted of comparing the risk estimated using the FAscore with the AF diagnoses observed in the study population. The area under the receiver-operating characteristics (ROC) curve (AUC) was calculated, together with its 95% confidence interval (CI), as a predictive indicator of the FAscore. Calibration graph was calculated.
To evaluate the optimal cutoff to best predict a case of AF, we calculated the sensitivity, specificity, positive and negative predictive values (PPV and NPV), and likelihood ratios at each cutoff point, along with their 95% Cis, and Youden index. Analyses were performed with the R program v.4.2.2.2.19
ResultsA total of 58,116 patients met the inclusion criteria. After excluding 19,948 (34.3%) patients who did not present valid values for all the FAscore variables and 1359 (2.3%) who were over 94 years of age, the final sample included in the analysis comprised 36,809 patients: 53.6% (n=19,719) were women, the mean age was 75.1 years, 41.8% (n=15,381) were overweight, and 39.2% (n=14,451) were obese. In addition, 3.8% (n=1403) had heart failure, 20.3% (n=7464) dyslipidemia, and 47.4% (n=17,430) were being treated with ACE inhibitors/ARA-II for hypertension. Blood tests showed mean values of 200.1mg/dL for total cholesterol, 58.8mg/dL for high-density lipoprotein (HDL) cholesterol, 107.1mg/dL for basal glucose, and 130.4mg/dL for triglycerides. Mean systolic/diastolic blood pressure was 80/138mmHg (Table 1).
Sample characteristics (n=36,809).
| Categorical variables | n | % |
|---|---|---|
| Sex | ||
| Male | 17,090 | 46.4 |
| Female | 19,719 | 53.6 |
| Body mass index | ||
| Normal weight (<25kg/m2) | 6977 | 19.0 |
| Overweight (25–29.9kg/m2) | 15,381 | 41.8 |
| Obesity, class I (30–34.9kg/m2) | 9576 | 26.0 |
| Obesity, class II (≥35kg/m2) | 4875 | 13.2 |
| Heart failure | ||
| No | 35,406 | 96.2 |
| Yes | 1403 | 3.8 |
| Dyslipidemia | ||
| No | 29,345 | 79.7 |
| Yes | 7464 | 20.3 |
| Treatment with ACE inhibitors/ARA-II for hypertension | ||
| No | 19,379 | 52.6 |
| Yes | 17,430 | 47.4 |
| Atrial fibrillation | ||
| No | 35,389 | 96.1 |
| Yes | 1420 | 3.9 |
| Quantitative variables | n | Mean | SD | Range |
|---|---|---|---|---|
| Age, years | 36,809 | 75.12 | 11.43 | 41.00–94.00 |
| Albumin, g/dL | 25,993 | 4.45 | 0.89 | 2.11–49.10 |
| Creatinine, mg/dL | 34,652 | 0.92 | 0.38 | 0.32–8.57 |
| Total cholesterol, mg/dL | 34,802 | 200.12 | 39.66 | 81.00–372.00 |
| Basal glucose, mg/dL | 35,012 | 107.14 | 32.86 | 41.00–496.00 |
| HDL cholesterol, mg/dL | 34,208 | 58.81 | 17.27 | 10.00–159.00 |
| Triglycerides, mg/dL | 34,239 | 130.39 | 71.77 | 25.00–787.00 |
| Diastolic blood pressure, mmHg | 36,683 | 80.35 | 10.80 | 37.00–145.00 |
| Systolic blood pressure, mmHg | 36,711 | 138.23 | 16.83 | 60.00–248.00 |
HDL: high-density lipoprotein.
Over the four-year follow-up period, 1420 patients were diagnosed with AF (cumulative incidence 3.9%). The median risk estimated by FAscore was 4.5% (Fig. 1).
.")
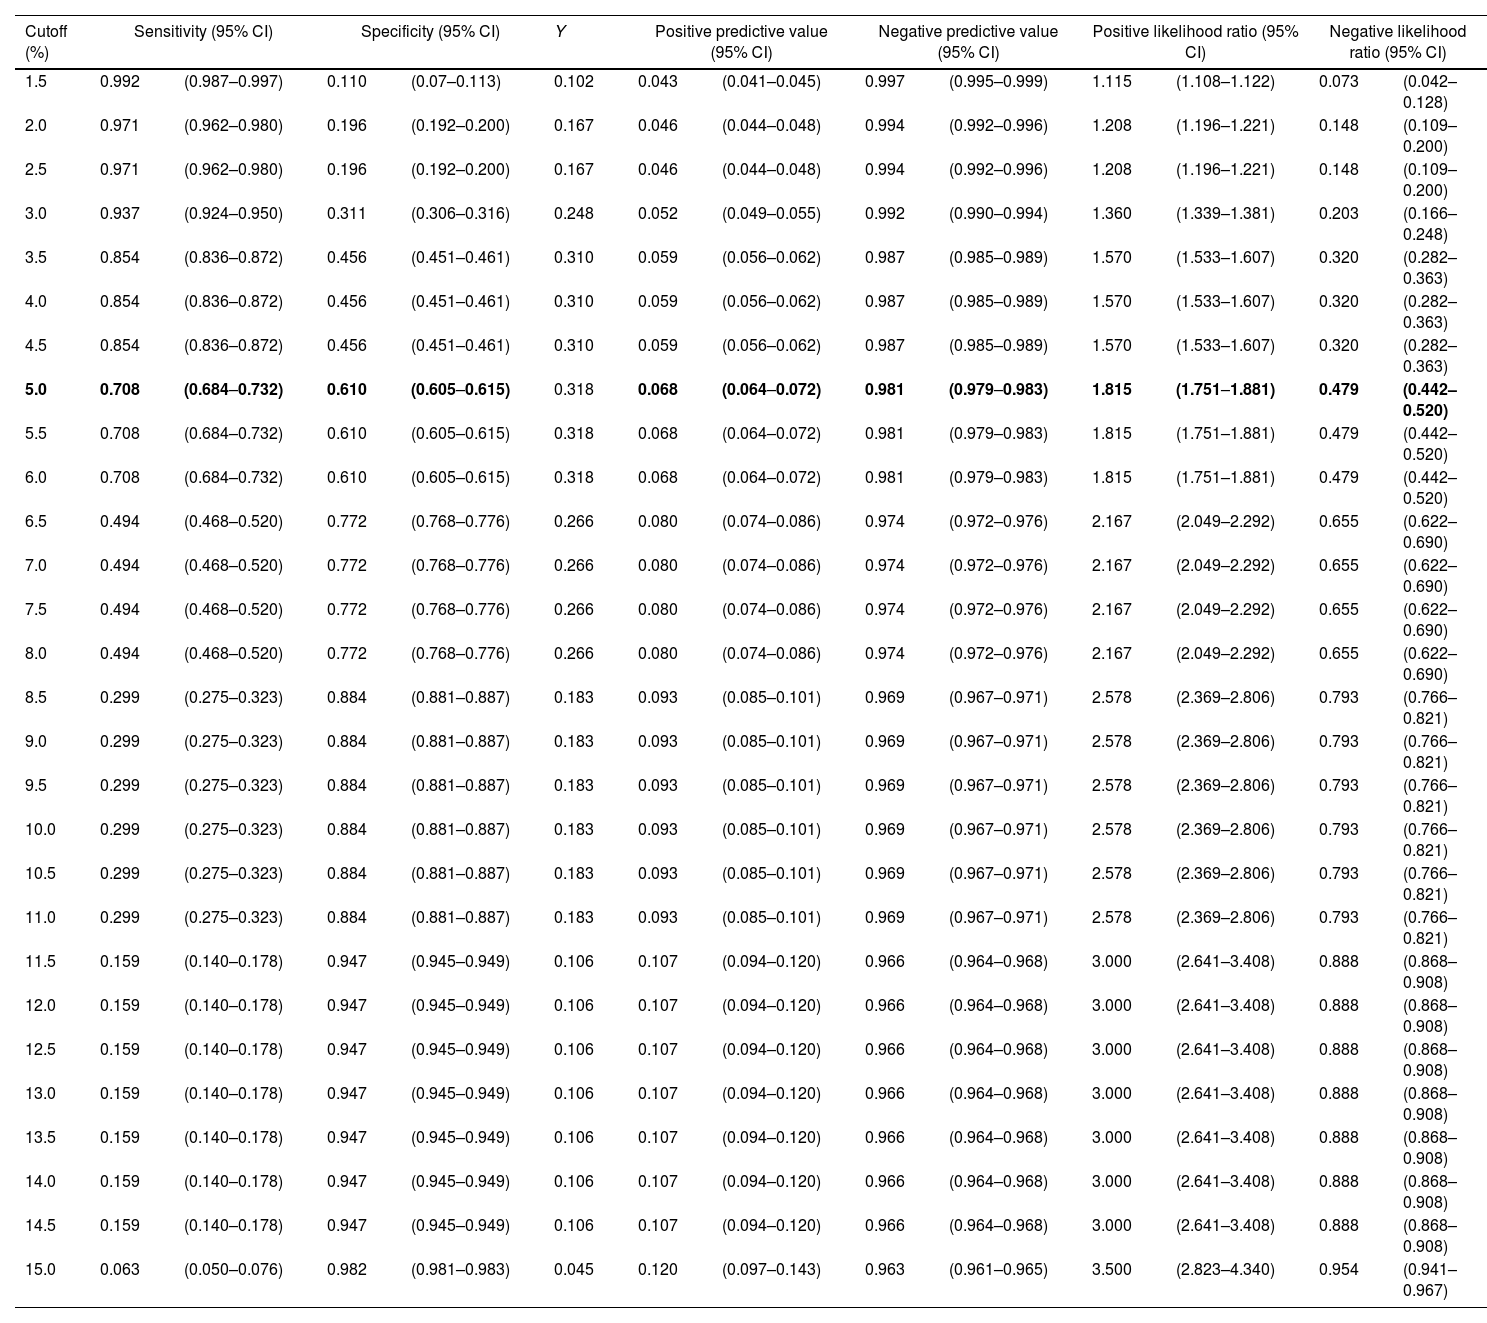
Fig. 2 shows the ROC curve for the risk estimated by FAscore and the cases of AF observed (AUC 0.715, 95% CI 0.703–0.727). Table 2 shows the possible risk cutoff points. The 5% cutoff provides a sensitivity of 70.8%, specificity of 61.0%, PPV of 6.8%, NPV of 98.1%, and positive and negative likelihood ratios of 1.82 and 0.48, respectively, with a maximum Youden index. A total of 14,803 (40.2%) patients were observed with a risk greater than or equal to 5% measured by FAscore, of which 70.8% were diagnosed with AF during follow-up.
.")
Predictive indicators, according to risk cutoffs as estimated by FAscore.
| Cutoff (%) | Sensitivity (95% CI) | Specificity (95% CI) | Y | Positive predictive value (95% CI) | Negative predictive value (95% CI) | Positive likelihood ratio (95% CI) | Negative likelihood ratio (95% CI) | ||||||
|---|---|---|---|---|---|---|---|---|---|---|---|---|---|
| 1.5 | 0.992 | (0.987–0.997) | 0.110 | (0.07–0.113) | 0.102 | 0.043 | (0.041–0.045) | 0.997 | (0.995–0.999) | 1.115 | (1.108–1.122) | 0.073 | (0.042–0.128) |
| 2.0 | 0.971 | (0.962–0.980) | 0.196 | (0.192–0.200) | 0.167 | 0.046 | (0.044–0.048) | 0.994 | (0.992–0.996) | 1.208 | (1.196–1.221) | 0.148 | (0.109–0.200) |
| 2.5 | 0.971 | (0.962–0.980) | 0.196 | (0.192–0.200) | 0.167 | 0.046 | (0.044–0.048) | 0.994 | (0.992–0.996) | 1.208 | (1.196–1.221) | 0.148 | (0.109–0.200) |
| 3.0 | 0.937 | (0.924–0.950) | 0.311 | (0.306–0.316) | 0.248 | 0.052 | (0.049–0.055) | 0.992 | (0.990–0.994) | 1.360 | (1.339–1.381) | 0.203 | (0.166–0.248) |
| 3.5 | 0.854 | (0.836–0.872) | 0.456 | (0.451–0.461) | 0.310 | 0.059 | (0.056–0.062) | 0.987 | (0.985–0.989) | 1.570 | (1.533–1.607) | 0.320 | (0.282–0.363) |
| 4.0 | 0.854 | (0.836–0.872) | 0.456 | (0.451–0.461) | 0.310 | 0.059 | (0.056–0.062) | 0.987 | (0.985–0.989) | 1.570 | (1.533–1.607) | 0.320 | (0.282–0.363) |
| 4.5 | 0.854 | (0.836–0.872) | 0.456 | (0.451–0.461) | 0.310 | 0.059 | (0.056–0.062) | 0.987 | (0.985–0.989) | 1.570 | (1.533–1.607) | 0.320 | (0.282–0.363) |
| 5.0 | 0.708 | (0.684–0.732) | 0.610 | (0.605–0.615) | 0.318 | 0.068 | (0.064–0.072) | 0.981 | (0.979–0.983) | 1.815 | (1.751–1.881) | 0.479 | (0.442–0.520) |
| 5.5 | 0.708 | (0.684–0.732) | 0.610 | (0.605–0.615) | 0.318 | 0.068 | (0.064–0.072) | 0.981 | (0.979–0.983) | 1.815 | (1.751–1.881) | 0.479 | (0.442–0.520) |
| 6.0 | 0.708 | (0.684–0.732) | 0.610 | (0.605–0.615) | 0.318 | 0.068 | (0.064–0.072) | 0.981 | (0.979–0.983) | 1.815 | (1.751–1.881) | 0.479 | (0.442–0.520) |
| 6.5 | 0.494 | (0.468–0.520) | 0.772 | (0.768–0.776) | 0.266 | 0.080 | (0.074–0.086) | 0.974 | (0.972–0.976) | 2.167 | (2.049–2.292) | 0.655 | (0.622–0.690) |
| 7.0 | 0.494 | (0.468–0.520) | 0.772 | (0.768–0.776) | 0.266 | 0.080 | (0.074–0.086) | 0.974 | (0.972–0.976) | 2.167 | (2.049–2.292) | 0.655 | (0.622–0.690) |
| 7.5 | 0.494 | (0.468–0.520) | 0.772 | (0.768–0.776) | 0.266 | 0.080 | (0.074–0.086) | 0.974 | (0.972–0.976) | 2.167 | (2.049–2.292) | 0.655 | (0.622–0.690) |
| 8.0 | 0.494 | (0.468–0.520) | 0.772 | (0.768–0.776) | 0.266 | 0.080 | (0.074–0.086) | 0.974 | (0.972–0.976) | 2.167 | (2.049–2.292) | 0.655 | (0.622–0.690) |
| 8.5 | 0.299 | (0.275–0.323) | 0.884 | (0.881–0.887) | 0.183 | 0.093 | (0.085–0.101) | 0.969 | (0.967–0.971) | 2.578 | (2.369–2.806) | 0.793 | (0.766–0.821) |
| 9.0 | 0.299 | (0.275–0.323) | 0.884 | (0.881–0.887) | 0.183 | 0.093 | (0.085–0.101) | 0.969 | (0.967–0.971) | 2.578 | (2.369–2.806) | 0.793 | (0.766–0.821) |
| 9.5 | 0.299 | (0.275–0.323) | 0.884 | (0.881–0.887) | 0.183 | 0.093 | (0.085–0.101) | 0.969 | (0.967–0.971) | 2.578 | (2.369–2.806) | 0.793 | (0.766–0.821) |
| 10.0 | 0.299 | (0.275–0.323) | 0.884 | (0.881–0.887) | 0.183 | 0.093 | (0.085–0.101) | 0.969 | (0.967–0.971) | 2.578 | (2.369–2.806) | 0.793 | (0.766–0.821) |
| 10.5 | 0.299 | (0.275–0.323) | 0.884 | (0.881–0.887) | 0.183 | 0.093 | (0.085–0.101) | 0.969 | (0.967–0.971) | 2.578 | (2.369–2.806) | 0.793 | (0.766–0.821) |
| 11.0 | 0.299 | (0.275–0.323) | 0.884 | (0.881–0.887) | 0.183 | 0.093 | (0.085–0.101) | 0.969 | (0.967–0.971) | 2.578 | (2.369–2.806) | 0.793 | (0.766–0.821) |
| 11.5 | 0.159 | (0.140–0.178) | 0.947 | (0.945–0.949) | 0.106 | 0.107 | (0.094–0.120) | 0.966 | (0.964–0.968) | 3.000 | (2.641–3.408) | 0.888 | (0.868–0.908) |
| 12.0 | 0.159 | (0.140–0.178) | 0.947 | (0.945–0.949) | 0.106 | 0.107 | (0.094–0.120) | 0.966 | (0.964–0.968) | 3.000 | (2.641–3.408) | 0.888 | (0.868–0.908) |
| 12.5 | 0.159 | (0.140–0.178) | 0.947 | (0.945–0.949) | 0.106 | 0.107 | (0.094–0.120) | 0.966 | (0.964–0.968) | 3.000 | (2.641–3.408) | 0.888 | (0.868–0.908) |
| 13.0 | 0.159 | (0.140–0.178) | 0.947 | (0.945–0.949) | 0.106 | 0.107 | (0.094–0.120) | 0.966 | (0.964–0.968) | 3.000 | (2.641–3.408) | 0.888 | (0.868–0.908) |
| 13.5 | 0.159 | (0.140–0.178) | 0.947 | (0.945–0.949) | 0.106 | 0.107 | (0.094–0.120) | 0.966 | (0.964–0.968) | 3.000 | (2.641–3.408) | 0.888 | (0.868–0.908) |
| 14.0 | 0.159 | (0.140–0.178) | 0.947 | (0.945–0.949) | 0.106 | 0.107 | (0.094–0.120) | 0.966 | (0.964–0.968) | 3.000 | (2.641–3.408) | 0.888 | (0.868–0.908) |
| 14.5 | 0.159 | (0.140–0.178) | 0.947 | (0.945–0.949) | 0.106 | 0.107 | (0.094–0.120) | 0.966 | (0.964–0.968) | 3.000 | (2.641–3.408) | 0.888 | (0.868–0.908) |
| 15.0 | 0.063 | (0.050–0.076) | 0.982 | (0.981–0.983) | 0.045 | 0.120 | (0.097–0.143) | 0.963 | (0.961–0.965) | 3.500 | (2.823–4.340) | 0.954 | (0.941–0.967) |
Y: Youden index.
Bold values: maximum value of Youden index.
Fig. 3 shows the calibration graph, using eight intervals according to the Hosmer–Lemeshow approach, indicating moderate calibration.
Discussion
This study reports on the external validation of the AF risk scale in hypertensive patients (FAscore), which shows an acceptable predictive capacity (AUC 0.715). The best-performing risk cutoff, providing good predictive indicators, can be set at 5%.
Some differences were observed in the characteristics of the populations used in the original study and the external validation study (Valencian Region vs. Basque Country), both set in primary care: the Baque population was older (mean age 75 years vs. 65 years), had a higher proportion of women (53% vs. 47%), a lower prevalence of obesity (39% vs. 48%) and dyslipidemia (20.3% vs. 42.7%), a higher prevalence of heart failure (3.8% vs. 1.1%), and a larger proportion under pharmacological treatment for hypertension (47% vs. 38%). The cumulative incidence of AF at four years was similar in both populations (3.9% vs. 3.2%). These discordancies may be attributed to differences in behavioral patterns and management of hypertension in the two settings, plus the 10-year gap between the performance of each study. Despite these differences, the predictive capacity of FAscore in the external population (AUC 0.72) can be considered good and is similar to that obtained in the original population (C-index 0.69), demonstrating that FAscore can be applied to patients with hypertension in different regions of Spain.
In the original study, Orozco-Beltran et al.17 did not propose an optimal cutoff point for estimating AF risk with the FAscore. The present study shows that the 5% cutoff yields acceptable sensitivity (70%) and specificity (61%), very high NPV (98%), but low PPV (6.8%), with a maximum Youden index. The PPV is the probability of AF occurring in the following four years when the scale estimates a risk greater than 5%. The low value in our study can be explained by the low cumulative incidence of AF (3.9%).
Similarly, the probability that a patient will not develop AF in the next four years when the FAscore risk is less than 5% is very high: 98%. With these data, and given the low frequency of AF, the FAscore could be used as a screening tool, due to its high NPV and moderate sensitivity, and confirm the diagnosis with opportunistic electrocardiograms or monitoring with ambulatory electrocardiographic recording systems such as a Holter device, watches, textiles, patches, or other portable systems.20
Scientific societies recommend preventive measures and early detection strategies,7 but there are multiple diagnostic pathways, and population-based screening is unfeasible, so careful selection of patients who can benefit most from scales such as the one presented in this study can be of great utility.
Several predictive models for AF have been applied in cohort studies in the general population21–24 as well as specifically in men,25 the biracial population,26 and the Asian population.27 In a recent meta-analysis,28 review authors identified 10 predictive models for AF: the length of follow-up ranged from 5 to 11 years, and the number of predictors, from 5 to 18 variables, with a maximum of 27 unique variables. Age was the only parameter used in all models; other predictors were sex; BMI; blood pressure; the presence of comorbidities such as diabetes, heart failure, stroke, myocardial infarction, and COPD; and behavioral risk factors like smoking and alcohol intake. The FAscore uses only four variables, which coincide with some of these other models: age, sex, BMI, and the presence of heart failure. The difference between the number and type of predictors may be due to the fact that these studies are applied to the general population, while the FAscore is indicated only in people with hypertension. Regarding predictive capacity, the meta-analysis estimates a C-index of 0.70 (95% CI 0.66–0.76). This discriminative capacity is similar to that obtained in the present study with an external population. Only one study has been undertaken in a population with diabetes and hypertension, with a total of 14 variables, with a C-index of 0.69 in external validation.29 On the other hand, most scales make 10-year predictions; however, the possibility of shorter-term predictions (four years in our study) enables better tailoring of preventive measures and a more immediate perception of risk, both for health professionals and patients.
The limitations of the study include the possible existence of unknown predictors not included in the model, although with only four predictors (age, sex, BMI, and presence of heart failure), the FAscore achieves an acceptable predictive capacity. While medical record review studies may also have data quality limitations, these are common in studies of this type, and external validation is acceptable.
ConclusionThis investigation presents the external validation in the Basque country of the AF risk scale in hypertensive patients (FAscore), demonstrating a satisfactory predictive capacity with an AUC of 0.715 in an external cohort, and could be a useful tool for clinical practice in patients with arterial hypertension. Optimal predictive performance is achieved with a risk cutoff set at 5%.
The FAscore was originally constructed in hypertensive patients in primary care in the Valencian Region.
In the original study did not propose an optimal cutoff point for estimating AF risk with the FAscore.
What this study contributesThe external validation in the Basque Country of the atrial fibrillation risk scale in hypertensive patients shows an acceptable predictive capacity.
The best-performing risk cutoff, providing good predictive indicators, can be set at 5%.
Since this was a clinical history review study, the need for informed consent was waived.
FundingThis study was funded by the Spanish Ministry of Science and Innovation (MICINN) and Carlos III Health Institute (ISCIII)/European Regional Development Fund (ERDF) (RICAPPS: RD21/0016/0024). The funder played no role in the design, conduct, or reporting of this study.
Conflicts of interestThe authors declare no conflict of interest. The funders had no role in the design of the study; in the collection, analyses, or interpretation of data; in the writing of the manuscript; or in the decision to publish the results.
Data availabilityThe data underlying this article will be shared on reasonable request with the corresponding author.