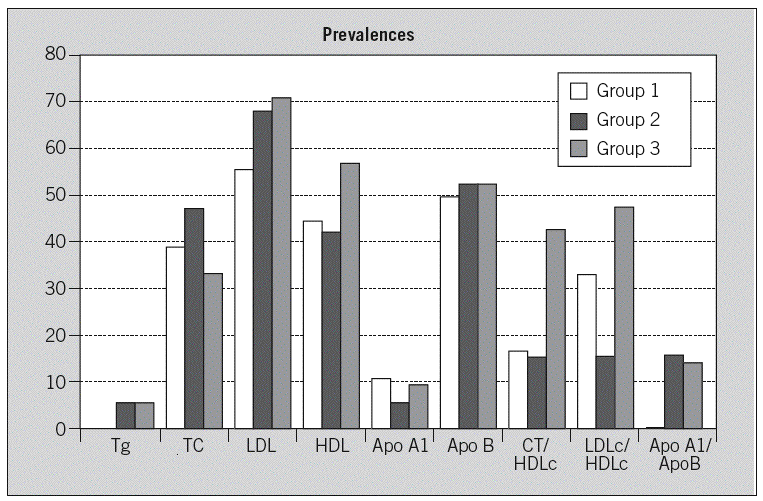
Fig. 1. Prevalence of children at risk according to their lipid, lipoprotein and apolipoprotein concentrations and lipoprotein ratios at age 4. Group 1: children with normal lipid, lipoprotein and/or apolipoprotein levels at birth; group 2: children with high cholesterol levels at birth; group 3: children with normal cholesterol but altered lipid, lipoprotein and/or apolipoprotein levels at birth. For more details, see «Subjects and method». Apo: apolipoprotein; HDL: high density lipoproteins; HDLc: HDL-cholesterol; LDL: low density lipoproteins; LDLc: LDL-cholesterol; TC: total cholesterol; Tg: triglycerides.

Fig. 2. Percentage of children at age 4 with an unsuitable diet according to some coronary artery disease criteria. Group 1: children with normal lipid, lipoprotein and/or apolipoprotein levels at birth; group 2: children with high cholesterol levels at birth; group 3: children with normal cholesterol but altered lipid, lipoprotein and/ or apolipoprotein levels at birth. SFA: saturated fatty acids. For more details see «Subjects and method» section.
Fig. 3. Spearman's correlations between lipoprotein variables at birth and at age 4 in all participants. Apo: apolipoprotein; HDLc: high density lipoproteins-cholesterol; LDLc: low density lipoproteins-cholesterol; NS: not significant; TC: total cholesterol. ap < 0.05; bp < 0.01; cp < 0.001.
Fig. 4. Spearman's correlations between lipoprotein variables at birth and at age 4 in group 1 (G1), group 2 (G2), and group 3 (G3). For identification, see figure 1. Apo: apolipoprotein; HDLc: high density lipoproteins-cholesterol; LDLc: low density lipoproteins-cholesterol; TC: total cholesterol. ap < 0.05; bp < 0.1.
Fig. 5. Percentage of neonates at low and at high cardiovascular risk taking into account lipid, lipoproteins, apolipoproteins remaining at low or high cardiovascular risk, considering the same variables, at age 4. Apo: apolipoprotein; HDLc: high density lipoproteins-cholesterol; LDLc: low density lipoproteins-cholesterol; TC: total cholesterol. p: p-value for *2 test.
Fig. 6. Percentage of neonates at low and high cardiovascular risk taking into account lipoprotein and apolipoprotein ratios that remain at low or high cardiovascular risk, considering the same variables, at age 4. Apo: apolipoprotein; HDLc: high density lipoproteins-cholesterol; LDLc: low density lipoproteins-cholesterol; TC: total cholesterol. p: p-value for *2 test.